Factor analysis of dynamic PET images: beyond Gaussian noise
Texte intégral
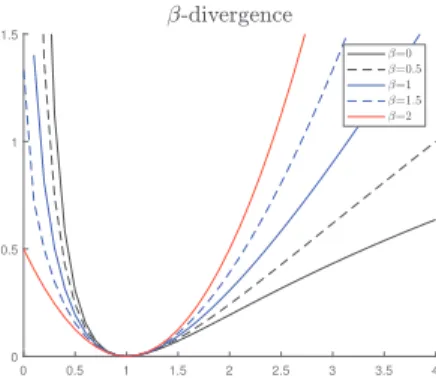
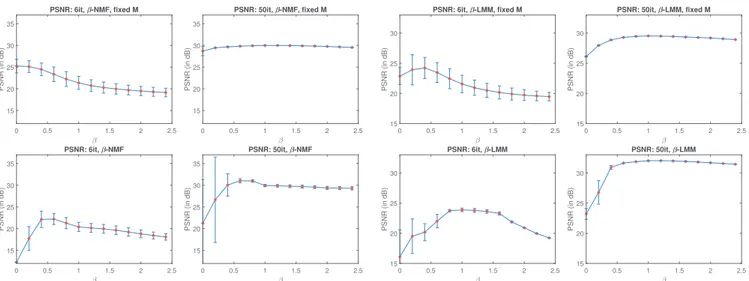
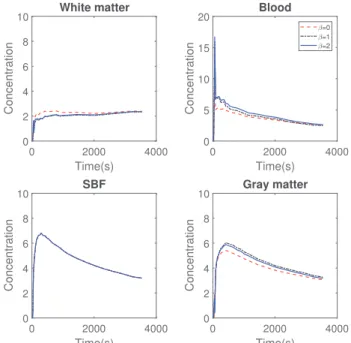
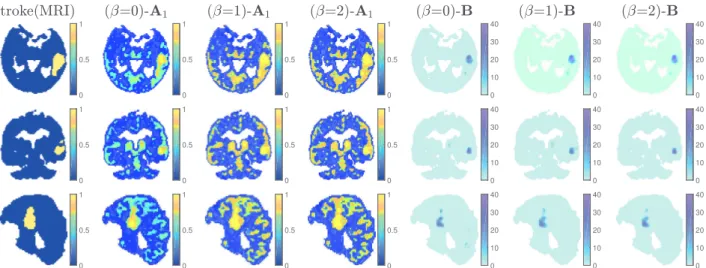
Figure
Documents relatifs
In a lesser extent, some alternative measures of dependence have also been used for spatial point processes, namely Brillinger mixing [4, 16] (which only applies to stationary
Nakano M, Hoshino Y, Mii M (1994) Regeneration of transgenic plants of grapevine (Vitis vinifera L.) via Agrobacterium rhizogenes-mediated transformation of embryogenic calli. J Exp
Fin octobre 2016, 754 100 personnes sont inscrites à Pôle emploi sans être tenues de rechercher un emploi, qu'elles soient sans emploi (catégorie D) ou en emploi (catégorie
For each detected event, the energy and position of the β particle, the time of flight (TOF) and position of the recoil ion, the time of the event within the trap- ping cycle, and
Importance of the pressure force to determine the magnetic field for different values of the Lundquist number.. The system we consider
This is a critical parameter in astrophysics because at temperaturesT^jLO 1 °K of interest, nucleons and leptons are the only weakly interacting particles present and the time
In terms of housing wealth and other real estate, the SHP can identify only primary home wealth net of mortgages, CH-SILC can identify total housing wealth, but not primary home
Beyond the need for a single redshifted absorption component to explain the Lyman-α profile asymmetry (see Sect. 4.3), we tried to constrain the presence of an absorption component
