To cite this version : Cougo, Bernardo and Tran, Duc-Hoan and Segond, Gilles
and Hilal, Alla Influence of PWM methods in semiconductor losses of 15kVA three-phase SiC inverter for aircraft applications. (2017) In: EPE (18th International Conference on Electronic Power Engineering), 11 September 2017 - 14 September 2017 (Varsow, Poland).
O
pen
A
rchive
T
OULOUSE
A
rchive
O
uverte (
OATAO
)
OATAO is an open access repository that collects the work of Toulouse researchers and makes it freely available over the web where possible.
This is an author-deposited version published in : http://oatao.univ-toulouse.fr/ Eprints ID : 18244
To link to this
article:DOI:
10.23919/EPE17ECCEEurope.2017.8099043
URL :
http://dx.doi.org/10.23919/EPE17ECCEEurope.2017.8099043
Any correspondence concerning this service should be sent to the repository administrator: [email protected]
Influence of PWM methods in semiconductor losses of 15kVA three-phase
SiC inverter for aircraft applications
Bernardo Cougo, Duc-Hoan Tran, Gilles Segond, Alaa Hilal
Institut de Recherche Technologique Saint-Exupéry, IRT
118, route de Narbonne - CS 44248. 31432.
Toulouse, France
Tel.: +33 / (0) – 5 61 00 05 55
E-Mail: [email protected]
URL: http://www.irt-saintexupery.com
Keywords
«Silicon Carbide (SiC) », « MOSFET », « Electrical drive », « Device characterisation », « Switching losses », « Pulse Width Modulation (PWM) ».
Abstract
In near future, modern aircrafts will be more electrical, having more power converters in different applications. Inverters is one of the most common applications, which are used in actuators, cabin pressurization, among others. In order to significantly reduce weight, size and losses of these converters, disruptive technology such as Wide Bandgap components (SiC and GaN transistors) should be used. In this paper, we study the influence of SiC components in a 540V/15kVA inverter for motor driving applications. The approach proposed here starts by the dynamic characterization of SiC modules with the aim of obtaining accurate switching energies in order to precisely calculate semiconductor losses in three-phase inverters. Then, precise conduction and switching loss calculation is developed to verify the influence of PWM methods on losses of this converter. A generic 15kVA inverter setup is built. Experimental results in this setup confirm the characterization and loss calculation and shows the best PWM methods for specific aircraft applications.
Introduction
Replacement of conventional pneumatic, hydraulic, and mechanical systems by electrical ones in aircrafts is usually a concept of what is called “More Electrical Aircrafts” (MEA). This replacement can only be effective if power converters have a significant reduction of losses and weight, which can only be enabled by the use of disruptive technology such as SiC and GaN semiconductors. This technology will allow us increasing switching frequency with the consequent filter reduction and/or decreasing semiconductor losses. Loss reduction may avoid liquid cooling inside aircrafts, and consequently increasing reliability and reducing maintenance costs.
Given the voltage level of future aircrafts (540V in DC buses), 1200V SiC modules are the best candidates for boosting efficiency and power density of new power converters [1]. However, there is a lack of knowledge about how to use these components as well as a lack of information on datasheets which can be used to design converters.
Thus, one of the aims of this paper is to show an approach to precisely calculate losses in three-phase inverters using experimental data from an accurate characterization of switching energies of Wide Bandgap components. Another objective is to show the influence of different PWM methods on reducing losses of three-phase inverter with floating neutral point. The influence of PWM methods is analyzed taking into account measured switching characteristics of the SiC modules.
A three-phase SiC inverter, such as the one in Fig. 1, is designed for 540V DC bus voltage and 15kVA rated power, using a 1200V/50A six-pack SiC module from WOLFSPEED, reference CCS050M12CM2. This converter is conceived as flexible as possible so different parameters can be changed in order to verify their influence. These parameters are: driver parameters (gate resistance and voltage), converter parameters (input voltage, output current, output current ripple) and controller
parameters (dead-time, switching frequency, PWM method). Controller of this converter is also designed for maximum flexibility, using a DSP TMS320F28335 from Texas Instruments.
Experimental results are obtained using the designed three-phase SiC converter and they verify the approach developed to precisely calculate losses of SiC inverters. Also these results confirm the loss reduction in the converter when using different PWM methods.
Dynamic characterization of SiC components
Switching losses in power converters are not always possible to calculate using transistor datasheets because either there is not enough data given by manufacturers or because they may not be representative of losses in the real converter.
Switching energies in datasheets are often measured using the “double pulse” method [2]. This method has serious drawbacks, such as: - current sensing using resistors or current transformer changes the commutation loop resistance and inductance, which change the switching behavior; - current in the transistor’s parasitic capacitance is not measured by this method, which reduces accuracy, especially for low current switching. As a consequence, the calculated switching energy may be inaccurate, especially when it is applied to fast switches such as SiC transistors.
A more accurate method for measuring switching losses in fast components such as SiC and GaN transistors is called the “modified opposition method” and is explained in [3]. This method consists of an association of two identical half bridges containing the 4 identical devices (SiC MOSFETs in this case) supplied by the same source. One half-bridge operating as a generator and the other as a receptor. An inductive link connects both converters and the control of the current flowing from one half-bridge to the other is made by small differences applied to the duty cycle and phase-shift of applied switching signals of both half-bridges. Like this, one can estimate turn-on and turn-off losses separately.
This method was applied to characterize the CCS050M12CM2 SiC module from WOLFSPEED, which is a six-pack 1200/50A SiC module suitable for the power and voltage levels required in a typical aircraft application (15kVA and 540V, respectively). Fig. 2 presents the switching energies measured with the method explained above for different currents, for two different DC bus voltages (270 and 540V) and for the following parameters: gate resistance Rg=10Ω, gate-source voltage Vgs=-4V/20V and dead time DT=400ns. These values were obtained at room temperature T=25°C.
Fig. 1: Basic three-phase inverter with floating neutral-point, used as reference in calculation of semiconductor losses.
Fig. 2: Experimental switching energy as function of switching current and voltage. Left-side (Isw<0) turn-on energy. Right-side (Isw>0) turn-off energy.
Loss calculation for different PWM methods
Semiconductor losses in three-phase inverters depend on conduction and switching losses. Both types of losses depend on the current waveform flowing in each phase, which is composed by the fundamental value If and the ripple Ir. The fundamental value depends mainly on the load (typically a sinusoidal current at low frequency) while the ripple depends on the duty cycle of each switching period and the inductance in the output of each bridge leg (either the filter’s or the load’s inductance). In a three-phase system where the neutral point of the load in floating, such as in Fig. 1, current ripple of phase A, for
example, depends not only on the duty cycle of phase A but also on the neutral point voltage which depends on the duty cycle of the three phases. Like this, current ripple has a different waveform when compared to single-phase system or to a three-phase system where the neutral point voltage is fixed (for example when connected to the middle-point of the DC bus). To show this different, we give as an example typical waveform of a current in the output of a bridge leg in a single-phase system (Fig. 3a) and also in a three-phase system with floating neutral-point (Fig. 3b). Note that for these two configurations, the RMS values of the ripple IrRMS and the value of the switched current is different and they have to be taken into account when calculating conduction and switching losses in semiconductors. The three-phase SiC inverter considered in this work is represented in Fig. 1 and has a floating neutral point. Thus, currents having the waveform of Fig. 3b will be considered for loss calculation as will be shown below.
a) b)
Fig. 3: Waveforms of output current in a phase of a) single-phase or three-phase system with fixed neutral-point voltage and b) three-phase system with floating neutral point voltage.
Conduction loss is calculated considering that the system is symmetrical and balanced and thus half the time of a fundamental period the current flows through each transistor of the bridge leg. Current flowing through the diode (or body diode) connected to each transistor exists only during the dead-time and losses generated in these diodes are negligible when compared to the MOSFET losses. Consequently, conduction losses Pcond in each bridge-leg can be calculated as:
Pcond=RDSon∙ IfRMS2 +IrRMS2 (1)
where IfRMS is the RMS value of the fundamental current and RDSon is the on-state resistance of a MOSFET at a certain junction temperature. For the SiC power module used in this work, RDSon at 25°C is 25mΩ and it increases with the temperature with the following equation, obtained by fitting the curve given in the components datasheet.
RDSon(T)=25mΩ∙(3 ∙ 10 ∙ ∆ +0.001 ∙ ∆ + 0.9625) (2)
where ∆T is the temperature difference between the junction temperature and 25°C.
The RMS value of the ripple current IrRMS is computed calculating the ripple for each duty cycle in a fundamental period, by considering that the output voltage of each phase is applied to an inductance (either from a inductive load such a motor, or an output filter) of value Lout. The voltage applied to these inductances is the voltage difference between each phase and the neutral-point voltage. For example, the current ripple of output current IA in Fig.1 is:
Iout= 1 ( − ) (3) where = + + (4)
t
I
At
I
AThe waveform of only the ripple of the current shown in Fig. 3b is shown Fig.4. This waveform shape values change not only with inductance value Lout, but also with the switching frequency, the DC bus voltage and the PWM method, which modifies the voltage waveforms in each phase and also in the neutral-point. The RMS value of this current ripple IrRMS is numerically calculated.
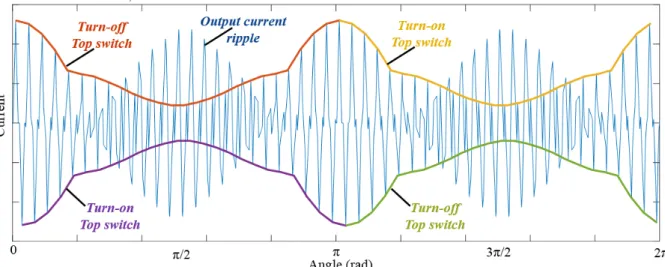
Also, for each duty cycle of a fundamental period, the switched current is determined. Then, depending on the current sign and output voltage commutation (from –VDC/2 to +VDC/2 or vice-versa), we determine if a turn-off or turn-on energy is lost. In the example of Fig. 4, we plot not only current ripple waveform but also the values of the switched current (thick lines), and we identify if it corresponds to a turn-off or a turn-on, from the bottom or the top switch of the bridge-leg. Using this information and the curve shown in Fig. 2, switching energy at each switching period can be calculated for the whole fundamental period and switching losses can be estimated. Note that different switching ripple can significantly change switching losses as shown in [4]. Another interesting aspect to note is that, as shown in Fig. 4, in a three-phase system, switched current does not correspond to the maximum or minimum value of the current ripple in switching period, as it happens in a single-phase system.
Fig. 4: Waveform of output current ripple in one of the phases of a three-phase inverter feed inductive load. Switched currents at each switching period is marked with a thick line. They correspond to either a turn-off or turn-on energy of the bottom or top switch of the bridge-leg, as indicated in the figure. An algorithm using MATLAB was created to compute conduction and switching losses in a three-phase inverter using the SiC module cited above. As an example, we show results for the driver parameters: Vgs=-4V/20V, Rg=10Ω, DT=400ns; and the system parameters: VDC=540V, output current Iout = 26.3A, angle between fundamental values of output current and voltage ϕ=0°, modulation index M=1 and switching frequency Fsw=50kHz. At this operation point, output power is Pout=15kW, sinusoidal modulation is used and the current ripple was considered to be negligible. These values were calculated for a junction temperature of components Tj=55°C.
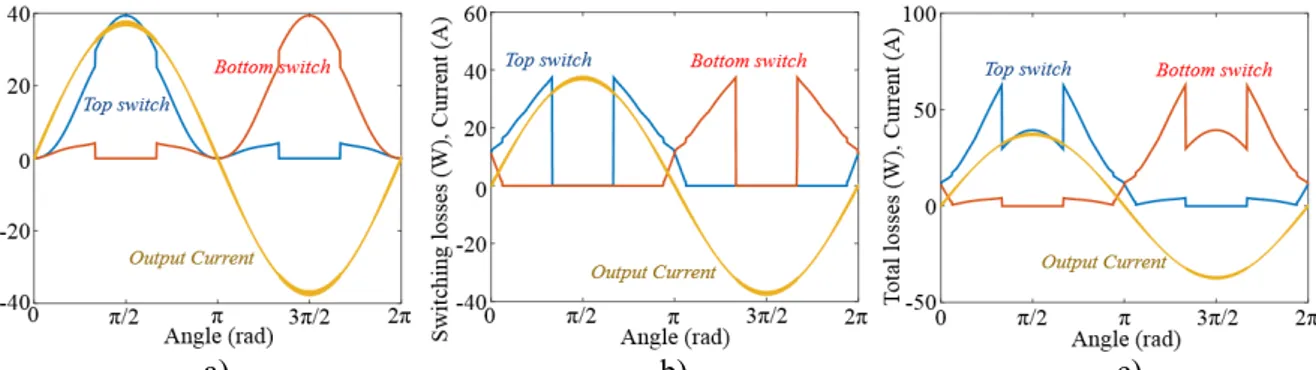
Results of the instantaneous conduction losses for each transistor of one phase is shown in Fig. 5a as well as the corresponding output current. Fig. 5b shows the instantaneous switching losses averaged in a switching period, i.e. the total switching energy lost in a switching period divided by the switching period value. Total losses in each transistor is shown in Fig. 5c. Note that the conduction and switching losses occur at the highest output current. Thus in order to reduce losses and consequently increase efficiency of the inverter, PWM methods can be used to reduce losses specifically at the moments where they are at their maximum. This will be explained below.
a) b) c)
Fig. 5: Instantaneous values of a) conduction, b) switching and c) total (conduction+switching) losses in the top and bottom switches of one bridge leg of a three-phase inverter having: VDC=540V, Iout = 26.3A, ϕ=0°, M=1, Fsw=50kHz. Modulation method used is Sinusoidal (SPWM).
PWM methods
These different PWM methods consist on modifying the voltage reference of each phase by injecting common-mode offsets (or also called Zero Sequence Signals) to each phase voltage reference. This common-mode voltage applied to the 3 phases is found in the neutral point of the load (which is floating) and, as a result, the phase-neutral voltage in each phase of the load has exactly the waveform of the original reference (usually a sinusoidal waveform). This degree of freedom (common-mode voltage in all 3 phases) was initially used in inverters in order to increase the linearity range of the output voltage [5] and later to reduce the THD of the output current or to reduce switching losses in the converter. There are different PWM methods which have been used in the industry and also in the literature. They are usually identified as Continuous PWM (CPWM) and Discontinuous PWM (DPWM) methods. CPWM modulation waveforms are always strictly within the boundaries imposed by the triangular carriers while DPWM references can vary outside carrier bands resulting in output voltage clamped to the positive and/or negative DC rail. If no low frequency distortion of the output voltage is allowed, clamping may be imposed at most 120° of the reference wave in each phase. This clamping results in no commutation in one of the phases for at most 1/3 of the fundamental period. As a result, switching losses are reduced as well as total losses. Explanation of most of these zero sequence signals can be found in [6].
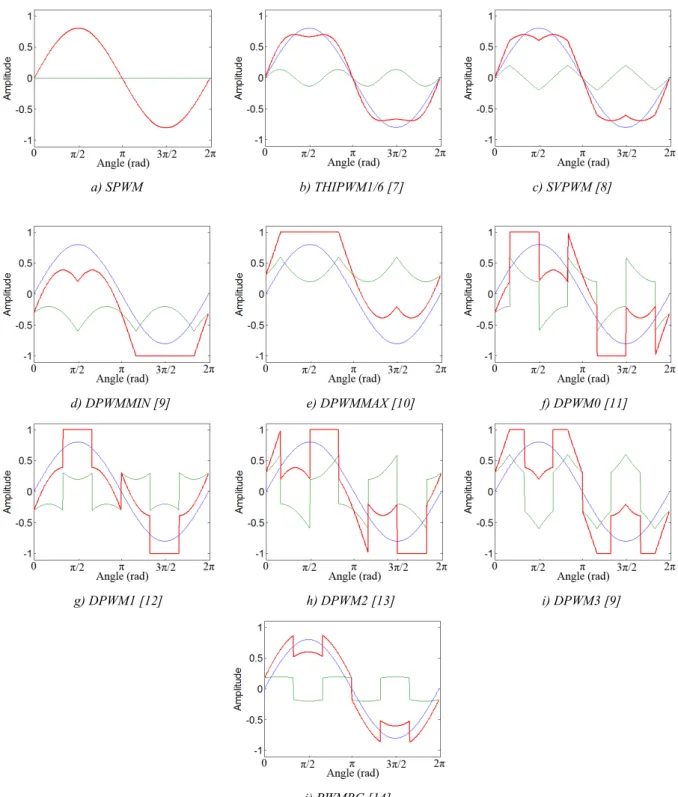
The zero sequence signals (green lines) considered for comparison are shown in Fig. 6 along with the sinusoidal reference (blue lines) and the reference after the zero sequence injection (red lines), at modulation index 0.8.
One of these methods is the DPWM1, which clamps the reference into the positive rail for 60° centered at the maximum value of the sinusoidal reference and it also clamps the reference into the negative rail for 60° centered at the minimum value of the sinusoidal reference. The result of this method in conduction, switching and total losses of semiconductor for the same conditions of the example above (Fig. 5) is shown in Fig. 6. Note that during 60° in each switch there is no switching losses and no conduction losses. Besides that, as in any inverter, there is also no switching losses at almost half cycle depending on the output current sign. Total losses in the three phases of the power module decrease from around 152W to 110W when changing the PWM method from SPWM to DPWM1. Confirmation of loss calculation procedure shown here and the loss variation for different PWM methods will be shown using the experimental setup shown below.
a) SPWM b) THIPWM1/6 [7] c) SVPWM [8] d) DPWMMIN [9] e) DPWMMAX [10] f) DPWM0 [11] g) DPWM1 [12] h) DPWM2 [13] i) DPWM3 [9] j) PWMBC [14]
Fig. 6: Sinusoidal reference (blue line), zero order sequence (green line) and modified reference signal after zero order sequence injection for different PWM methods (modulation index M=0.8).
a) b) c)
Fig. 7: Instantaneous values of a) conduction, b) switching and c) total (conduction+switching) losses in the top and bottom switches of one bridge leg of a three-phase inverter having: VDC=540V, Iout=26.3A, ϕ=0°, M=1, Fsw=50kHz. Modulation method used is DPWM1.
Experimental setup and results
A three-phase inverter composed of a SiC power module (six-pack 1200/50A from WOLFSPEED, reference CCS050M12CM2) was designed to verify losses in the system. Experimental setup is shown in Fig. 8 and the three-phase inverter in Fig. 9. Power is measured in the input and directly in the output of each phase (no filtering), using a ZES ZIMMER LMG640 high bandwidth high precision power analyzer having a best accuracy of 0.01%. A passive three-phase RL load of 6.7Ω and 6mH per phase is connected to the output of the inverter. This load has an angle of ϕ=17° at a fundamental frequency of 50Hz. Special flexible drivers were designed to drive the SiC module. These drivers can provide high peak current and have variable gate resistance and gate-source voltage levels. The fixed parameters for the experimental results shown here are Vgs=-4V/20V, Rg = 10Ω.
Fig. 8: Experimental setup to test three-phase SiC inverter.
Fig. 9: Generic 15kVA/540V three-phase SiC inverter.
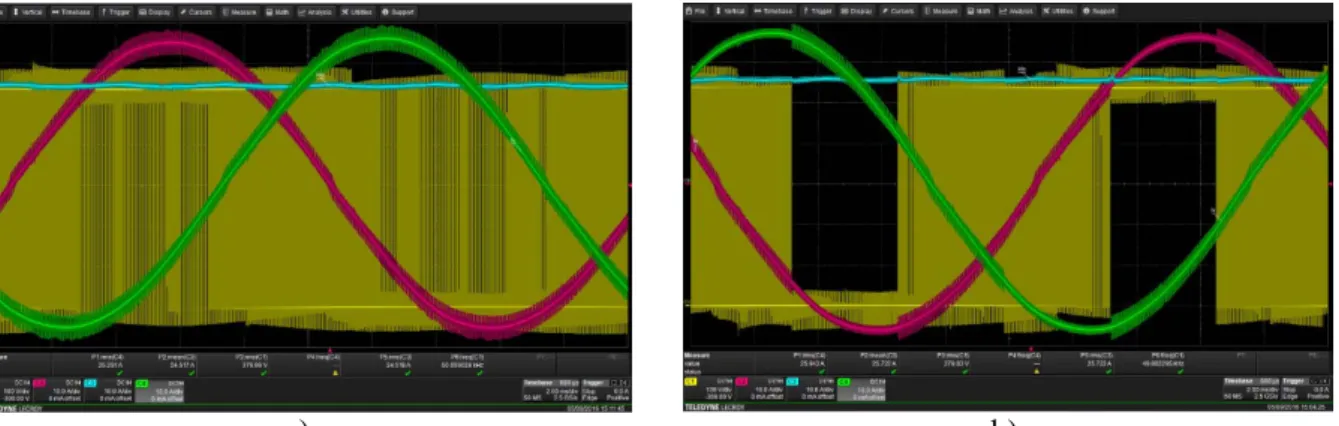
Some experimental waveforms having Fsw=50kHz are shown in Fig. 10 using a LeCroy HDO6054 (500MHz bandwidth, 2.5GS/s sampling) oscilloscope. Currents of phases A and B are measured as well as the input current and the switched voltage at the output of phase A to the negative point of the DC bus. Figures 10a and 10b show these waveforms for SPWM and DPWM1 methods respectively. Note in Fig. 10b that phase A does not switch during 120° but the current waveforms are still sinusoidal.
a) b)
Fig. 10: Experimental results: current of phase A (red) and phase B (green), input current (blue) and voltage of phase A (yellow) waveforms for methods a) SPWM and b) DPWM1. Parameters: Rg=10Ω, Fsw=50kHz, Vgs=20V). Load power is around 13kVA.
Losses on the three-phase inverter were measured for different PWM methods and for the parameters shown above. Since the system was running on open loop, the output current and power varied for different PWM methods, but all the output currents are between 23.6 and 25.2A (output power from 12 to 13.5kVA). Measured losses are shown as blue bars in Fig. 11. Also in this figure, we show in orange bars, the corresponding losses calculated using the MATLAB algorithm developed and described above. We have added the calculation of some fixed losses existing in the real three-phase inverter such as: losses on connections (around 10mΩ of connection resistances on input and average of 5.7mΩ of connection resistances in each output), on resistances to discharge the bus capacitors (2.2W). All these “extra” resistances were measured separately. Also the resistance of each transistor inside the SiC module was measured (average of 25.25mΩ for the 6 transistors at 25°C) and the temperature of the SiC module case was measured to accurately estimate conduction losses.
Estimated inverter losses are about 5% lower than that of experimental measurements. This difference can be explained by non-modeled losses such as connection losses at high frequency (switched current between switches and bus capacitors) and also by the loss measurement precision given the poor accuracy of the power analyzer in this configuration (only about 1% of the total measured power in the input and the output represent the losses). Accurate power measurements at such high efficiency is an important challenge as shown in [15]. Also, the accuracy of the measured losses is reduced by the high frequency voltage in the output of the converter (Fsw=50kHz).
Results confirm that using discrete methods such as DPWMMAX, DPWM1 or DPWM2, losses at such switching frequency is reduced nearly 18% (154 to 127W) when compared to classical methods such as sinusoidal (SPWM) or Space-Vector (SVPWM). Efficiency of this inverter can be increased from 98.7% to 99.06% at 50kHz.
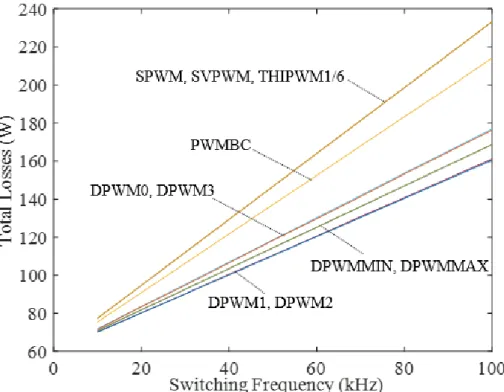
Obviously, the gain of using discrete PWM methods is higher for higher switching frequencies. On the other hand, these methods are not so advantageous at low switching frequency. To show that, total losses of the SiC inverter of Fig. 9 were calculated for output power of 13.5kVA for switching frequencies varying from 10 to 100kHz.These losses are plotted on Fig. 12. Note that all Continuous PWM methods have the same losses since they always switch the same current and have the same number of commutations in a fundamental periods. DPWM1 and DPWM2 are the methods resulting in lowest losses since they stop switching for 120° at the moments where the output current is the highest. At Fsw=10kHz, losses for SPWM are equal to 77.4W while for DPWM1 they are equal to 70.1W, which is a reduction of 9.4%. However, at Fsw=100kHz, losses for SPWM is equal to 233W while for DPWM1 it is equal to 160W, which is a reduction of 31.3%.
Fig. 11: Total losses of three-phase inverter at around 12kVA (for Continuous PWM methods) and 13.5kVA (for Discontinuous PWM methods) and Fsw=50kHz. Blue bars show values from experimental results and orange bars from calculated values using switching energies obtained from experimental characterization as shown in Fig. 2. Low difference between experimental results and calculation show the accuracy of the approach proposed in this work.
Fig. 12: Calculated total losses of three-phase inverter at 13.5kVA for different PWM methods and different switching frequencies. Total losses using DPWM1 are 9.4% and 31.3% lower than that using SPWM at 10 and 100kHz respectively.
Conclusion
This document focused on the analysis of semiconductor losses in a three-phase inverter connected to an aeronautic HVDC bus (at 540V) intended to drive 15kVA motors. This converter is based on a 1200V/50A SiC module from WOLFSPEED (reference CCS050M12CM2). Switching energies for different voltages and currents were obtained by a unique dynamic characterization of this SiC module. These results were used to precisely calculate semiconductor losses in the three-phase inverter when varying the PWM method applied to the converter.
Calculation results were compared to experimental results measured from the designed three-phase SiC inverter. This comparison showed differences between measured and calculated losses of around 5%, for any PWM method, for output power from 12 to 13.5kVA, and for switching frequency of 50kHz. At this switching frequency, efficiency of the designed converter is around 99%, which shows the high performance of SiC MOSFETs on aircraft applications.
Results based on precise loss calculation show that Discontinuous PWM methods can reduce total losses of up to 31% when compared to Continuous PWM methods at high switching frequencies such as 100kHz. However, at low frequencies (10kHz), loss reduction is only 9.4%.
References
[1] J. Biela, M. Schweizer, S. Waffler, J. W. Kolar, “SiC versus Si - Evaluation of Potentials for Performance Improvement of Inverter and DC-DC Converter Systems by SiC Power Semiconductors”, IEEE Transactions on Industrial Electronics, Vol. 58, No. 7, pp. 2872-2882, July 2011.
[2] Z. Zhang, F. Wang, L. M. Tolbert, B. J. Blalock and D. J. Costinett, “Evaluation of Switching Performance of SiC Devices in PWM Inverter-Fed Induction Motor Drives”, IEEE Transactions on Power Electronics, vol. 30, no. 10, pp. 5701-5711, Oct. 2015.
[3] B. Cougo, H. Schneider, T. Meynard, “Accurate switching energy estimation of wide bandgap devices used in converters for aircraft applications”, 15th European Conference on Power Electronics and Applications (EPE), Lille, France. 2-6 Sept. 2013.
[4] B. Cougo, H. Schneider, T. Meynard, “High current ripple for power density and efficiency improvement in wide bandgap transistor-based buck converters”, IEEE Transactions on Power Electronics, vol. 30, no. 8, pp. 4489-4504, 2015.
[5] K. G. King, “A three phase transistor class-b inverter with sinewave output and high efficiency”, Proc. Inst. Elec. Eng. Conf. Publ. 123, 1974, pp. 204-209.
[6] A. M. Hava, “Carrier based PWM - VSI drives in the overmodulation region”, PhD Dissertation. University of Wisconsin, Madison, USA. 1998.
[7] G. Buja and G. Indri. “Improvement of pulse width modulation techniques”, Archiv fur Elektrotechnik, 57, pages 281-289, 1975.
[8] H. Van Der Broeck, H. Skudelny, and G. Stanke. “Analysis and realization of a pulse width modulator based on voltage space vectors”, IEEE-IAS Conf. Records., pages 244-251, Denver, USA, 1986.
[9] J. W. Kolar, H. Ertl, and F. C. Zach. “Minimization of the harmonic RMS content of the mains current of a PWM converter system based on the solution of an extreme value problem”, ICHPC Conf. Records, pages 234 -243, Budapest, Hungary, 1990.
[10] K. Taniguchi, Y. Ogino, and H. Irie. “PWM technique for power MOSFET inverter”, IEEE Trans. on Power Electronics, pages 328-334, July 1988.
[11] T. Kenjo. Power Electronics for the Microprocessor Age. Oxford University Press, 1990. [12] J. Schorner, “Bezugsspannung zur umrichtersteuerung”, ETZ-b, Bd.27, pages 151-152, 1975.
[13] S. Ogasawara, H. Akagi, and A. Nabae. “A novel PWM scheme of voltage source inverter based on space vector theory”, European Power Electronics Conf. Records, pages 1197-1202, Aachen,Germany, 1989. [14] B. Cougo, T. Meynard, F. Forest, E. Laboure, “Optimal PWM method for flux reduction in InterCell
Transformers coupling double three-phase systems”, XIIIème Conférence Electronique de Puissance du Futur, Saint-Nazaire - France. 2010.
[15] J. W. Kolar, F. Krismer, Y. Lobsiger, J. Mühlethaler, T. Nussbaumer, J. Miniböck, “Extreme Efficiency Power Electronics,” Proceedings of the International Conference of Integrated Power Electronics Systems (CIPS 2012), Nuremberg, Germany, March 6-8, 2012.