O
pen
A
rchive
T
OULOUSE
A
rchive
O
uverte (
OATAO
)
OATAO is an open access repository that collects the work of Toulouse researchers and
makes it freely available over the web where possible.
This is an author-deposited version published in :
http://oatao.univ-toulouse.fr/
Eprints ID : 17158
The contribution was presented at INTERSPEECH 2016 :
http://www.interspeech2016.org
To cite this version : Fontan, Lionel and Ferrané, Isabelle and Farinas,
Jérôme and Pinquier, Julien and Aumont, Xavier Using Phonologically
Weighted Levenshtein Distances for the Prediction of Microscopic
Intelligibility. (2016) In: Annual conference Interspeech (INTERSPEECH
2016), 8 September 2016 - 12 September 2016 (San Francisco, CA, United
States).
Any correspondence concerning this service should be sent to the repository
administrator:
[email protected]
Using Phonologically Weighted Levenshtein Distances for the Prediction of
Microscopic Intelligibility
Lionel Fontan
1,2, Isabelle Ferran´e
2, J´erˆome Farinas
2, Julien Pinquier
2, Xavier Aumont
11
Archean Technologies, Montauban, France
2
Universit´e de Toulouse, UPS, IRIT, Toulouse, France
{lfontan, xaumont}@archean.fr, {ferrane, jfarinas, pinquier}@irit.fr
Abstract
This article presents a new method for analyzing Automatic Speech Recognition (ASR) results at the phonological feature level. To this end the Levenshtein distance algorithm is refined in order to take into account the distinctive features opposing substituted phonemes. This method allows to survey features additions or deletions, providing microscopic qualitative infor-mation as a complement to word recognition scores. To explore the relevance of the qualitative data gathered by this method, a study is conducted on a speech corpus simulating presbycusis effects on speech perception at eight severity stages. Consonan-tic features additions and deletions in ASR outputs are analyzed and put in relation with intelligibility data collected in 30 human subjects. ASR results show monotonic trends in most conso-nantic features along the degradation conditions, which appear to be consistent with the misperceptions that could be observed in human subjects.
Index Terms: Microscopic Intelligibility, Levenshtein Dis-tance, Phonological Features, ASR
1. Introduction
Today most of the models and systems developed to predict speech intelligibility, whether based on ASR techniques [1, 2, 3]
or not (ex. Rasti [4]) are designed to fit quantitative data
only, i.e. percent correct words observed in human listeners. These approaches could therefore be complemented by qual-itative data brought by microscopic intelligibility prediction, which attempts to predict (mis)perceptions observed in humans [5]. Such qualitative data could help to diagnose and qualify in a more precise way the degradations occurring in speech signals – whether they appear during speech production, transmission or reception.
The goal of this present work is twofold. Firstly, it aims at presenting a method for the calculation of phonologically weighted Levenshtein distances (PWLD), which can be used to get more precise distances between target words and recog-nized words than simple edition distances, and which also were found to constitute better predictors of speech intelligibility [6]. Secondly, an exploratory study is reported, which aims at using PWLD to monitor phonological features additions and deletions in degraded speech simulating age-related hearing losses.
2. Assessing ASR performances at the
phonological feature level with the PWLD
method
2.1. The use of Levenshtein algorithm to calculate phono-logical distances
The Levenshtein algorithm [7] permits to calculate the edi-tion distance between two symbol strings, that is the minimal number of symbol additions, substitutions or deletions that are needed in order to transform a string a into a string b. The Lev-enshtein algorithm is based on dynamic programming and can be formalized as in the equation 1 (inspired by the work of [8]) if considering that all editing operations are weighted with a value equal to 1.
if min(i, j) = 0 leva,b(i, j) = max(i, j)
else leva,b(i, j) = min
leva,b(i − 1, j) + 1
leva,b(i, j − 1) + 1
leva,b(i − 1, j − 1) + 1(ai6=bj) whereai6=bjis a function returning 0 whenai=bjand 1 otherwise
(1)
The Levenshtein distance is used for a great variety of appli-cations, among which the calculation of phonological distances between words. It is used for example in the field of dialec-tology to survey the distance between cognates and calculate the mutual intelligibility of two linguistic systems [9, 10]. For example, following the calculation presented in (1) the Lev-enshtein distance between the two phonetic strings[p@ti] and [apeti] is 2, because two operations are required to pass from one to another: the deletion of the consonant[p] and the substi-tution of the central vowel[@] by the front vowel [e].
2.2. Taking phonologic features into account for weighting phoneme substitutions
Using the Levenshtein algorithm as described in (1) to calcu-late phonological distances between lexical units does not ac-count for the fact that two phonemes may be more or less close depending on the number of distinctive features they share to-gether. For example, the distance between the French words /bo/ (beau) and /p˜o/ (pont) is the same as between /bo/ (beau) and/öi/ (riz), that is 2, even thought the first pair of words shares more phonological features than the second pair and may thus be thought as much closer perceptively.
To refine the baseline version of the algorithm and to be able to calculate PWLD the indicator functionai6=bj given in
equation (1) was replaced by a function returning:
• 1 if the substituted phonemesaiandbj were opposed on
the vocalic feature (e.g. a vowel and a consonant); • the number of features distinguishing the substituted
phonemes ai and bj divided by the total number of
phonological features otherwise. For example if the
phoneme/p/ is substituted by /b/, the function will re-turn1/8, that is 0.125, because only the voice feature distinguishes the two units among the eight features con-sidered in consonants.
Table 1: Examples of phonologically weighted Levenshtein dis-tances (PWLD) and non weighted Levenshtein disdis-tances (LD).
Word #1 Word #2 LD PWLD
/bat˜o/
/pato/ 2 0.29
/pit˜o/ 2 0.63
/bani/ 2 1.17
For a direct application to French language the distinc-tive features considered in the algorithm were those described by [11], consisting of eight features distinguishing between con-sonants vs. six features for vowels. As an illustration Table 1 shows phonological distances between French words using the Levenshtein distance in its original form vs. with a weighting based on phonological features. Using this method, feature-level information can be extracted from the errors made by an ASR system. When computing the PWLD between the target utterances and the ASR responses, information can indeed be gathered about which phones were substituted and thus about which phonological features were added or deleted during these substitutions.
3. Using PWLD to study
micro-intelligibility of speech signals
simulating presbycusis
To conduct a first exploration of the reliability and relevance of the phonological feature-level information gathered through PWLD calculation on ASR results, we sought to apply this method on a degraded speech corpus. To this end, speech stim-uli simulating age-related hearing losses (presbycusis) at eight severity stages were used. We expected to observe monotonic trends in phonological features additions and deletions along the degradation conditions, suggesting that the gathered data is closely related to the modifications occurring at the acous-tic level. The second objective of this study was to check if the observed data was consistent with misperceptions observed in human listeners.
3.1. Speech stimuli
A subset of the stimuli used in the study reported in [1] was used. This subset consists of 60 disyllabic nouns, always pre-ceded by the French definite article le. The words were recorded by a native French male speaker, and were artificially degraded in order to simulate presbycusis effects on speech perception at eight different severity grades, leading to a set of 540 stim-uli: 60 non degraded utterances + 60 utterances * 8 presbycusis simulation conditions.
The signal degradations were done by using the algorithm described in [12], taking as input parameters the eight audio-grams presented in figure 1. The eight audiogram values were calculated upon the basis of the hearing loss prevalence study conducted by [13] in 3,753 subjects. They represent mean hear-ing losses typically observed in people aged from 60 years old (audiogram 1) up to 104 years old (audiogram 8). For each au-diogram the algorithm produced new audio files simulating the main effects of presbycusis by applying three signal processing methods:
1. filters were used to simulate reduced audibility in differ-ent frequency bands;
2. a spectral smearing algorithm was used to simulate re-duced frequency selectivity [14];
3. the signal envelope was raised to a power of two for sim-ulating the effect of loudness recruitment [15].
Hearing L evel (dBHL) Frequency (Hz) 125 250 500 750 1k 1.5k 2k 3k 4k 6k 8k 0 10 20 30 40 50 60 70 80 90 audiogram 1 audiogram 2 audiogram 3 audiogram 4 audiogram 5 audiogram 6 audiogram 7 audiogram 8
Figure 1: Audiograms used to simulate presbycusis effects on speech perception.
3.2. Methods
3.2.1. ASR system
An ASR system based on Sphinx-3 [16] and distributed by Carnegie Mellon University was used, with acoustic models including 35 phones and five kinds of pause. Acoustic mod-els were trained on the basis of French radio broadcasts [17], and made available by the Laboratoire d’Informatique de
l’Universit´e du Maine (LIUM) for speech recognition in French
language [18, 19]. They are continuous models consisting
of 5,725 context-dependent states (22 Gaussian mixtures per state), designed to process 16 kHz speech samples using a PLP feature extraction [20]. A bigram language model was set up to take into account the lexical and phonological characteristics of the target words. Each item consisting of a definite article and a noun beginning with a consonant (e.g. le vacher,[l@vaSe]), a list of 15,146 French nouns responding to such constraints was used. To reflect the frequency of these forms in spoken French, the frequencies values defined by [21] and available in the database Lexique 3.81were also taken into account.
3.2.2. PWLD implementation and use
In order to get a maximum of information about the phonetic confusions made by the ASR system, the use of several ASR
outputs for each stimulus (n-best possibilities) was considered. An optimal number of ASR outputs was defined by analyzing the recognition scores improvement brought by each increment in best possibilities cardinal, based on the recognition of the 60 non degraded words of the corpus (figure 2). The regression fit shows that the recognition score improvement reaches a ceiling effect when using more than five best possibilities, suggesting that the amount of noise in ASR results may also increase above this threshold. As a result, only the five best possibilities given by the system were used to calculate phonological distances.
Number of ASR best answers
Absolute gain 5.00 3.75 2.50 1.25 0.00 2 3 4 5 6 7 8 9 10
Figure 2: Absolute recognition scores improvement (% correct words in a total set of 60 words) for each increment of the num-ber of best answers considered in ASR system results, and re-gression curve (R2= .99).
For each stimulus and according to the algorithm described in section 2, phonological distances between the target word and the five best answers provided by the ASR system were computed. During each PWLD calculation record was kept about the phones substitutions and thus about the phonologi-cal features additions or substitutions. This procedure led to mean addition and deletion scores for each feature, as a function of speech degradation condition. The non degraded condition (“audiogram 0” condition) was used to normalize the scores.
3.2.3. Collecting human data
Data pertaining to human perception of the stimuli are taken from a previous study involving speech intelligibility tests (rep-etition task) in 30 French participants [1]. All participants were native French speakers, aged from 18 to 30 years old, and did not suffer from any hearing loss superior to 15 dB, on average, between 2 kHz and 8 kHz. Contrary to the study reported in [1], this present study focus was not set on intelligibility scores (quantitative scores corresponding to percent correct words) but rather on the “errors” made by listeners, that is the alternative answers they provided and that may give qualitative informa-tion on their mispercepinforma-tions. To this end all alternative answers given by participants were transcribed.
3.3. Results
3.3.1. Phonological feature changes in consonants
Figures 3 and 4 illustrate the percentage of phonological fea-ture additions and deletions in ASR results, for consonants, as a function of the eight presbycusis simulation conditions. The condition 0 corresponds to the original recordings, without any signal processing.
As it can be observed, most of the phonological feature additions and deletions follow rather monotonic trends,
show-% Featur e addition -25 -19 -13 -6 0 6 13 19 25
Audiogram used for presbycusis simulation 0 1 2 3 4 5 6 7 8 Anterior Back Continuant Coronal High Nasal Sonorant Voice
Figure 3: Phonological feature additions in consonants, as a function of presbycusis simulation condition.
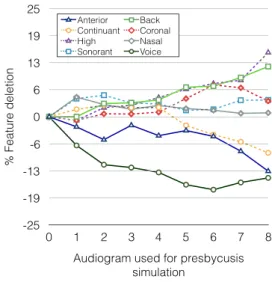
% Featur e deletion -25 -19 -13 -6 0 6 13 19 25
Audiogram used for presbycusis simulation 0 1 2 3 4 5 6 7 8 Anterior Back Continuant Coronal High Nasal Sonorant Voice
Figure 4: Phonological feature deletions in consonants, as a function of presbycusis simulation condition.
ing either a global rise, decrease or a neutral trend along the eight degradation conditions. As it can also be observed, the standard deviations and the monotonicity of these curves are variable. Some features show indeed great changes between conditions 0 and 8 (e.g. addition of the continuant feature) whereas some others show very little changes (e.g. addition of the nasal feature). Concerning the monotonicity, some features show very consistent variation trends along the degradation con-ditions (e.g. addition of the continuant feature) whereas other features seem to follow a more erratic behavior (e.g. additions and deletions of the anterior feature).
3.3.2. Consistency with human listeners’ data: focus on the
continuant feature
As the most important and consistent effects (monotonic in-creases of feature additions and dein-creases of feature deletions) were found for the continuant feature, we chose to focus on
Time (s) 0 0.6944 0 5000 Frequency (Hz) Time (s) 0 0.7474 0 5000 Frequency (Hz) Time (s) 0 0.6944 -0.2738 0.3867 0 Time (s) 0 0.7474 -0.00592 0.005798 0
Figure 5: Spectrograms and waveforms obtained for the word le taquin ([l@tak˜E] ), both in its original recording form (left) and after applying the presbycusis simulation corresponding to the audiogram #7 (right).
this specific feature when observing human listeners’ data. The
continuant feature is the feature that distinguishes occlusive
phonemes from constrictive ones. Occlusive phonemes
im-ply a total occlusion during the first phase of their produc-tion, followed by a sudden burst, especially important in un-voiced phonemes such as /p, t, k/. On the contrary constrictive phonemes imply an undisrupted flow of air during their produc-tion. The data collected in humans is peculiar in that sense that alternative answers (incorrect and non null answers) are mainly present in degradations corresponding to audiograms 6, 7 and 8 (94 answers representing 76% of total alternative answers), conditions in which the speech signal was difficult to under-stand but was nonetheless not enough altered so that listeners could perceive something. As a consequence, human answers were not sufficiently numerous nor enough distributed along the degradations to permit a statistical comparison with ASR re-sults. Nevertheless, we conducted a qualitative analysis of hu-man misperceptions that occurred in degradation conditions 6, 7 and 8. This exploratory qualitative analysis revealed that some alternative answers given by human subjects clearly imply the substitution of non continuant consonants by their continuant counterparts at the same – or to a close – place of articulation
(see examples on Table 2:/p, b/→/f/, /t/→/s/).
Table 2: Examples of substitutions observed in listeners’ re-sponses, and implying the addition of the continuant feature.
Target word Listener response Substitution
Pruneau (/pöyno/) Finot (/fino/) /p/→/f/
R´epit (/öepi/) Refus (/ö@fy/) /p/→/f/
D´epˆot (/depo/) D´efaut (/defo/) /p/→/f/
Turbo (/työbo/) Football (/futbOl/) /t/→/f/
Bilan (/bil˜a/) Fila (/fila/) /b/→/f/
Taquin (/tak˜E/) Saquin (/sak˜E/) /t/→/s/
Taquin (/tak˜E/) Sac (/sak/) /t/→/s/
D´ement (/dem˜a/) Venin (/v@n˜E/) /d/→/v/
As the amount of human misperceptions data is limited, we also searched for evidence about the deletion of acoustic data supposed to be relevant for distinguishing between continuant and non continuant phones. Figure 5 compares the original spectrogram obtained for the target word[tak˜E] and the spec-trogram obtained for the same word at degradation 7. It can be observed that the explosion phase of the plosive[t] almost
disappears at degradation 7, supporting the idea that it could be confused with some realizations of continuant phonemes, as in the alternative answers/sak˜E/ and /sak/ given by some partic-ipants.
4. Conclusion and perspectives
This article presented a new method for analyzing ASR results at the phonological feature level, using a refined version of the Levenshtein distance algorithm. This method, potentially rel-evant for the analysis of speech recognition in a broad range of applications (e.g. robust ASR in adverse conditions, L2 and disordered speech evaluation, dalectology), was here used to an-alyze features additions and deletions occurring in ASR results for speech simulating age-related hearing loss.The results are rather encouraging. Firstly, the
tenden-cies observed in consonantic feature additions and deletions are overall monotonic along degradation conditions, indicating that there is a strong relation between speech signal quality and the “errors” made by the ASR system at the phonological feature level. Secondly, an analysis focusing on the continuant feature suggests that these errors are consistent with human perception of speech: in both ASR and human recognition data this feature tends to be added as the degradation increases.
To deepen these results, the relevance of the method for pre-dicting microscopic intelligibility will be investigated through statistical analyses. To this end two leads are considered. The first one is to conduct additional word repetition tests, concen-trating on the degradation conditions that lead to the most nu-merous alternative answers (i.e. audiograms 6 to 8). The other solution is to conduct closed-set identification tasks constrain-ing the subjects’ answers to particular phonetic contrasts such as in minimal pairs. Eventually statistics will be computed in order to quantify the strength of the association between ASR and human misperceptions at the phonological feature level for each degradation condition.
5. Acknowledgements
This research work was funded by the French National Re-search Agency (ANR), and by the European Regional Develop-ment Fund within the framework of a Midi-Pyr´en´ees region’s AGILE-IT project grant. The project, for which a European patent [22] has been filed, is led by Archean Technologies (Montauban, France).
6. References
[1] L. Fontan, J. Farinas, I. Ferran´e, J. Pinquier, and X. Aumont, “Au-tomatic intelligibility measures applied to speech signals simulat-ing age-related hearsimulat-ing loss,” in Proceedsimulat-ings of Interspeech ’15, Dresden, Germany, 2015, pp. 663–667.
[2] A. Maier, T. Haderlein, U. Eysholdt, F. Rosanowski, A. Batliner, M. Schuster, and E. N¨oth, “PEAKS – A System for the Automatic Evaluation of Voice and Speech Disorders,” Speech
Communica-tion, vol. 51, no. 5, pp. 425–437, 2009.
[3] M. Schuster, A. Maier, T. Haderlein, E. Nkenke, U. Wohlleben, F. Rosanowski, U. Eysholdt, and E. N¨oth, “Evaluation of Speech Intelligibility for Children With Cleft Lip and Palate by Means of Automatic Speech Recognition,” International Journal of
Pedi-atric Otorhinolaryngology, vol. 70, no. 10, pp. 1741–1747, 2006. [4] ISO 9921:2003, Assessment of speech communication.
Interna-tional Organization for Standardization.
[5] R. Marxer, M. Cooke, and J. Barker, “A framework for the eval-uation of microscopic intelligibility models,” in Proceedings of
Interspeech ’15, Dresden, Germany, 2015, pp. 2558–2562. [6] L. Fontan, C. Magnen, J. Tardieu, I. Ferran´e, J. Pinquier, J.
Fari-nas, P. Gaillard, and X. Aumont, “Comparaison de mesures per-ceptives et automatiques de l’intelligibilit´e de la parole : cas de la parole d´egrad´ee par une simulation de la presbyacousie,”
Traite-ment Automatique des Langues, vol. 55, no. 2, pp. 151–174, 2014. [7] V. I. Levenshtein, “Binary Codes Capable of Correcting Dele-tions, InserDele-tions, and Reversals,” Soviet Physics Doklady, vol. 10, no. 8, pp. 707–710, 1966.
[8] R. A. Wagner and M. J. Fischer, “The string-to-string correction problem,” Journal of the ACM (JACM), vol. 21, no. 1, pp. 168– 173, 1974.
[9] W. Heeringa, “Measuring Dialect Pronunciation Differences us-ing Levenshtein Distance,” Ph.D. dissertation, Gronus-ingen Univer-sity, 2004.
[10] K. Beijering, C. Gooskens, and W. Heeringa, “Modeling Intelligi-bility and Perceived Linguistic Distances by Means of the Leven-shtein Algorithm,” in Linguistics in the Netherlands 2008, M. van Koppen and B. Botma, Eds. Amsterdam: John Benjamins, 2008, pp. 13–24.
[11] M. Riegel, Les sons du franc¸ais : phon´etique et phonologie. PUF, 1994.
[12] Y. Nejime and B. C. J. Moore, “Simulation of the Effect of Threshold Elevation and Loudness Recruitment Combined With Reduced Frequency Selectivity on the Intelligibility of Speech in Noise,” Journal of the Acoustical Society of America, vol. 102, pp. 603–615, 1997.
[13] K. Cruickshanks, T. Wiley, T. Tweed, B. Klein, R. Klein, J. Mares-Perlman, and D. Nondahl, “Prevalence of Hearing Loss in Older Adults in Beaver Dam, Wisconsin. The Epidemiology of Hearing Loss Study,” American Journal of Epidemiology, vol. 148, no. 9, pp. 879–886, 1998.
[14] T. Baer and B. C. J. Moore, “Effects of Spectral Smearing on the Intelligibility of Sentences in the Presence of Noise,” Journal of
the Acoustical Society of America, vol. 94, no. 4, pp. 1229–1241, 1993.
[15] B. C. J. Moore and B. R. Glasberg, “Simulation of the Effects of Loudness Recruitment and Threshold Elevation on the Intelligi-bility of Speech in Quiet and in Background of Speech,” Journal
of the Acoustical Society of America, vol. 94, no. 4, pp. 2050– 2062, 1993.
[16] K. Seymore, S. Chen, S. Doh, M. Eskenazi, E. Gouvea, B. Raj, M. Ravishankar, R. Rosenfeld, M. Siegler, R. Stern et al., “The 1997 CMU Sphinx-3 English Broadcast News Transcription Sys-tem,” in Proceedings of the 1998 DARPA Speech Recognition
Workshop, 1998, pp. 55–59.
[17] S. Galliano, G. Gravier, and L. Chaubard, “The ESTER 2 Evalua-tion Campaign for the Rich TranscripEvalua-tion of French Radio Broad-casts,” in Proceedings of Interspeech ’09, Brighton, United King-dom, 2009, pp. 2583–2586.
[18] Y. Est`eve, Traitement automatique de la parole: contributions. Universit´e du Maine, 2009, m´emoire d’habilitation `a diriger des recherches.
[19] P. Del´eglise, Y. Est`eve, S. Meignier, and T. Merlin, “LIUM Speech Transcription System: A CMU Sphinx III-Based System for French Broadcast News,” in Proceedings of Interspeech’05, Lisbonne (Portugal), 2005, pp. 1653–1656.
[20] H. Hermansky, “Perceptual Linear Predictive (PLP) Analysis of Speech,” Journal of the Acoustical Society of America, vol. 87, no. 4, pp. 1738–1752, 1990.
[21] B. New, M. Brysbaert, J. Veronis, and C. Pallier, “The Use of Film Subtitles to Estimate Word Frequencies,” Applied
Psycholinguis-tics, vol. 28, no. 4, pp. 661–677, 2007.
[22] X. Aumont and A. Wilhem-Jaureguiberry, European patent
2136359 – Method and device for measuring the intelligibility of a sound distribution system. Institut National de la Propri´et´e Industrielle, 2009.

![Figure 5: Spectrograms and waveforms obtained for the word le taquin ( [l@tak˜E] ), both in its original recording form (left) and after applying the presbycusis simulation corresponding to the audiogram #7 (right).](https://thumb-eu.123doks.com/thumbv2/123doknet/3173774.90574/5.892.143.759.111.326/spectrograms-waveforms-original-recording-presbycusis-simulation-corresponding-audiogram.webp)