To link to this article :
DOI:10.1016/j.cag.2016.05.009
URL :
http://dx.doi.org/10.1016/j.cag.2016.05.009
To cite this version :
Carlier, Axel and Leonard, Kathryn and Hahmann,
Stefanie and Morin, Géraldine and Colins, Misha The 2D shape structure
dataset: A user annotated open access database. (2016) Computer &
Graphics, vol. 58. pp. 23-30. ISSN 0097-8493
O
pen
A
rchive
T
OULOUSE
A
rchive
O
uverte (
OATAO
)
OATAO is an open access repository that collects the work of Toulouse researchers and
makes it freely available over the web where possible.
This is an author-deposited version published in :
http://oatao.univ-toulouse.fr/
Eprints ID : 17156
Any correspondence concerning this service should be sent to the repository
administrator:
[email protected]
Special Issue on SMI 2016
The 2D shape structure dataset: A user annotated open access database
Axel Carlier
a,n
, Kathryn Leonard
b, Stefanie Hahmann
c, Geraldine Morin
a, Misha Collins
da
University of Toulouse, CNRS (Laboratoire IRIT), France
b
Department of Mathematics, California State University Channel Islands, Camarillo, CA, USA
cUniversité Grenoble-Alpes, CNRS (Laboratoire Jean Kuntzmann), Inria, Grenoble, France dGISHWHES, Inc., Los Angeles, CA, USA
Keywords: 2d shape decomposition 2d shape hierarchy 2d shape structure Datasets Crowdsourcing Medial axis
a b s t r a c t
In this paper we present the 2D Shape Structure database, a public, user-generated dataset of 2D shape decompositions into a hierarchy of shape parts with geometric relationships retained. It is the outcome of a large-scale user study obtained by crowdsourcing, involving over 1200 shapes in 70 shape classes, and 2861 participants. A total of 41,953 annotations has been collected with at least 24 annotations per shape. For each shape, user decompositions into main shape, one or more levels of parts, and a level of details are available. This database reinforces a philosophy that understanding shape structure as a whole, rather than in the separated categories of parts decomposition, parts hierarchy, and analysis of relationships between parts, is crucial for full shape understanding. We provide initial statistical explorations of the data to determine representative (“mean”) shape annotations and to determine the number of modes in the annotations. The primary goal of the paper is to make this rich and complex database openly available (through the websitehttp://2dshapesstructure.github.io/index.html), provid-ing the shape community with a ground truth of human perception of holistic shape structure.
&2016 Elsevier Ltd. All rights reserved.
1. Introduction
This paper presents a large user study of geometric shape structure annotation for the MPEG-7 database of 2D shapes. We define a geometric shape structure as a shape representation con-taining the following three components: (1) a decomposition of the shape into parts based as much as possible on geometry rather than semantics, (2) a hierarchy of parts representing the scale at which each part becomes significant, and (3) an understanding of the relationship between parts at various scales and locations.
Each of the three components is of interest on its own. 2D shape decomposition into meaningful parts is a fundamental problem that has been studied in different fields such as shape modeling, computer vision, psychology and cognition with a broad number of application domains such as shape analysis, shape matching, shape retrieval, shape representations and modeling. Part hierarchies allow for multiscale shape decomposition and shape comparison. Part relationships allow for shape alignment and recognition. Together, the geometric shape structure allows for full shape understanding, which is essential for structure-aware shape processing applications such as shape synthesis, modeling or animation[1].
There has been extensive research done the last two decades on shape decompositions [2–6,8–18]. The different criteria used to guide a partition of a shape into “meaningful parts” may vary between geometric, functional, probabilistic and semantic or may be expressed in terms of minimizing some cost function. These criteria are generally derived from or related to psychological studies showing that humans use generic perception rules when they are asked to decompose an outline into parts. As stated recently by Lai and Wang [2], however, human decomposition behavior is so complex that despite an impressive number of existing methods there is still a need for improvement in order to comprehensively describe human behavior and to derive
Fig. 1. Annotations from our user study: main shape (black), parts (magenta), details (green). These annotations provide three possible decompositions of the shape. While users agree about the hierarchy of the selected parts, they differ in their selection of parts. (For interpretation of the references to color in this figure caption, the reader is referred to the web version of this paper. In print version, black appears black, magenta appears as light gray, green appears as dark gray.)
n
Corresponding author.
computationally faithful algorithms. Validation of segmentation algorithms thus becomes a tedious task.
Without a ground truth dataset, existing methods must settle for comparison to previous methods, but the goal should be to provide a segmentation coherent with human perception. Given that human behaviors in shape decomposition cannot be uniquely defined in terms of geometry[2], a ground truth is best obtained by a user study where the number and variety of participating subjects is large enough to be as meaningful as possible. On one hand, there may exist two or more valid decompositions for the same shape (Fig. 1). On the other hand, the same partition of the shape into parts can lead to different hierarchies (Fig. 2). In the literature, existing studies lack significant participant size or shape variety to capture this nuance, as the experiments are usually fil-tered to remove singular users (outliers), and one ground truth segmentation is retained (typically the majority vote)[3–6].
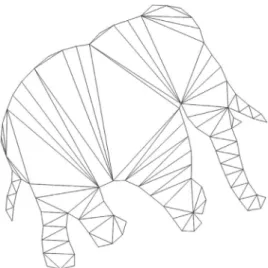
In this paper we present the 2D Shape Structure Dataset col-lected by an extended user study via crowdsourcing to obtain 2D shape partitioning into a hierarchy of shape parts. Users in the study provided a shape decomposition based on the Delaunay triangulation of the shape, which is known to capture human shape perception[7], and labeled each triangle to indicate its level in the part hierarchy. As shown inFig. 3, the edges of the Delaunay triangulation accommodate part transitions well. These edges correspond to the local axes of symmetry, and will occur for any salient shape protrusion.
Because the Delaunay triangulation is dual to the discrete medial axis of the shape, the annotation provides all three com-ponents of a geometric shape structure: parts decomposition, parts hierarchy, and relationships between parts via the medial axis graph structure. Indeed, the link to the medial axis provides (a) local feature size via the medial axis radius function, (b) feature depth via any one of a number of measures such as SAT[8], (c) sub-tree structures capturing interaction between parts at differ-ent levels, and (d) geometric relationships between parts via the angle of connection of the corresponding medial branches.
The goals of this dataset are to collect and share user-defined shape parts and hierarchies in a format that encodes part rela-tionships, to provide ground truth for shape decomposition for a popular 2D shape database, and to focus on geometric inter-pretation rather than semantics, function, or other categorization of parts. By sharing the data with the research community, we hope to prompt important discussions about geometric shape structures themselves, as well as their relationship to semantics, functionality, and other modalities.
All collected and processed data are publicly available at http://2dshapesstructure.github.io/index.html. The proposed benchmark Shape Structure Database has the following relevant features.
!
A collection of over 1200 shapes has been annotated by 2861 users of various demographics resulting in 41,953 annotated shapes. For each shape, a set of at least 24 annotations are available giving a decomposition into a main shape, one or more levels of parts, and a level of shape details. The complete raw data is available.!
The input curves and shape discretizations, along with asso-ciated triangulations, are available in two formats, *.obj and *. json.!
All annotation results are available in a .csv file.!
Extracted shape statistics, such as the majority vote shape and a recommended number of modes for each shape class, are available.The remainder of the paper is organized as follows:Section 2 details previous work on 2D shape decomposition, including articles, available datasets, and user-studies results; Section 3 describes the user study setup and results; andSection 4proposes an analysis of the dataset.
2. Related work 2.1. Shape decomposition
Decomposing 2D shapes into meaningful parts has been an active research area for decades. Existing methods include convex and near-convex parts decomposition[9–13,5], methods based on outline-related factors such as curvature and cut length[4,14], or methods based on skeletons and graphs [3,15,16], convolutions combined with a persistence measure [17], or optimization and probabilistic methods[13,2]. Combining these different tools has also led to efficient shape decompositions, such as in[2].
The goal of these methods is to automatically partition a shape into independent parts, mimicking as faithfully as possible what would be done by a human, to recover partitions coherent with perception. Such partitions of shapes, however, are not structure-aware: they lack both a hierarchy of parts and an understanding of the relationship between parts. As such, these methods fail to capture the relevant importance of the identified parts. They also usually require additional shape processing such as noise removal. Fig. 4 shows the difference between classical decomposition methods and the results of our user study. Whereas classical decomposition methods give a partition of the shape and part neighborhoods through cell adjacencies, our user annotations
Fig. 2. Two meaningful annotations for a butterfly from our user study: main shape (black), parts (magenta), details (green). These annotations give similar decom-positions but different shape structures due to the difference in parts hierarchy. Whereas the users agree about the shape details (green), they diverge in deter-mining the main shape. (For interpretation of the references to color in this figure caption, the reader is referred to the web version of this paper. In print version, black appears black, magenta appears as light gray, green appears as dark gray.)
Fig. 3. Delaunay triangulation for the elephant-1 shape. Note that the Delaunay edges provide clean cuts for each salient part.
partition the shape into a hierarchy that inherits rich topological and geometric information from the medial structure, as discussed in Section 1. Note also that our user annotations occasionally violate some of the guidelines generally followed in algorithms, such as decomposition into convex regions as seen in the main shape for the elephant.
Similarly, most of the work on parts hierarchy draws on the medial axis[3,18]and lacks an accompanying shape decomposi-tion. Consequently, we believe the shape community would ben-efit from results that establish a connection between parts decompositions and their hierarchies for standard shape databases such as MPEG-7. It is such a connection that our database provides. 2.2. Existing shape databases
Most of the shape decomposition literature from the last two decades refers to one of two 2D shape databases for testing and validation purposes: the Kimia1 dataset (1995) containing binary
images of shape silhouettes for birds, bones, brick, camels, car, children, classic cards, elephants, etc., and the MPEG-7,2database
(2000) developed as part of the MPEG-7 standards project[19], containing 70 classes of shapes given as binary images with 20 examples of each class, for a total of 1400 shapes. Another data-base of hand drawn black-and-white pictures, called S&V datadata-base, is available by Snodgrass and Vanderward[20]. The ETHZ shape database gives original natural scene images and their associated shape contours[21].
2.3. User studies
The literature shows several user studies related to shape decomposition[3,4,22,13]. For example, [13,23]evaluate 12 user segmented shapes on 10 shapes for 20 categories of the MPEG-7 database for use as ground truth for the proposed shape
decomposition methods. None of the data from these user studies is publicly available, and none presents a full shape structure. The only user study with collected data available3to the community
was conducted by De Winter and Wagemans in 2006 [6]. They provide a benchmark that contains the cuts proposed by 201 users on 88 shapes. A set of cuts correspond to a decomposition, but no information on relative importance of the parts appear here.
Some work exists for 3D as well, such as the Princeton 3D shape dataset[24]that provides a benchmark on 380 meshes for 19 categories (humans, chair, bird, hand, etc.) annotated on aver-age by 11 humans who indicated cuts using an interactive mentation tool developed by the authors. A survey on 3D seg-mentation can be found in[25].
3. Data collection
Our goal is to establish a ground truth for human-derived geometric shape structure, a perceptual decomposition into a hierarchy of parts in such a way that relationships between parts are retained. We test on a large number of shapes, including reg-ular and irregreg-ular shapes, simple and complex shapes, as well as shapes with and without semantic meaning. The MPEG-7 dataset offers 1440 shapes and 70 shape categories, and we add to that a selection of artificial shapes without semantic meaning.
With the augmented MPEG-7 dataset, we conducted a crowd-sourced user-study to guarantee a large number of participants. In contrast to previous work, where users have been asked to decompose a shape into parts, we collected information about full shape structure: parts decomposition, parts hierarchy, and rela-tionship of parts. We asked users to label the interior regions of shapes by coloring triangles in the associated Delaunay triangu-lation to indicate membership in one of three or more levels: main shape, parts (with possibly multiple part levels), and details. In the two following subsections, we describe the process used to collect the dataset.
3.1. Preprocessing of shapes
The experiment was conducted online. All shapes underwent the same four preparation steps. Shape outlines (closed polygonal curves) were computed by applying contour detection to the binary images. The interiors were discretized into triangles via Delaunay triangulation. Note that we limited the number of tri-angles to about a hundred per shape so that tritri-angles were suffi-ciently large to be distinguished by the user on a screen. We accomplished this by sub-sampling the boundary curves accord-ingly before computing a triangulation[26]. Finally, we removed all shapes ( " 200 shapes) exhibiting features with triangles that became degenerate after subsampling (for example, some beetles with extremely thin antennae). 1250 shapes remained, belonging to 69 categories. We also added a few shapes with no semantic meaning to capture purely geometric decomposition.
3.2. The user study – a crowdsourcing experiment
Setup: We implemented a web-based user interface to collect user annotations describing perceptual shape structure. The interface allows users to label each triangle of the Delaunay tri-angulation of the shape as belonging to one of three or more categories by color coding. By default, three part levels are defined
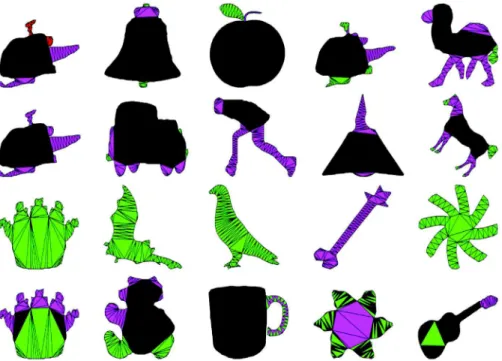
Fig. 4. Results from[10](1st row),[9](2nd row),[14](3rd row) compared to majority vote results from our user study for four shapes.
1
Kimia datasets:http://yacvid.hayko.at
2
MPEG-7 dataset:http://www.dabi.temple.edu/ " shape/MPEG7/dataset.html
3De Winter/Wagemans dataset:http://www.gestaltrevision.be/en/resources/
supplementary-material/129-de-winter-a-wagemans-brmic-2004-stimuli-sets-a-datasets
as Main Shape, Parts, Details, and associated with black, magenta, and green. The user was allowed to define additional levels of parts.Fig. 5shows our interface, which looks like a digital coloring system. Once a color has been selected, the user colors the trian-gles by dragging the mouse across a shape region or by clicking individual triangles which appear progressively during coloring. Additional actions provided to ease the interactions include: ● undo previous action (circle with arrow button);
● remove a triangle's annotation (right click); ● replace a triangle color with a new one; ● initialize the hierarchy with a single color; ● finish coloring all remaining triangles with green ● find remaining triangles and zoom into them; ● zoom and pan (mouse wheel);
● follow progress indicating the ratio of colored triangles. Each user is given 20 shapes sequentially to color, 16 randomly selected shapes and 4 (so-called) “Gold Standard” shapes used to evaluate user reliability appearing at position 1, 6, 11 and 16.
Tutorial: An interactive tutorial guides the user through all possible interactions with the system. The purpose of the tutorial is to teach the use of the interface by forcing the user to use every action at least once. Each step consists of either reading a short text or performing an action. Explanatory text pops up around specific widgets. The user is not told what a “good” shape anno-tation is nor how to decompose a shape.
Scavenger hunt: We launched our user study as part of the one-week, international online scavenger hunt GISHWES 2015 with tens of thousands of participants of all ages from across the world. Our study was one task among more than 200 tasks for the sca-venger hunt, and consisted of annotating 20 shapes from our shape dataset. Users were strongly encouraged, although not forced, to view the tutorial before starting the task. They were told the task has scientific purposes: “providing shape decompositions according to your human brain will allow the researchers to know what humans perceive as main body, parts, and details.” The task
was described as: “You will be shown a sequence of shapes and asked to color-code regions according to whether they are main body, parts, or details […] Try to determine which regions are in which level based on visual shape alone instead of function.” In order to help users abstracting semantics, we did four things: (1) We provided online training to the users. (2) We did not display the names of the shapes. (3) We rotated the shapes upside down. (4) We added some artificial shapes. The task description also emphasized the necessity of providing good shape decompositions in order to receive points on the task for the scavenger hunt.
Statistics: During four days, we collected more than 40,000 annotations from 2861 teams participating to the hunt. Every shape has been annotated at least 24 times.
3.3. Results and data format
The dataset is available through a web interface. Each of the 70 categories defines a different webpage showing all shapes in the category as images, partitioned according to a majority vote after filtering, with annotations for each shape associated to a Delaunay triangulation. For each shape, the results of all segmentations are shown. We provide also a csv file containing all annotations in the form:
#annotation; user_name; shape_name; f0;1;2;3g%
where the sequence of digits gives the color of the Delaunay tri-angles ordered according to the shape file. The Gold Standard shapes have been annotated by all 41,953 users. These annotations are too numerous to display, however a separate csv file is pro-vided for each of them.
4. Data analysis
4.1. Distance between annotations
Once the annotations are collected, we wish to combine and analyze them. To measure the similarity of two annotations, we propose a simple, intuitive distance measuring whether there is a color difference between annotations of a triangle, and weighting the contribution by the area of each triangle.
Let s be a shape of area As, partitioned in N Delaunay triangles
ti, i A 1…N. Each triangle tihas an area of Ai. We associate each classification to an integer value (no user included more than four classes): 0 Main Shape 1 Parts 2 Details 3 Parts Level2 8 > > > < > > > : ð1Þ
We define the annotation of a user f as the following function: f : s-f0;1;2;3g
ti↦f ðtiÞ:
Let f1ðsÞ and f2ðsÞ be two annotations of shape s, we define the
distance d1between these two annotations as:
dð f1ðsÞ;f2ðsÞÞ ¼ 1 ) Xn i ¼ 1
δ
ð f1ðtiÞ;f2ðtiÞÞ Ai AS; ð2Þ whereδ
ða;bÞ ¼ 1 if a ¼ b 0 if a ab (The distance varies between 0 and 1, and by construction is 0 only if the annotations are identical, and is 1 if all triangles are of
Fig. 5. Screenshot of our web-based shapes annotation interface, used during the scavenger hunt. The crown shape is displayed. Similar to a digital coloring system, the users drag the mouse across the shape region to color it with the selected color. The “þ” icon on the far right allows users to add additional part levels (though very few did). (For interpretation of the references to color in this figure caption, the reader is referred to the web version of this paper. In print version, black appears black, magenta appears as light gray, green appears as dark gray.)
different colors. For example, the distance between the annota-tions of the butterflies ofFig. 2is almost 1 (1 minus the area of the antennas relative to the total area).
4.2. Filtering using Gold Standard shapes
In any crowdsourcing experiment, there are typically three sources of errors[27](seeFig. 7for illustration):
(a) occasional mistakes that can be due to lack of attention or user exhaustion;
(b) errors resulting from a poor understanding of the task, or from difficulties mastering the interface;
(c) voluntary errors that come from users (spammers) who try to cheat the system to get the reward as quickly as possible. When crowdsourcing a task, filtering users who do not understand the task (type b) or spam the system (type c) is required. A widely used approach is to introduce Gold Standard data, i.e. data for which we already have an expert annotation (e.g.
[27]). All users have to annotate the Gold Standard (GS) shapes. These annotations are then used to measure a user's quality by comparing her annotations to the expert annotations. We call the set of experts E. The authors and their colleagues provided 7 expert annotations for the four GS shapes. SeeFig. 8for the GS shapes and some of their expert annotations.
For each user, and for each GS shape, we compute the distance to each expert annotation of the same shape. We keep the mini-mum value of these distances to experts: since there are multiple possible interpretations of a single shape, this step allows us to detect which expert has the closest interpretation of the shape to the user. Next, we average the minimum expert distances for all four GS shapes. Finally, a quality score Q ðuÞ for user u is defined as 1 minus this average distance:
Q uð Þ ¼ 1 ) 1 jGSj X s A GSmine A Ed fuð Þ;s feð Þs ' ( ð3Þ Fig. 9shows the annotations of users who obtain the best and worst scores with respect to GS shapes. Typically, around 20% of the annotations for each shape are filtered out.
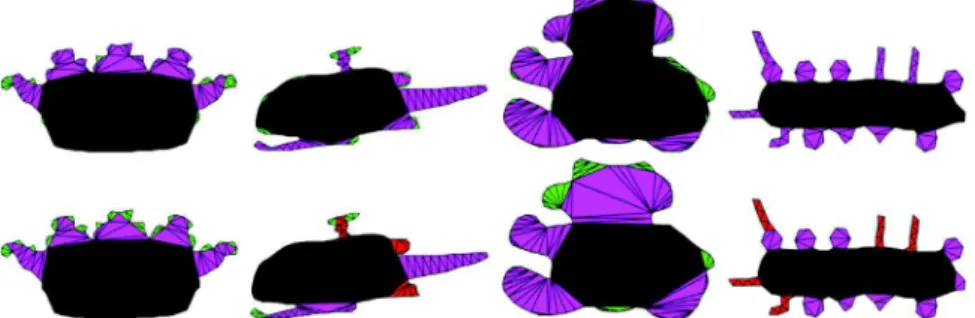
Fig. 6. Two shapes with user annotations. Left: device7-17 shape. Right: elephant-1 shape. This is the complete raw data collected for these two shapes. No post-processing, such as cleaning, filtering or transformation, has been applied.
Fig. 7. Left: Two user annotations on a deer shape that include small “random” mistakes of type (a). Right: unsatisfying user annotations on a bell and a cellphone that could be due to either a poor understanding of the task, type (b), or a spammer, type (c).
Fig. 8. Annotations from two (of our 7) experts of the 4 Gold Standard shapes (crown-10, chopper-12, teddy-12 and an additional image added with no semantic infor-mation). Note again human variability in annotation, even among the experts.
4.3. Majority vote
To obtain a single representative annotation for each class, we apply a simple majority vote to eliminate occasional mistakes (type a). Majority vote consists in choosing the label for a triangle to be the color appearing the most in the collected annotations after filtering. See, for example,Fig. 11-left.
This method works well for shapes which exhibit a consensus for a valid hierarchy. However, for shapes with multiple contra-dictory annotations, like the butterfly inFig. 2(see also the entire dataset), a majority vote may give results far from any annotations. In such a case the majority is neither representative nor robust, see Fig. 11-left. There has been work focusing on how to determine one resulting annotation out of multiple potentially noisy users annotations. Dawid and Skene [28], in their pioneering work, address this issue using a version of the Expectation–Maximiza-tion algorithm that simultaneously evaluates the annotators and builds the most likely single representative annotation from all users.
For our purposes, however, obtaining a single representative annotation, via majority vote or Expectation–Maximization, is often not sufficient. Indeed, the user study reveals the existence of several valid, meaningful annotations, as seenFigs. 2and11-left. We therefore propose in the next section to use a method able to determine multi-modal behavior of the data, thereby identifying all perceptually meaningful annotations.
4.4. Identifying shapes with multiple structures
Unlike previous work, and other comparisons of decomposition to human input[13,22,3], we provide further analysis on the user segmentations to take into account that a shape may have more than one good structural interpretation such as those shown in Fig. 2for the butterfly.
Given the different annotations of a shape s, we construct the affinity matrix A ¼ ½akl-k;l ¼ 1…ni of the set of ni annotations
ffigi ¼ 1…ni. Using the distance proposed in Eq.(3), we set:
akl¼ dð fkðsÞ;flðsÞÞ:
The affinity matrix provides the input for a spectral clustering algorithm[29]. By reordering annotations and applying k-means clustering on the data, the matrix can be given a relative block structure corresponding to different clusters. The number of clusters k is determined by minimizing the ratio between the intra-cluster and the inter-cluster distance based on the criterion proposed by Calinski et al. [30]. We then discard clusters with fewer than three annotations.
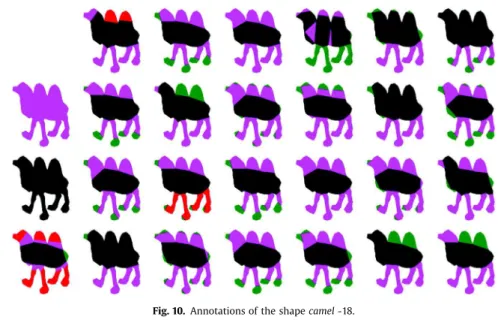
Table 1shows that for most shapes (70%) the annotations are best clustered into two separate valid clusters. As an example, the annotations ofFig. 10are found to have two representative clusters (Fig. 11-right), that highlight different, meaningful ways to parti-tion the shape and to define a structure. The majority vote is also coherent but less informative (Fig. 11-left).
5. Contributions and discussion
We have defined a geometric shape structure as a shape representation that includes a parts decomposition, parts hier-archy, and relationship between parts. Such a structure allows for an integrated approach to shape comparison, articulation, ani-mation, and creation. We have demonstrated the absence of geo-metric shape structure analysis in the literature. As a first step toward filling that gap, we contribute a ground truth shape structure database generated by a massive user study to collect shape annotations on the MPEG-7 database. These annotations include a parts decomposition, a parts hierarchy, and a retrievable relationship between parts.
Fig. 9. Each row shows annotations for a single user: the top two rows correspond to the two users with the best quality scores, the bottom rows to the two users with the worst scores. They appear clearly as a spammer (third row) and as someone that did not understand the task (last row).
Table 1
The percentage of shapes modeled well with the given number of modes: a large majority of shape have two different, meaningful representative annotations given by the two modes. Only Gold Standard shapes that have more than 2000 annota-tions generated four or more modes.
Percentage of shapes and their # of modes
1 (unimodal) 2 modes 3 modes 4 modes 5–8 modes
Most existing methods, particularly for segmentation, try to mimic human behavior, but then compare to each other instead of human-generated data.Figs. 4and6clearly demonstrate the need for user data in evaluation, immediately offering two insights into shape structure. First, many shapes admit more than one valid underlying structure. The users who segmented the shape elephant-1 inFig. 6 can be divided into two classes: those who think the head is part of the main shape, and those who do not. Automatic algorithms would benefit from taking this into account. Second, we observe that the cuts chosen by the users do not always define convex regions. The segmented elephants ofFig. 6 once again provide a good illustration, showing that convexity is not a universal principle for part decomposition.
The dataset also allows for a range of potential applications. As thousands of users interpreted and decomposed shapes, the dataset could be used to train machine learning algorithms for shape segmentation and hierarchy, as well as to evaluate shape structure algorithms. We further believe the results of the user study offer some tantalizing questions about human shape understanding, and we are eager to see what the research com-munity can extract from our data.
Acknowledgments
The authors gratefully acknowledge the support of Marie-Paule Cani and advanced grant no. 291184 EXPRESSIVE from the ERC (ERC-2011- ADG_20110209), support from NSF award IIS-0954256, and from CIMI, program ANR-11-LABX-0040-CIMI. We also thank
the 2015 Gish superfans for beta-testing and the Gishers them-selves for sharing their shape perception abilities.
References
[1] Mitra NJ, Wand M, Zhang H, Cohen-Or D, Kim V, Huang Q-X. Structure-aware shape processing. In: ACM SIGGRAPH courses; 2014.
[2]Wang C, Lai Z. Shape decomposition and classification by searching optimal part pruning sequence. Pattern Recognit 2016;54:206–17.
[3]Siddiqi K, Kimia BB. Parts of visual form: computational aspects. IEEE Trans Pattern Anal Mach Intell 1995;17(3):239–51.
[4]Singh M, Seyranian GD, Hoffman DD. Parsing silhouettes: the short-cut rule. Percept Psychophys 1999;61(4):636–60.
[5] Liu G, Xi Z, Lien J-M. Dual-space decomposition of 2D complex shapes. In: IEEE conference on computer vision and pattern recognition; 2014. p. 4154–61. [6]De Winter J, Wagemans J. Segmentation of object outlines into parts: a
large-scale integrative study. Cognition 2006;99(3):275–325.
[7]Firestone BSC. “please tap the shape, anywhere you like”: shape skeletons in human vision revealed by an exceedingly simple measure. Psychol Sci 2014;25:377–86.
[8] Giesen J, Miklos B, Pauly M, Wormser C. The scale axis transform. In: Pro-ceedings of the 25th symposium on computational geometry, SCG '09. Aarhus, Denmark: ACM; 2009. p. 106–15.
[9]Lien J-M, Amato NM. Approximate convex decomposition of polygons. Comput Geom 2006;35(1–2):100–23.
[10] Liu H, Liu W, Latecki LJ. Convex shape decomposition. In: IEEE conference on computer vision and pattern recognition (CVPR); 2010.
[11]Walker LL, Malik J. Can convexity explain how humans segment objects into parts? J Vis 2003;3(9) 503–503.
[12] Ren Z, Yuan J, Li C, Liu W. Minimum near-convex decomposition for robust shape representation. In: IEEE international conference on computer vision (ICCV). Barcelona, Spain: IEEE; 2011. p. 303–10.
[13] Jiang T, Dong Z, Ma C, Wang Y. Toward perception-based shape decomposition. In: Computer vision, ACCV. Springer; 2012. p. 188–201.
[14]Luo L, Shen C, Liu X, Zhang C. A computational model of the short-cut rule for 2D shape decomposition. IEEE Trans Image Process 2015;24(1):273–83. [15] Mi X, DeCarlo D. Separating parts from 2D shapes using relatability. In: IEEE
international conference on computer vision; 2007. p. 1–8.
[16] Macrini D, Siddiqi K, Dickinson S. From skeletons to bone graphs: medial abstraction for object recognition. In: IEEE conference on computer vision and pattern recognition; 2008. p. 1–8.
[17]Lu Y, Lien J-M, Ghosh M, Amato N.α-decomposition of polygons. Comput Graph 2012;36(5):466–76.
[18]Kimia BB, Tannenbaum AR, Zucker SW. Shapes, shocks, and deformations i: the components of two-dimensional shape and the reaction–diffusion space. Int J Comput Vis 1994;15:189–224.
[19] Latecki LJ, Lakamper R, Eckhardt T. Shape descriptors for non-rigid shapes with a single closed contour. In: IEEE conference on computer vision and pattern recognition'00; 2000. p. 424–9.
[20]Snodgrass JG, Vanderwart M. A standardized set of 260 pictures: norms for name agreement, image agreement, familiarity, and visual complexity. J Exp Psychol: Hum Learn Mem 1980;6(2):174–215.
[21] Quack T, Ferrari V, Leibe B, Gool LJV. Efficient mining of frequent and dis-tinctive feature configurations. In: IEEE international conference on computer vision, ICCV; 2007. p. 1–8.
Fig. 10. Annotations of the shape camel -18.
Fig. 11. “Mean” annotations for the camel-18 annotations shown inFig. 10. Left: the result of majority vote after filtering. Right: the camel-18 has two modes corre-sponding to these two annotations.
[22]Cohen E, Singh M. Geometric determinants of shape segmentation: tests using segment identification. Vis Res 2007;47(22).
[23] Ma C, Dong Z, Jiang T, Wang Y, Gao W. A method of perceptual-based shape decomposition. In: IEEE international conference on computer vision (ICCV) 2013; 2013. p. 873–80.
[24]Chen X, Golovinskiy A, Funkhouser T. A benchmark for 3D mesh segmenta-tion. ACM Trans Graph 2009;28(3):73:1–12.
[25]Shamir A. A survey on mesh segmentation techniques. Comput Graph Forum 2008;27(6):1539–56.
[26] Amenta N, Bern M, Kamvysselis M. A new Voronoi-based surface recon-struction algorithm. In: Proceedings of the 25th annual conference on com-puter graphics and interactive techniques, SIGGRAPH '98. New York, NY, USA: ACM; 1998. p. 415–21.
[27] Oleson D, Sorokin A, Laughlin GP, Hester V, Le J, Biewald L. Programmatic gold: targeted and scalable quality assurance in crowdsourcing. Hum Comput 2011;11(11).
[28] Dawid AP, Skene AM. Maximum likelihood estimation of observer error-rates using the em algorithm. Appl Stat 1979;28(1):20–8.
[29] Ng A, Jordan M, Weiss Y. On spectral clustering: analysis and an algorithm. Adv Neural Inf Process Syst 2002;2:849–56.
[30] Caliński T, Harabasz J. A dendrite method for cluster analysis. Commun Stat – Theory Methods 1974;3(1):1–27.