O
pen
A
rchive
T
OULOUSE
A
rchive
O
uverte (
OATAO
)
OATAO is an open access repository that collects the work of Toulouse researchers and
makes it freely available over the web where possible.
This is an author-deposited version published in :
http://oatao.univ-toulouse.fr/
Eprints ID : 18886
The contribution was presented at ICPR 2016 :
http://www.icpr2016.org/site/
To link to this article URL :
http://dx.doi.org/10.1109/ICPR.2016.7900130
To cite this version :
Leonard, Kathryn and Morin, Géraldine and Hahmann,
Stefanie and Carlier, Axel A 2D Shape Structure for Decomposition and Part
Similarity. (2016) In: 23rd International Conference on Pattern Recognition
(ICPR 2016), 4 December 2016 - 8 December 2016 (Cancun, Mexico).
Any correspondence concerning this service should be sent to the repository
administrator:
[email protected]
A 2D Shape Structure
for Decomposition and Part Similarity
Kathryn Leonard
CSU Channel Islands
Geraldine Morin
Univ. of Toulouse
Stefanie Hahmann
Univ. of Grenoble Alpes
Axel Carlier
Univ. of Toulouse
Abstract—This paper presents a multilevel analysis of 2D shapes and uses it to find similarities between the different parts of a shape. Such an analysis is important for many applications such as shape comparison, editing, and compression. Our robust and stable method decomposes a shape into parts, determines a parts hierarchy, and measures similarity between parts based on a salience measure on the medial axis, the Weighted Extended Distance Function, providing a multi-resolution partition of the shape that is stable across scale and articulation. Compari-son with an extensive user study on the MPEG-7 database demonstrates that our geometric results are consistent with user perception.
I. INTRODUCTION
Performing integrated tasks with a shape such as shape generation, animation, editing, or partial matching requires
structure-awareshape processing. A full shape structure con-sists of a decomposition into parts, understanding of parts hierarchy, and the ability to measure relative part similarity. As noted in [18], hierarchy is often the most difficult to attain. This paper proposes a geometric approach to shape analysis based on the Blum medial axis that realizes a full shape structure in a way that is robust to noise and stable under changes of scale, rotation, and part articulation. Moreover, it matches well with human perception of shape structure.
An initial decomposition into parts provides the foundation of any shape structure. Characteristics of part decompositions have been considered extensively (see, for example, [13], [27]), but most follow generally the ideas first outlined in [11]: (1) two distinct parts will meet transversally, (2) parts should be divided along minima of curvature, (3) decompositions should be reliable, versatile, and computable. Our method meets these criteria for most shapes. What our method offers that most parts decompositions do not is the ability to retain geometric relationships between parts instead of returning a chain of regions whose connections have been lost.
Our method relies on functions defined on the interior Blum medial axis that capture shape importance. In [12], importance measures of parts based on existing functions on the medial axis are derived and a new function, the Weighted Extended Distance Function (WEDF), is proposed to improve the importance measure.
The WEDF value at a point on the medial axis measures the area of the shape subtended by that medial point. Our preliminary results in [12] using the WEDF on extremely simple tube-like shapes to distinguish between “parts” and “main shape” form the basis of our more comprehensive work
here to generate a full shape structure tested on the MPEG-7 database. Because the medial axis effectively encodes shape geometry, our method retains not only geometric relationships between parts but also their relative importance within a multiscale parts hierarchy.
The primary contribution of this paper is an unsupervised, robust skeleton-based shape structure that decomposes shapes into parts, provides a parts hierarchy, and measures part similarity all while maintaining geometric relationships be-tween parts. This shape structure is stable under rigid motion, noise, and articulation of parts. Our method does not require denoising, as noisy points emerge naturally in the hierarchy. Section III gives an overview of the relevant shape importance measures. Section IV describes our parts decomposition and hierarchy process. We compare performance of our decom-position and hierarchy to results from a user study of shape structure in Section V, and give a brief introduction to our parts similarity measure in Section VI.
II. RELATEDWORK
Parts decomposition. Much recent work on parts decompo-sition builds on the idea of decomposing a shape into convex regions using a greedy algorithm to minimize length of cuts between parts [13], [21]. These decompositions tend to be unstable in the presence of small boundary curve deformations, and cannot handle parts such as animal tails that have been articulated into non-convex shapes. Some methods to address those shortcomings have been explored to some success [21], but most fight against geometry (for example, artificially straightening articulated non-convex parts) and do not allow for the retention of geometric relationships between parts. Medial-axis-based parts decomposition and hierarchies. Skeletons have been viewed as unreliable because the branch structure can change significantly in the presence of noise on the boundary of the shape [1]. Much of the previous work on skeletal part hierarchies has focused on identifying noise in order to prune noisy points [15], [16], [19], [25]. In an early work, Ogniewicz [19] proposes a multiresolution repre-sentation of a 2D shape consisting of iteratively computing a real valued function on the medial axis based on the boundary length, generating a robust filters for noise. The resulting de-composition into hierarchy levels is achieved through selecting arbitrary thresholds: the user decides what is noise. Pizer et al. [20] compares the Ogniewicz approach with other multiscale
representations of a shape based on shock graphs [23] or cores. More generally, pruning algorithms typically erode points at the ends of important medial branches, thereby smoothing out sharp and meaningful shape features.
Recent work looks more explicitly at parts decompositions and hierarchies, but relies on the boundary curve geometry for key part detection cues. In [16], the authors use the medial axis to extract an abstraction of shapes, a simplified model to clarify the structure of a shape. Using user-specified thresholds, they move from smallest to largest branches in the medial axis, extracting the part associated to the current branch and replacing it with a smooth connection along the boundary. Doing so preserves part structure and level of hierarchy. Parts below the threshold are discarded, and what remains is the abstraction. The work in [30] approaches shape decomposition by introducing a measure of protrusion strength that looks at the ratio between the radius of the medial circle and the length along the boundary of the resulting part to determine if a potential part cut is desired. The parts decomposition occurs only after significant denoising of the skeletal structure.
Shape similarity There has been substantial work to iden-tify similarities between 2D shapes for applications such as shape retrieval. Structural approaches have used skeletons [2], [28], shock graph [26], or shape context [3] to that end. These approaches match both the topology and the geometry of the two shapes to be compared. These approaches are global, however, and therefore time consuming, and they only match between two shapes. It is still an open problem how to apply these methods for selecting several sets of similar shape parts from within one shape. In 3D, recent work has begun to address the identification of local part similarities within a single shape (see [17] for a survey), but most of these methods rely on a local analysis of the surface. Curve skeletons have been proposed for shape matching, but again for a global matching and not for intra-shape similarity detection. Without a reliable method for intra-shape similarity detection in 3D, manual user-interaction is still required [10].
III. FUNCTIONS ON THEBLUM MEDIAL AXIS
Following notation in [9], we define the (interior) Blum medial axis. See Figure 1.
Definition 1: The (interior) Blum medial axis pair (m, r) of a simple, closed plane curve γ is the locus of centers m of maximally inscribed circles of γ together with their radii r.
For many reasons, the medial axis is a desirable shape representation. It encodes the geometry of the shape boundary in its own geometry [9] and is more efficient in shape compression [14]. Each branch m ∈ m corresponds to a coherent part within the shape, and the branch connections provide information about adjacency of these parts. Well-studied discrete formulations, the Delaunay triangulation and Voronoi diagram, give an approximation to the medial axis for a discretized boundary curve that converges to the true medial axis as the density of the boundary sampling increases [8]. When two medial axes are close, the resulting boundary curves must also be close [14].
Fig. 1. A 2D shape (grey) and its internal medial axis (green and blue curves). An arbitrary point x (in red) on the internal medial axis is associated to its EDF(x) and W EDF (x) values. Left: EDF (x) measures the distance on the medial axis to the closest extremity of the longest path (in blue) through x. Right: W EDF(x) follows the same principle, but considers the area corresponding to a medial axis segment rather than its length. Here the blue medial axis segment corresponds to the path on the medial axis through the point x with the larger area, while the dark blue part’s area is W EDF(x).
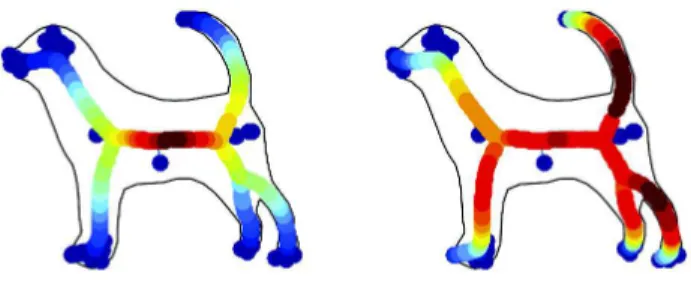
Fig. 2. L: The EDF for a stingray shape with EDF values indicated with a heat map. Note that there is one long curve (axis) through the shape with continuous EDF variation while all other branches show a jump in EDF from the value on the connecting point. R: The WEDF for the same shape. Note how the maximum WEDF value (red dot) is in the center of the shape whereas the maximum EDF value is toward the tail.
Unfortunately, any noise on the boundary will produce a new branch of the medial axis. Changes in boundary sampling may change the branching structure, which makes any naive parts decomposition based on branches unstable.
Originally proposed in [15] as a significance measure, the Extended Distance Function (EDF) introduces a measure of shape depth on the medial axis.
Given a medial point x contained in a continuous path f in the medial axis, rf(x) is the shortest distance to a boundary point through the axis via f . The EDF for x is the largest such rf(x) among all paths f ⊂ m containing x. See Figure 1 where the f giving the largest rf(x) is indicated in blue and the EDF value rf(x) is the shortest distance to the boundary along that f .
Definition 2: A trunk T ⊂ m is a path in m with the property that, for each branch point b∈ T , limx→b= EDF (b) for x∈ T .
In other words, a trunk is a path in the medial axis with continuous EDF values. The EDF measures how deep into a shape a point is, which gives us important information about the shape. Unfortunately, adding long thin protuberances can change the EDF values significantly. See Figure 2, L, where the tail of the stingray has shifted the maximum EDF values
Fig. 3. A shape with ET (L) and ST (R) values shown as a heat map. Note how the ST maxima are in the tube-like legs, whereas the ET maximum occurs in the much more blob-like torso region.
away from the core of the shape. To obtain a more stable shape depth measure, we turn to the Weighted Extended Distance Function (WEDF) [12].
Viewing EDF(x) as the length of the most significant shape part subtended by x, we view the Weighted Extended Distance Function (WEDF) as the area of the most significant shape part subtended by x. See Figure 1.
For discrete shape boundaries, areas can be computed by simply summing the areas of the Delaunay triangles along the desired path f . Because the WEDF is area-based, its values are robust to the addition of long but insignificant protuberances. See Figure 2 where the maximum WEDF values are in the core of the stingray despite the long tail.
EDF and WEDF give information about part importance. Two quantities based on the EDF provide measures of “blob-biness” and “tube-iness” of a shape part. These will help us define part similarity. See Figure 3.
Erosion thickness, first introduced in [24], measures the difference at a point x between the distance to the boundary along the medial axis and the Blum radius r(x):
ET(x) = EDF (x) − r(x). (1) .
Shape tubularity, introduced in [15], measures the ratio of the ET to the EDF:
ST(x) = EDF(x) − r(x) EDF(x) = 1 −
r(x)
EDF(x). (2) See Figure 3. Note that ET is monotonic from the inside to the outside of the shape, but ST is not.
The ET and ST are extremely useful when used together:
Theorem 1: Let T1(v) and T2(v) be two medial trunks parametrized over the same domain, with associated ra-dius functions r1 and r2, and ET, ST and EDF values ET1, ST1, EDF1 and ET2, ST2, EDF2. If ET1 ≡ ET2 and ST1 ≡ ST2, then r1 ≡ r2, EDF1 ≡ EDF2 and, if parametrizations are constant speed, the curves must also have the same length.
To see this, note that ET1 ≡ ET2 implies that EDF1 = EDF2+ (r1− r2). Inserting that identity into the equality for the ST, we find either r1= r2 or r2 = EDF2. Since the
radius function equals the EDF only at endpoints of branches (for y ∈ ∂T ), we conclude that r1 = r2. We immediately obtain EDF1 = EDF2 and, remembering that EDF(v) = l− v + r(l) for v an arclength parameter on [0, l], we find that l1= l2when v is an arclength parameter. The result holds true in approximation as well: when the ET and ST values of two trunks are close, values of the two EDF and radius functions must also be close.
Theorem 1 has strong implications: when two trunks have equal values for both ET and ST functions, the associated shape parts must be equal up to curvature of the trunk—in other words, up to articulation.
IV. SHAPE DECOMPOSITION AND HIERARCHY
In the next sections, we present procedures based on the medial axis for unsupervised parts decomposition, hierarchy, and similarity. We developed and refined our methods on 23 shapes randomly selection from the Kimia 1001 database [22]. Our test set is the MPEG-7 database [4] interpreted to consist of simply connected regions, together with some artificial shapes designed without semantic information. We also present results from a user study that we use to assess performance of our parts decomposition and hierarchy.
A. Computation of the hierarchy
We compute hierarchies for each shape using intrinsic properties of the medial axis and functions defined thereupon. Within the medial axis, a new branch begins at every shape protrusion. Discontinuities in WEDF values occur only at branch junctions, and the character of the discontinuities gives insight into the salience of the associated shape part.
For a discrete shape boundary, we compute its Delaunay tri-angulation, taking centers of the circumcircles of the triangles to approximate m. We discard any medial points outside the boundary. The distances from the interior circle centers to the triangle vertices approximate r, producing a discrete medial axis ( ˆm, ˆr). Each x ∈ ˆm is associated to a triangle. Taking the sum of the areas of triangles along the WEDF-defining axis f gives an approximation for the WEDF value at x.
Next, we determine the core of the shape using WEDF values on its medial points. If a shape’s medial axis has enough branches, we determine shape core points using the subset of the medial axis points consisting of branch points where three or more branches meet, and neighbors of branch points. Otherwise, we use all internal medial points. Denote this initial clustering set by ICS. We find the core of the shape by performing a seeded k-means clustering with two clusters on the WEDF values for the ICS. Seeds are chosen as the minimum and maximum WEDF values of the medial points being clustered. Once clusters have been determined on the ICS, any remaining medial points are assigned to the cluster with centroid closest to the associated WEDF value. Points closest to the centroid with largest WEDF value are selected as the core and assigned to the coarsest level.
Once we have the shape core, we determine the additional levels in the shape hierarchy through a two-step process. The
Fig. 4. (L) A bird shape after k-means clustering on WEDF values at branch points. The black region is the core from the 2-cluster clustering. The remaining levels are assigned during a second clustering where number of clusters is automatically determined. (C) The bird shape after assigning the hierarchy levels. (R) The previous hierarchy viewed as a three-level hierarchy, where “core” and “details” are inherited from the previous hierarchy (details being the finest level) and all other levels are assigned to “part”.
first step mimics the process for determining the core, but with an automatically determined number of clusters. We begin by operating on non-core ICS points, performing gap analysis on the associated WEDF values to determine the intrinsic number of clusters, K ∈ {2, 3, . . . , 12}. Because gap analysis can be sensitive to initial conditions, we repeat the process several times and select K to be the mode of the result. We then perform a seeded k-means clustering on the WEDF values with K clusters. Seeds are chosen as the minimum, maximum, and 100K th percentiles of the WEDF values of the ICS points being clustered. Once clusters have been determined, any remaining non-core medial points are assigned to the cluster with centroid closest to the associated WEDF value. See Figure 4, left.
In the second step, we use information about the branching structure of the medial axis to refine the clusters and determine their hierarchy levels. At the end of the first step, each medial point belongs either to the core or to one of the K clusters. Points in the core cluster are assigned as level 1. Now suppose we have matched points to levels up to level k. To determine which cluster should define level k+1, we consider all branch points contained in levels 1 to k and find the branch point neighbor with the largest WEDF value vk+1 where vk+1 < vk (we may take v1 = ∞). We assign all points x ∈ m with W EDF(x) ≤ vk+1 to cluster k+ 1. Repeating until all branch points have been considered gives the complete shape hierarchy. See Figure 4, center.
Considering as a part each connected component of the shape at each hierarchy level, we obtain a decomposition of the shape into parts that are already assigned a hierarchy. This fully automated process, based on intrinsic properties of the medial axis and functions defined on it, gives two of the three components of a shape structure analysis.
B. Results
Our results for automated shape hierarchy for some MPEG-7 shapes are presented in Figure 5. When the boundary curve is sampled densely enough to capture all salient shape features, the hierarchy is quite stable across sampling rates. Addition of noise that is of lower amplitude than the finest shape details will not affect existing hierarchies but may introduce a finer hierarchy level to capture the noise or may allow for hierarchy
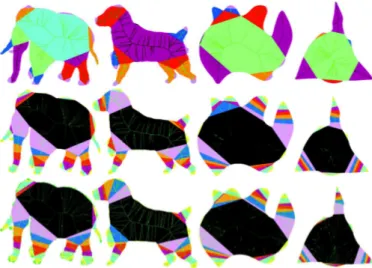
Fig. 5. Top row: Intrinsic hierarchy levels for each shape part for a few of the MPEG-7 shapes, two animals and two abstract shapes. Triangles with the same color have been assigned to the same hierarchy level. These levels do not take into account the levels of the other parts within the shape. Center row: Full hierarchy levels for the same shapes. Triangles with the same color have been assigned to the same hierarchy level. Core triangles are in black. These levels take into account the intrinsic levels of other parts within the shape, so that sub-parts at the same level can be compared across all parts. Bottom row: Full hierarchies for the same shapes with added white noise on the boundary. Note that despite a medial axis with many additional branches, the proposed hierarchy remains stable.
Fig. 6. Hierarchies for similar shapes (dancers) in different poses to show that the proposed hierarchy is stable under articulation. Coarser levels of the hierarchy are consistent even if finer levels are added in the presence of finer details. Also, note that the hierarchy is retained even with occlusion: The pink level of the left arm of the first dancer is occluded, but the blue level begins as it should.
breaks to occur at slightly different locations. See Figure 5, bottom row.
V. USERSTUDY
Because a parts hierarchy for a shape is only useful insofar as humans agree with it, we require a baseline understanding of human perception in order to evaluate our work. We launched a user study as part of GISHWHES 2015, a one-week, international online scavenger hunt with thousands of participants. For each shape, users were asked to label each triangle of a shape’s Delaunay triangulation as belonging to main shape, part, or detail by coloring it black, magenta, or green using a web-based interface. Users could choose to add additional levels to the parts hierarchy, but very few did. By the end of the week, 2,861 users had annotated 41,953 shapes and every shape had been annotated at least 24 times [6].
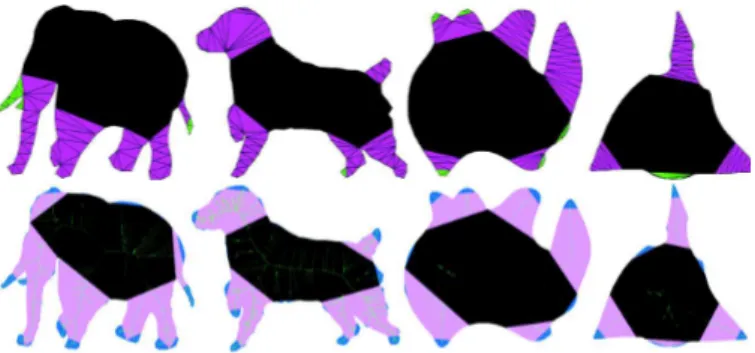
Fig. 7. Annotations of the four MPEG7 shapes by the users (top) and by our algorithm with the number of clusters set to 3 (bottom).
A. Methods
In the user study, participants categorized each Delaunay triangle in a shape as belonging to one of three hierarchy levels. Triangles in those few shapes where users added an additional parts level were relabeled as the second level. Our shape hierarchy gives as many as twelve levels for hundreds of medial points per shape. To obtain a three-level hierarchy from our automated algorithm, we perform the process described in Section IV, then designate the finest hierarchy level as details and all levels between the main shape and details as parts. See Figure 4, right.
We define the similarity D between the two annotations, a1(S) and a2(S), of a shape S with Delaunay triangulation {t1, . . . , tn} as: D(a1(S), a2(S)) = n X i=1 δ(a1(ti), a2(ti))Ai AS (3) where δ(a, b) = 1 if a = b, 0 if a 6= b.
We use a simple majority vote to obtain a representative user annotation for each shape. Figure 7 compares our algorithm to the user study on two animals and two abstract shapes.
B. Results
We use the similarity measure defined in equation 3 to compare the shape hierarchy of our algorithm against the shape hierarchy of the users. We find an average similarity of 0.764 with a median value of 0.800 and a standard deviation of 0.147. Our hierarchy and the user-annotated hierarchy therefore agree on more than 75% of shape area.
We obtain a similarity score superior to 0.8 on 38 classes out of 69, and between 0.6 and 0.8 on 26 classes. The five lowest scoring classes include four devices classes and butterflies and have a similarity score between 0.4 and 0.6. In those categories, the geometry makes it difficult to determine what is main shape and what are parts and details, since large parts (wings) are attached to a small central part (body). In fact, users themselves do not agree.
VI. PART SIMILARITY
Given a shape hierarchy, we can compare similarity of parts within and across hierarchy levels. For the shapes in
our database, the medial structure corresponding to a part at a given level will be an embedded tree. Efficient matching of embedded trees is costly [5], [7], [29]. To improve efficiency, we use the trunk introduced in Definition 2, which gives us the most significant path through the tree, allows us to apply Theorem 1, and provides a road map for attached parts at finer hierarchy levels.
Given a shape part at hierarchy level k∈ {1, . . . , K} where K is the finest level in the parent shape, we generate the trunk traversing the part from level k to the finest level in the part. Resampling the trunk to obtain equidistant sample points, we interpolate corresponding ET and ST values. Based on Theorem 1, closeness of these values indicates a strong similarity of shape.
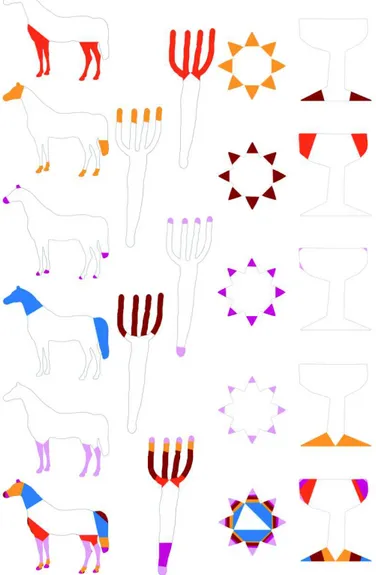
We complete our shape structure analysis by establishing part similarity. Each shape contains multiple trunks. Taking ET and ST values into a single feature vector for each trunk, we perform k-means clustering on the resulting collection of feature vectors. The mode of several gap analyses again determines the number of clusters. This automated process determines trunk similarity within the shape across trunks of all levels, which we may then join together to determine a total similarity measure for a given hierarchy level. Some clusters of parts are shown in Figure 8.
Because a trunk at a coarser level often contains trunks at finer levels, we may use the trunk similarity clustering to determine a measure of similarity persistence between two trunks. Each point in a trunk has a natural level, the finest level at which it appears. With our part clustering process, points that appear in multiple trunks may be assigned to multiple clusters based on their membership in multiple trunks. We now assign a unique cluster label to each point by selecting the cluster label given to the trunk at that point’s natural level. For example, the points in the fork tines in Figure 8 would be assigned their natural level values as indicated displayed in fork in the bottom row, even though the tips of the tines have been assigned to four distinct level values corresponding to the four trunks shown above.
Computing the proportion of shape part area assigned to a given cluster label for each trunk gives a similarity persistence value between two trunks:
P S(T1, T2) = d(v1, v2), (4) for vj = (vj1, . . . , vjm) where vjk gives the proportion of shape part area for trunk Tj with cluster label k.
VII. DISCUSSION
We have presented a robust and stable method for shape structure analysis using the Blum medial axis that circumvents the usual issues with skeletal shape representations. Our parts decomposition agrees remarkably well with human perception and is interwoven with a hierarchy that captures the range of scales of parts within a shape. Our parts similarity measure re-liably and accurately identifies similar parts within and across levels of the shape hierarchy, and is stable under articulation
Fig. 8. Bottom: Four shapes of the MPEG-7 datashape with all levels dis-played simultaneously. Above: Parts in the same similarity clusters highlighted with the same color.
and rigid motion. Our methods should apply equally well to between-shape part matching.
Interestingly, the interaction between the core of the shape and the next level (pink) shows that for some shapes the pink level indicates a connector between shape core blobs and narrow parts, while for other shapes it is the first level within a clearly distinct part. Further study is required in order to determine automatically when each case holds.
These methods have important implications for graphics applications once they are extended to 3D. Current work is underway to determine a 3D version of the EDF and WEDF, and to find 3D analogies for ET and ST.
Acknowledgments The authors gratefully acknowledge the support of Marie-Paule Cani and ERC Advanced Grant 291184 EXPRESSIVE, NSF award IIS-0954256, and CIMI, program ANR-11-LABX-0040-CIMI.
REFERENCES
[1] D. Attali, J.-D. Boissonnat, and H. Edelsbrunner. Stability and compu-tation of medial axes-a state-of-the-art report. Math. foundations of vis.,
CG, and data expl., 6, 2009.
[2] X. Bai and L. J. Latecki. Path similarity skeleton graph matching. IEEE
PAMI, 30(7), 2008.
[3] S. Belongie, J. Malik, and J. Puzicha. Shape matching and object recognition using shape contexts. IEEE PAMI, 24(4), 2002.
[4] M. Bober. Mpeg-7 visual shape descriptors. IEEE Trans. Cir. and Sys.
for Video Technol., 11(6), June 2001.
[5] H. Bunke. On a relation between graph edit distance and maximum common subgraph. Pattern Recogn. Lett., 18(9), Aug.
[6] A. Carlier, K. Leonard, S. Hahmann, G. Morin, and M. Collins. The 2d shape structure dataset: A user annotated open access database.
Computers & Graphics, 58:23–30, 2016.
[7] E. D. Demaine, S. Mozes, B. Rossman, and O. Weimann. An optimal decomposition algorithm for tree edit distance. ACM Trans. Algorithms, 6(1), Dec. 2009.
[8] T. K. Dey and W. Zhao. Approximating the medial axis from the voronoi diagram with a convergence guarantee. Algorithmica, 38(1), Oct. 2003. [9] P. J. Giblin and B. B. Kimia. On the local form and transitions of
symmetry sets, medial axes, and shocks. IJCV, 54(1-3), 2003. [10] E. Guy, J.-M. Thiery, and T. Boubekeur. Simselect: Similarity-based
selection for 3d surfaces. In Computer Graphics Forum, volume 33. Wiley Online Library, 2014.
[11] D. D. Hoffman and W. A. Richards. Parts of recognition. Cognition, 18(1), 1984.
[12] L. J. Larsson, G. Morin, A. Begault, R. Chaine, J. Abiva, E. Hubert, M. Hurdal, M. Li, B. Paniagua, et al. Identifying perceptually salient features on 2d shapes. In Research in Shape Modeling. Springer, 2015. [13] L. Latecki, R. Lakamper, and T. Eckhardt. Shape descriptors for non-rigid shapes with a single closed contour. In CVPR 2000. Proceedings, volume 1, 2000.
[14] K. Leonard. Efficient shape modeling: epsilon-entropy, adaptive coding, and boundary curves -vs- blum’s medial axis. IJCV, 74(2), 2007. [15] L. Liu, E. W. Chambers, D. Letscher, and T. Ju. Extended grassfire
transform on medial axes of 2d shapes. Computer-Aided Design, 43(11), 2011.
[16] D. Macrini, S. Dickinson, D. Fleet, and K. Siddiqi. Bone graphs: Medial shape parsing and abstraction. Computer Vision and Image Understanding, 115(7), 2011.
[17] N. J. Mitra, M. Pauly, M. Wand, and D. Ceylan. Symmetry in 3d geometry: Extraction and applications. In Computer Graphics Forum, volume 32. Wiley Online Library, 2013.
[18] N. J. Mitra, M. Wand, H. Zhang, D. Cohen-Or, V. Kim, and Q.-X. Huang. Structure-aware shape processing. In ACM SIGGRAPH 2014
Courses, page 13. ACM, 2014.
[19] R. L. Ogniewicz. Skeleton-space: a multiscale shape description combin-ing region and boundary information. In CVPR’94 Proceedcombin-ings, 1994. [20] S. M. Pizer, K. Siddiqi, G. Sz´ekely, J. N. Damon, and S. W. Zucker.
Multiscale medial loci and their properties. IJCV, 55(2-3), 2003. [21] Z. Ren, J. Yuan, and W. Liu. Minimum near-convex shape
decompo-sition. IEEE Trans. on on Pattern Analysis and Machine Intelligence, 35:2546–2552, 2013.
[22] T. B. Sebastian, P. N. Klein, and B. B. Kimia. Shock-based indexing into large shape databases. Lecture Notes in Computer Science, 2352, 2002.
[23] T. B. Sebastian, P. N. Klein, and B. B. Kimia. Recognition of shapes by editing their shock graphs. IEEE Trans. PAMI, 26(5), May 2004. [24] D. Shaked and A. M. Bruckstein. Pruning medial axes. Comput. Vis.
Image Underst., 69(2), 1998.
[25] W. Shen, X. Bai, X. Yang, and L. J. Latecki. Skeleton pruning as trade-off between skeleton simplicity and reconstruction error. SCIENCE
CHINA Information Sciences, 56(4):48101, 2013.
[26] K. Siddiqi, A. Shokoufandeh, S. J. Dickinson, and S. W. Zucker. Shock graphs and shape matching. IJCV, 35(1), 1999.
[27] C. Wang and Z. Lai. Shape decomposition and classification by searching optimal part pruning sequence. Pattern Recognition, 2016. [28] Y. Xu, B. Wang, W. Liu, and X. Bai. Skeleton graph matching based
on critical points using path similarity. In ACCV 2009. Springer, 2009. [29] R. Yang, P. Kalnis, and A. K. H. Tung. Similarity evaluation on tree-structured data. In Proceedings of the 2005 ACM SIGMOD, SIGMOD ’05, New York, NY, USA, 2005. ACM.
[30] J. Zeng, R. Lakaemper, X. Yang, and X. Li. 2d shape decomposition based on combined skeleton-boundary features. In Proceedings of the
4th International Symposium on Advances in Visual Computing, Part II, ISVC ’08, pages 682–691, Berlin, Heidelberg, 2008. Springer-Verlag.