an author's
https://oatao.univ-toulouse.fr/26735
https://doi.org/10.1016/j.jcomc.2020.100008
Saadati, Yousef and Lebrun, Gilbert and Bouvet, Christophe and Chatelain, Jean-François and Beauchamp, Yves
Study of translaminar fracture toughness of unidirectional flax/epoxy composite. (2020) Composites Part C: Open
access, 1. ISSN 2666-6820
Study
of
translaminar
fracture
toughness
of
unidirectional
flax/epoxy
composite
Yousef
Saadati
a, ∗,
Gilbert
Lebrun
b,
Christophe
Bouvet
c,
Jean-François
Chatelain
a, ∗,
Yves
Beauchamp
da Mechanical Engineering Department, École de Technologie Supérieure, 1100 Notre-Dame West, Montreal, QC H3C 1K3, Canada
b Mechanical Engineering Department, Université du Québec à Trois-Rivières (UQTR), 3351 boul. des Forges, Trois-Rivières, QC G9A 5H7, Canada c University of Toulouse; INSA, UPS, Mines Albi, ISAE-SUPAERO, ICA (Institut Clément Ader), 3, rue Caroline Aigle, 31400 Toulouse, France d McGill University, 845 Sherbrooke Street West, Montreal, QC H3A 0G4, Canada
Keywords:
Flax fiber
Translaminar fracture energy Fracture toughness Flax-epoxy composites
Tensile and compressive translaminar fracture Infrared thermography
a
b
s
t
r
a
c
t
Ever growing applications of flax fiber-reinforced composites (FFRCs) and their suitability for structural uses involve implementing the design and failure criteria for these composites. Translaminar fracture is one of the primary failure modes of unidirectional (UD) fiber-reinforced composites, and measuring it is essential for design purposes and in many material failure studies. However, the translaminar fracture parameters have not been evaluated for UD-FFRCs; thus, there is no data available in the literature. Moreover, conventional test methods for this failure mode are complex, and there is no standard method for measuring this value in compression. In this study, the translaminar fracture behavior of a UD flax/epoxy composite has been examined, and its fracture toughness in tension and compression in the fiber direction are determined following existing standard meth- ods as well as using a methodology developed using infrared thermography. Compact tension specimens were adapted and used for this purpose. A fractographic study is conducted to examine the fracture surfaces and better understand the failure mechanisms. For tensile tests, the results of infrared thermography are in good agreement with those of ASTM E1922 and lie in the range of values obtained for similar composites in the literature.
1. Introduction
Over the last two decades, the need for materials with enhanced properties, lower cost, and improved sustainability has rendered natural (cellulosic) fiber-reinforced polymer composites (NFRPCs) an attractive alternative to their synthetic glass fiber (GFRP) counterpart in struc- tural and non-structural applications [1–4]. Among natural plant fibers (NFs), flax is considered one of the most promising for polymer compos- ites due to its unique properties [4–6]. Using continuous unidirectional (UD) and optimally configured reinforcements in NFRPCs is crucial to maximizing their load-carrying performance [7–9]. Therefore, UD flax fiber-reinforced composites (FFRPCs) are of prominent importance for the industry. In addition to strength and stiffness, fracture toughness is an essential property of fiber-reinforced polymer composites (FRPCs) for most engineering applications [10–12]. Nowadays, the engineering desire for an optimized, efficient, sustainable, cost-effective, and dam- age tolerant product design in conjunction with the ever-growing appli- cations of FFRPCs necessitate characterizing the fracture toughness of
∗Corresponding authors.
E-mailaddresses:[email protected], [email protected](Y. Saadati), [email protected](G. Lebrun), [email protected](C. Bouvet), [email protected](J.-F. Chatelain), [email protected](Y. Beauchamp).
these composites. The fracture toughness associated with translaminar failure mode (denoted by GIC, when expressed in terms of energy and by
KICwhen expressed in terms of stress intensity factor) is one of the pri-
mary mechanical properties of the fiber-reinforced composites (FRCs). This is particularly true when using the finite element method (FEM) to simulate specific material damages occurring in composite laminates, like fiber failure, matrix breaking, and delamination [13–17]. The FEM approach requires different fracture energies as input variables, and the fracture toughness in different directions and their corresponding evalu- ation methods are prerequisites for the FEM simulation of FFRPCs. While the significance of translaminar fracture toughness (TFT) measurement was recognized since the late ’70s, it has attracted little interest [18]. This is because FRCs were not used in primary structures, where this property is mostly required. At the same time, the advanced numerical simulation methods referring to this property were not yet developed
[18]. The situation is now different as FRCs are used in structures, and FEM is a commonly used numerical method. With the growing appli- cation of NFRPCs, their TFT is expected to play an essential role in the
Fig.1. The ECT configuration (a), test speci- men (b), load application configuration (c), and notch (d). (Dimensions in mm).
future. Currently, it is required in many research fields, such as the ma- chining of composite materials, where numerical models based on FEM are involving.
In the literature, measuring the translaminar fracture toughness of NFRPCs is limited to a few studies that are all conducted only in ten- sion. Hughes et al. [11]studied the TFT of some chopped NFRPCs and compared them to that of a glass fiber mat composite. The GICvalue
of GFRP was three-fold higher than those of NFRPCs. They concluded that different micro-structural toughening mechanisms were activated in the NFRPCs compared to GFRP. Silva et al. [19]reported an in ten- sion GIC= 11.8 kJ/m 2for woven sisal/polyurethane (PU) composite.
They observed that GICincreased with fiber volume fraction ( Vf) and
was impaired with the alkaline treatment of the fibers. Liu and Hughes
[12]investigated the effects of textile yarn linear density, weave con- figuration, and stacking sequence on GICof woven FFRECs. They mea- sured the KICof anisotropic woven-flax/epoxy composites following BS
7448 standard. According to their findings, the fracture behavior and
KIC are strongly dependent on the linear density of yarns and the di- rection of the test but is independent of the weave type. The authors reported KIC values in the range of 3–8.5 MPa m 1/2 for the compos-
ites and concluded that the fracture toughness is more dominated by the fiber properties and Vfrather than the reinforcement configuration.
Following ASTM D5045, Li et al. [20]studied the fiber surface treat- ment effect on fracture properties of textile-sisal/vinyl-ester composite. They obtained KIC = 4.2 MPa m 1/2 for the untreated fiber composite,
which increased to 5.5 and 6.0 MPa m 1/2, respectively, with Silane and
KMnO 4fiber treatments. Ismail et al. [21]reported values of KIC≈8.5
and KIC ≈4.5 MPa m 1/2, respectively for UD-twisted yarn and cross-
ply woven kenaf/polyester composites tested based on ASTM D5045. Chizyuka and Kanyanga [22]investigated the effects of hydrothermal aging and moisture absorption on the KIC of sisal/polyester compos- ites. They followed the ASTM E1922 procedure to evaluate the KIC of
the composites and obtained KIC≈6.25 MPa m 1/2. The fractographic
study revealed that the reduction of KICafter moisture absorption was mainly due to fiber/matrix debonding, which was the dominant frac-
ture mechanism in the composite. Manjunath et al. [23]followed ASTM E1922 and investigated the KICof jute fabric reinforced epoxy compos- ites. However, the criteria of the standard were not carefully respected, and there is a mismatch between their reported test data and the re- ported KIC values. Their result is also one order of magnitude higher than that of Ashik et al. [24], KIC = 7.71 MPa m 1/2, for an analogous
material.
1.1. Translaminarfracturetoughnessintension
The ASTM E1922 standard [25]suggests the extended compact ten- sion (ECT) specimen for measuring the tensile TFT of FRCs. ECT, Fig.1, is an extended configuration of the compact tension (CT) specimen,
Fig.2(a), which was developed to overcome undesirable failure modes such as crack growth perpendicular to the pre-notch [26, 27]. ASTM E1922 was developed and adapted to measure the fracture toughness of FRCs in tension, while a number of studies have used CT specimens, along with ASTM E399, D5045, or other methods [28–33]. Without mentioning any particular reason, several researchers tested cross-ply laminates and utilized a rule-of-mixtures type approach to measure the fracture toughness of UD-FRCs [18]. Jose et al. [17]evaluated the tensile TFT of a carbon/epoxy cross-ply laminate [0/90] 15as well as its con- stituent UD laminates, [0] 30and [90] 30. They presented an analytical
relationship between the KICof the laminate and those of its constituent
UD sub-laminates. However, some of their specimens failed improperly, and their derived equation seems to have inconsistent dimensions. Pinho et al. [28]used a similar approach to determine the GICassociated with
the tensile and compressive failure of UD carbon/epoxy laminates using a cross-ply [0/90] 8Slaminate. They used CT and CC specimens with the
dimensions and fiber direction shown respectively in Fig.2(a) and (b) and followed the ASTM E399 procedure. However, they regenerated a finite-width correction factor based on FEM to replace the one defined in ASTM E399 for isotropic materials. The authors assumed: (i) that the mode-I critical energy release rate of the cross-ply laminate is the sum of energies associated with the fiber fracture in the 0° layers and matrix
Fig.2. The CT (a) and CC (c) configurations and CT (b) and CC (d) test specimens (Dimensions in mm).
cracking in the 90° layers (they thus neglected other damage modes and interaction between neighboring layers) and (ii) that the matrix cracking in the 90° layers occurred as a single crack parallel to the notch (similar to delamination mode-I). With this last assumption, the critical energy release rate in tension is quantitatively equivalent to that of mode-I de- lamination. This assumption seems reasonable, as the 0° layers are much tougher than the 90° layers, and is found to be a good approximation based on their findings in a previous work [34]. For the particular cross- ply lay-up studied, they derived an equation used to calculate the GICfor
the UD laminate. Later on, Laffan et al. [32]used the following general- ized form of the derived equation (with the same assumptions) to study the lay-up effects on the fracture toughness of carbon/epoxy composites in tensile fiber failure mode;
𝐺0 𝐼𝐶= 𝑡𝑙𝑎𝑚𝑡 0 𝐺𝑙𝑎𝑚 𝐼𝐶 − 𝑡𝑡90 0 𝐺90 𝐼𝐶 (1)
where tlam,t0 and t90 are the thicknesses of the laminate, 0° and 90° layers within the laminate, respectively. 𝐺0
𝐼𝐶 is the fracture energy as-
sociated with the fiber tensile failure mode, and 𝐺90
𝐼𝐶represents the in-
tralaminar mode-I matrix cracking fracture energy. In another study, Laffan et al. [35]observed that there was no interaction between the failure modes occurring in the 0° and 90° plies. This result confirms their approach. Nevertheless, it has been shown that the lay-up in the cross- ply laminates can affect the GICmeasured for the 0° plies [18, 32, 36, 37].
Donadon et al. [38]followed the same approach to calculate the fracture energy in woven cross-ply laminates along with a numerical method. The agreement of the experimental and numerical results confirmed the validity of this approach.
1.2. Translaminarfracturetoughnessincompression
By contrast to TFT in tension, there is no standard test method avail- able to evaluate the fracture toughness of FRCs in compression. In a few works [28, 30], modified CT specimens are used in compression with the
test coupon renamed compact compression (CC). Pinho et al. [28]used the same approach explained in the previous section for determining TFT in compression of UD laminates. They used CC specimens with the configuration shown in Fig.2(c) and (d) and followed the ASTM E399 procedure. They made the same assumptions considering that in com- pression loading, the matrix cracking in the 90° layers is close to what happens in delamination mode-II. Thus, the critical energy release rate in compression is quantitatively equivalent to that of mode-II delamina- tion. They used Eq.(2)to calculate the GICfor the UD laminate in the
fiber direction;
𝐺𝐼𝐶|𝑓𝑖𝑏𝑒𝑟𝑘𝑖𝑛𝑘𝑖𝑛𝑔= 2 𝐺𝐼𝐶|𝑙𝑎𝑚𝑐𝑜𝑚𝑝− 𝐺𝐼𝐼𝐶|𝑚𝑎𝑡𝑟𝑖𝑥𝑖𝑛𝑡𝑟𝑎 (2)
where GIC| lamcompis the critical energy release rate of the laminate, as
measured by a CC test, GIIC| matrixintrais the mode-II matrix failure in-
tralaminar fracture energy, and GIC| fiberkinkingis the fracture energy as-
sociated with fiber-kinking failure mode. Overall, there is a significant difference between the fracture toughness values reported by the au- thors using different approaches to measure compressive TFT [18, 33]. Perhaps this indicates that conventional mechanical tests are not suit- able for this purpose. The compressive fiber failure mode in laminated composites is known as a very complex phenomenon, which is the re- sult of fibers micro-buckling and formation of kink-bands or crushing
[28, 39, 40]. So, and unlike tension, the authors observed large damage zones. Therefore, to measure the pure TFT in compression, the damage mechanisms should be separated.
1.3. Infraredthermography/Translaminarfracturetoughnessmeasurement
In the past two decades, infrared thermography (IRT) has been broadly used to investigate the energy-dissipative processes in materi- als, for example, plastic deformation in metals [41]or damage in poly- meric materials [42]. For composite materials, Naderi et al. [43]used IRT to characterize the damage evolution in fatigue loading. They found that the results were consistent with those obtained by acoustic emis-
Table1
Configuration and applications of flax/epoxy laminates
Plate Application Test Specimen type Layup Fiber surface density (g/m 2 ) Volume fraction (%) Thickness (mm)
1 E1922 ECT [0] 12 200 41 4.04
2 IRT CT and CC [(0/90) 4 /0] s 200 41 6.06
3 E1922 ECT [(90/0) 4 /90] s 200 41 6.06
sion, while Lisle et al. [44, 45]used it to study damage development in fabric-glass/epoxy composites. The relation between fracture toughness and dissipative work has already been proved [46], and depending on the material, the ratio of the dissipative work converted into thermal energy can vary between 10 and 100% [47, 48]. Lisle et al. [49]showed that for a carbon/epoxy composite, the ratio of dissipative work con- verted to heat should be close to 100%, but for metallic materials, this ratio is usually lower. The authors used the IRT to measure the fracture toughness of the GFRP in tension [45]and that of the UD-carbon fiber- reinforced polymer (CFRP) composite in compression [49, 50]. IRT made it possible to separately assess the dissipated energy due to fiber failure in compression and eliminate those associated with material crushing at loading points or secondary cracks. They obtained a value of GIC= 42.5
N/mm in compression and found their results consistent with those of Hongkarnjanakul et al. [51](40 N/mm) and other researchers [28, 39]. There is no previous research using this approach to address NFRPCs.
In summary, no standard test methods have been developed for mea- suring GIC of NFRPCs and of FRCs in compression, and a very limited
number of studies have addressed these topics, while all NFRPCs have been tested in tension. These are essential properties for engineering de- sign purposes and the modeling of these materials with numerical meth- ods, such as FEM. Moreover and to our knowledge, no fractographic and micrographic analysis of this subject have been performed for UD- flax fiber-reinforced epoxy composites (FFRECs). The work presented in this study aims at evaluating the fracture energy associated with the translaminar failure of the UD-FFRECs, using two methodologies, along with an investigation of the fracture behavior and viability of the stan- dard test procedures for FFRECs considering that these procedures are used for synthetic (glass or carbon) FRCs. In the first method, the com- posite was tested according to the existing ASTM E1922 standard. The translaminar fracture was studied, and the GICvalue in tension for crack
propagating perpendicular to fibers was determined and validated. In the second method, employing the IRT-based methodology developed and implemented for this purpose by Lisle et al. [45, 49, 50]as well as ASTM D5045 standard, GIC of UD-FFRECs in tension and compression
was determined, and the material behavior was assessed.
2. Materialsystemandtestspecimens
Unidirectional flax fibers, FLAXTAPE TM200 (from LINEO – France),
with a width of 400 mm and surface density of 200 g/m 2, were used
to reinforce Marine 820 Epoxy System, mixed with 18 wt% Marine 824 hardener (from ADTECH® Plastic Systems), to prepare the UD-FFREC laminates. The composite laminates were molded using the RTM pro- cess. The layers of flax fibers were stacked up according to the required number of layers and orientation of fibers. 300 mm ×300 mm compos- ite plates were molded, starting with [0] 12and [(0/90) 4/0] slaminates, respectively for ECT and CT/CC specimens; then, a third configuration, [(90/0) 4/90] s, has been used to improve the translaminar crack propa-
gation for ECT specimens, as detailed in Table1.
The number of layers and thickness of laminates were precisely cal- culated, according to the ASTM D3171 procedure, and controlled with spacers during molding to result in a constant Vf= 41% for all composite
plates while attaining the required thickness for the test specimens. ECT specimens were prepared according to ASTM E1922 for evaluat- ing the TFT in tension. Fig.1shows the configuration and photograph of a typical specimen. The CT and CC specimens used for TFT measurement
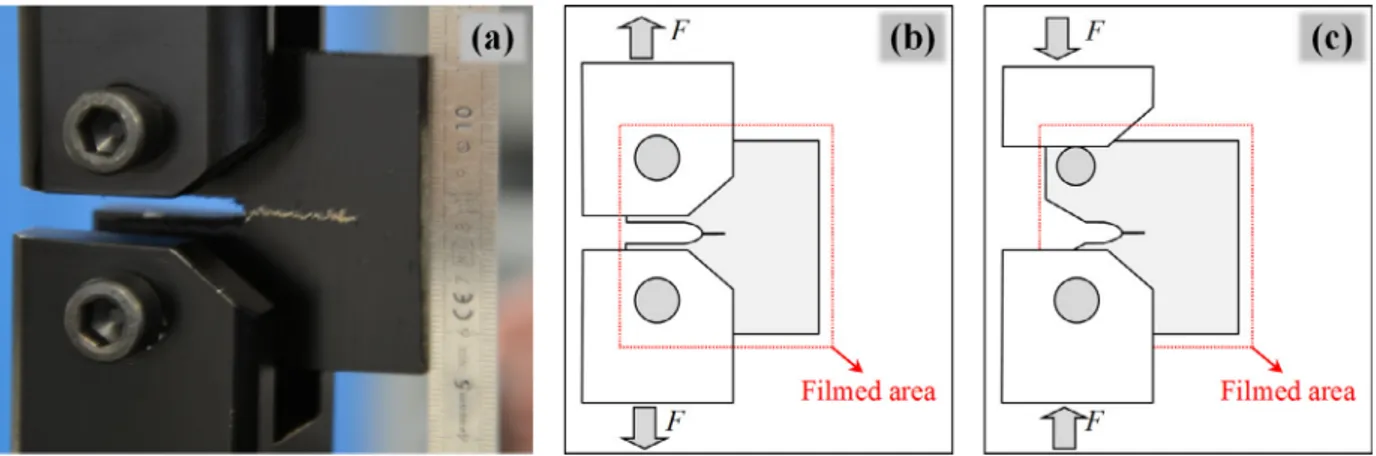
in combination with IRT were prepared according to in-plane dimen- sions specified in Pinho et al. study [28]. The configurations and pho- tographs of typical specimens are shown in Fig.2. The same type of CT specimen was also used in [31, 32, 35]. Pujols Gonzalez et al. [52]used CT and CC specimens to evaluate in tension and compression TFT of CFRP composites using IRT-based methodology, respectively. A similar methodology is adapted and employed in this study. Rectangular speci- mens were cut by a 10-inch/90-tooth, DIABLO’s cutting saw blade, with high-density carbide tooltips. Then, the loading-pin holes were drilled with the help of sacrificed plates to avoid damages to the specimens. A Protostar® mini corner radius solid carbide shoulder/slot milling cutter (Protostar®-Walter tools) was used to cut the notch in ECT specimens. As can be seen in Fig.1(d), despite the low machinability of NFRPCs in terms of surface quality, a very neat notch is cut without damaging the composite. The 4 mm-notch on the CT and CC specimens were cut using a milling cutter; the notch mouth on the CC was widened, and the final notch (pre-crack) on CT was cut using a wire saw. Two clevises were also designed and manufactured to eccentrically introduce the load to the specimens ( Fig.1(c)).
3. Translaminarfracturetestsanddatareductionmethods
3.1. StandardtensiontestingofECTspecimens
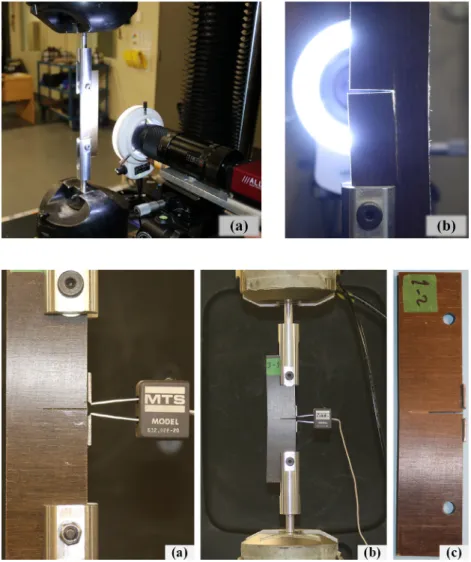
ASTM E1922 standard involves tension testing of single-edge- notch specimens to determine the tensile TFT of various carbon and glass/polymer composites. However, it can be applied to other FRPCs, provided that the specimen dimensions and the test results satisfy the requirements of the standard [25]. Following the guidelines of this stan- dard and aiming at measuring the fracture toughness of the UD-FFRECs in the current study, ECT specimens ( Fig.1(b)) were cut from the UD- FFREC laminate with a nominal thickness of 4 mm (plate 1 in Table1). Here, the low stiffness of the ECT specimens made it impossible to in- stall the conventional extensometers, using knife edges, at the notch- mouth to measure the notch mouth opening displacement (NMOD). Al- ternatively, a digital image correlation (DIC) setup, synchronized with load application, was used for this purpose, as shown in Fig.3(a). How- ever, none of the five ECT specimens tested with such setup experi- enced a self-similar (parallel to the pre-notch) crack growth and did not result in effective translaminar crack growth of concern in this test method. Indeed, the crack propagated perpendicular to the notch and in the fiber direction, which invalidated the tests, as shown in Fig.3(b). To the authors’ knowledge, no ECT specimens of synthetic or natural UD-FRCs have been tested in the literature, the reported ECT tests are mostly for natural/synthetic fabric or cross-ply reinforcement architec- tures [18, 22, 23, 53], and a few were from pultruded composites [14]; therefore, no benchmark study was possible, and these experiments were unavoidable.
To overcome this difficulty, cross-ply laminates were used to avoid the large difference in strength between the longitudinal and transverse direction of the test specimen, such that each 0° layer is backed by a 90° layer to inhibit crack propagation perpendicular to the notch, similar to the approach in [28, 32]. Eq.(1)is used to calculate the translaminar fracture energy of UD plies using that of a cross-ply laminate and the Mode I and Mode II interlaminar fracture energies of the UD laminate. For this purpose, a second laminate was fabricated (plate 3 with the lamination sequence of [(90/0) 4/90] sand nominal thickness of 6 mm),
Fig.3. Test setup with DIC used to measure NMOD (a) and failed ECT UD specimen (b).
Fig.4. ECT specimen; knife edges and installed extensometer (a) test setup (b), and failed sample (c).
and ECT specimens ( Fig.1(a)) were cut and prepared. These thick and stiff enough specimens made possible the installation of an extensome- ter to measure the mouth opening. Therefore, precisely machined knife edges were bonded to the specimens’ edge on both sides of the notch mouth, Fig.4, and the extensometer MTS (632.02F-20) was installed to measure the notch-mouth-opening displacement (NMOD). The tests were conducted with a 0.7 mm/min crosshead displacement rate on an MTS (858 Mini Bionix-II) machine, with a mounted 15 kN load-cell. The test setup and specimen are shown in Fig.4(a) and (b). The tests contin- ued until the applied force dropped to a magnitude of less than 50% of the peak load. The specimen exhibited a translaminar self-similar crack growth, as expected, Fig.4(c).
Data reduction was performed according to ASTM E1922, and the TFT was calculated through the stress intensity factor approach, as;
𝐾 𝐼𝑐 = [ 𝑃 𝑚𝑎𝑥 𝐵 𝑊 1∕2 ] 𝛼1∕2 [ 1 . 4 + 𝛼] [3 . 97 − 10 . 88 𝛼 + 26 . 25 𝛼2 − 38 . 9 𝛼3 + 30 . 15 𝛼4 − 9 . 27 𝛼5 ] [ 1 − 𝛼] 3∕2 (3)
where KIcis the critical stress intensity factor (MPa m 1/2), Pmaxis the
maximum applied or fracture load (MN), 𝛼 =𝑎∕ 𝑊 is a dimensionless parameter, while a is the notch length, B is specimen thickness, and W
is specimen width ( a,Band Ware in meter). According to the standard,
KIcprovides a valid measure of TFT, when the damage zone is rela-
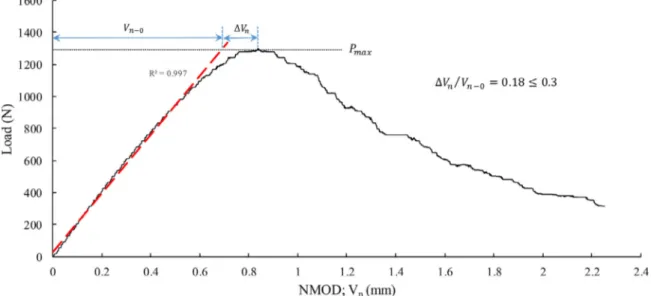
tively small. This criterion is defined based on NMOD values at maxi- mum load as ΔVn/ Vn−0 ≤ 0.3, for ΔVnand Vn−0shown in Fig.6. For
orthotropic plates under plane stress (with a pre-crack subjected to in- plane loading), the fracture energy GIC can be calculated from KIcas
Table2
Mechanical and thermal properties of UD-FFREC ply [56]
Longitudinal elastic modulus, E 11 22.69 ∗GPa
Transverse elastic modulus, E 22 4.34 ∗GPa
Shear modulus, G 12 1.92 GPa
Poisson’s ratio, 𝜐12 0.4 ∗
Density, 𝜌 1280 kg/m 3
Specific heat, C 665 J/kg/K
Thermal conductivity in normal (z) direction, k 33 0.115 W/m/K
∗Average of the values in tension and compression.
Table3
Elastic properties of [(90/0) 4/90] slaminate
Exx (GPa) Eyy (GPa) Gxy (GPa) 𝜐xy
14.74 12.68 1.92 0.14 follow [17, 28, 39, 54, 55] 𝐺𝑙𝑎𝑚 𝐼𝑐 = 𝐾2 𝐼𝑐 √ 2𝐸𝑥𝑥𝐸𝑦𝑦 [( 𝐸𝑥𝑥 𝐸𝑦𝑦 )1∕2 + 𝐸𝑥𝑥 2𝐺𝑥𝑦 −𝜐𝑥𝑦 ]1∕2 (4) where Exx,Eyyare the laminate elastic moduli respectively in the x and y
directions (shown in Figs.1(a), 2(a), and (c)), Gxyis the laminate shear
modulus, and 𝜐𝑥𝑦is the Poisson’s ratio. For the [(90/0) 4/90] slaminate,
these properties, presented in Table3, are calculated from those of the UD laminate given in Table2, published in a previous work [56], by using the classical laminate theory [57].
Fig.5. Experimental setup for IRT methodology (a), test specimen and thermal investigation area for CT (b) and CC (c).
3.2. Infraredthermographymethod
In order to overcome the problems experienced with experimental methods used to study the translaminar fracture of composite materials, it was proposed to develop an approach allowing estimating the rate of energy release via the temperature measurement in [43, 45, 49, 50]. Characterizing the fracture energy utilizing IRT is an idea conceptual- ized based on the principles of irreversible thermodynamics and thermo- mechanical laws. The complete details of the methodology, including all assumptions made and their validity, are well described in 45, 49, 50]for evaluating the tensile and compressive fracture energy of FRCs, and the reader should refer to these documents for more details.
Having the dissipated energy evaluated with IRT, the fracture energy, GIC, can be determined using Eq.(5)[45, 49].
𝐺𝐼𝐶= 𝑑𝑊𝑑𝐴𝑖𝑟𝑟𝑒𝑣= 𝑑𝛽.𝑑𝐴𝑊𝑑𝑖𝑠𝑠 (5)
where dWirrevdenotes the total irreversible energy, dWdissis the energy
dissipated as heat, dAis the crack surface growth and 𝛽 =𝑑𝑑𝑊𝑊𝑑𝑖𝑠𝑠
𝑖𝑟𝑟𝑒𝑣 is the
Taylor–Quinney coefficient (0 ≤𝛽 ≤ 1).
Some studies of metallic materials reported 𝛽 ≈ 1 for Ta [47, 49]
and 0.5 ≤𝛽 ≤ 1 for stainless steel, depending on the applied strain rate
[49]. However, allocating value for this ratio remains a delicate issue in this study, because, no values are available for the flax/epoxy compos- ite under study. Furthermore, the magnitude of the coefficient is strain and strain-rate dependent [45, 48, 49]. Li and Lambros [48]investigated PMMA and PC polymers in terms of the value of 𝛽 and its sensitivity to strain and strain-rate. The authors found it impossible to measure 𝛽 for PMMA; however, they reported values between 50% for high strain and 100% for low strain, independent of the strain-rate in the ranges of the investigation. Considering the available 𝛽 values for polymers in the literature, values of 𝛽 = 0.5 and 𝛽 =0.9 were chosen for this study. The results are then compared to those obtained from the ASTM E1922 standard test method to evaluate the validity of the assumptions.
In this study, the 3D thermal analysis methodology developed in
[45, 49]is utilized to evaluate the heat sources in the composite using the thermal properties in Table2, from which the dissipated energy and then, using Eq.(5), the critical energy release rate or fracture energy GIC
is calculated. For this purpose, the adapted CT and CC specimens from
[28], shown in Fig.2, were cut from [(0/90) 4/0] slaminate (Plate 2 in
Table1) and mechanically loaded in tension and compression respec-
tively. CT tests were conducted following ASTM D5045 standard, and CC tests were performed with the same procedure with a compression loading. The temperature change at the surface of the specimen (outer- most 0°-ply of the [(0/90) 4/0] slaminate) was simultaneously recorded and synchronized with the load and displacement data. The test setup is shown in Fig.5(a). It can be noticed that for the CC tests, the grip of the machine was only put on the axis of load introduction in order to have a
larger filmed area ( Fig.5(c)). The translaminar fracture tests were car- ried out on an electromechanical traction machine (INSTRON 100kN) at ambient temperature ( ≈25°C) and a constant displacement rate of 2 mm/min. The thermal data of the specimen surface was recorded at a frequency of 50 Hz using an infrared camera (FLIR SC7000) with a res- olution of 320 ×256 pixels, and a thermal resolution of 0.025 K for temperature variation measurement. The spatial resolution (pixel size) determined by the focal distance is set at 0.264 mm. The target surface of the specimen was painted black in order to maximize the emissivity coefficient, and then the value is supposed to equal 1 for data treatment. As expected, for CT specimens, the through-the-thickness crack propa- gated parallel to the 90° fibers by breaking the fibers in the 0° layers and created almost a planar fracture path, Fig.5(a). The fracture path at the edge of the specimen opposite to the notched side shows that the crack path is almost planar.
4. Resultsanddiscussion
4.1. StandardtensiontestingofECTspecimens
A typical load vs. NMOD curve of a cross-ply ([(90/0) 4/90] s) ECT
specimen is shown in Fig.6. From this curve, it can be observed that the composite exhibits a linear behavior ( R2= 0.997) up to around 80%
of the maximum load. Subsequently, upon initiating the damage zone ahead of the notch tip, a gradual deviation from linearity appears and continues up to the peak load. After reaching the peak value, the load decreases slowly with no sudden drops, meaning that a stable translam- inar fracture occurs and propagates, consistent with the observations during the test. Similar behavior was observed for woven-flax/epoxy composites tested using CC specimens [12], woven-sisal/polyester com- posites tested using ECT [22], and woven-sisal/PU composites tested by CT specimens [19]. On a macroscopic scale, the wake of self-similar crack can be seen on a failed specimen in Fig.4(c), satisfying the re- quirement of the ASTM E1922 concerning effective translaminar crack growth. As shown for the typical specimen in Fig. 6, the additional NMOD during fracture, ΔVn, fulfills the criterion of ASTM E1922, in
this case with ΔVn/ Vn−0= 0.18 ≤ 0.3, and validates the translaminar
fracture toughness ( KIC) obtained using Eq.(3)for all the tests. Substituting the 𝛼 parametervalue in Eq.(3)and using the maximum load, the KICof the cross-ply specimens ([(90/0) 4/90] s) was computed,
and the results are summarized in Table4. The fracture energy ( 𝐺𝑙𝑎𝑚𝐼𝐶) was subsequently obtained from the data in Table3and Eq.(4)and is also presented in Table4. As discussed earlier, Eq.(1)is used to calculate the fracture energy of the 0° sub-laminates ( 𝐺0
𝐼𝐶) where 𝐺90𝐼𝐶is assumed
to be equivalent in magnitude to the mode-I interlaminar fracture energy of the UD-FFREC, 𝐺𝑑𝑒𝑙𝑎𝑚
𝐼𝐶 , which was evaluated in a separate study as
𝐺𝑑𝑒𝑙𝑎𝑚
𝐼𝐶 = 0 .691 kJ/m 2[58]. Accordingly, t0 and t90 were obtained by
Fig.6. Load vs. Notch-mouth-opening displacement (NMOD) curve.
Table4
Fracture toughness and fracture energy of UD-FFREC
𝐾 𝑙𝑎𝑚
𝐼𝐶 (MPa m 1/2 ) 𝐺 𝑙𝑎𝑚𝐼𝐶 (kJ/m 2 ) 𝐾 𝐼𝐶0 (MPa m 1/2 ) 𝐺 0𝐼𝐶 (kJ/m 2 )
Mean 8.07 7.37 14.27 15.71
STD 0.30 0.55 0.57 1.23
C.O.V. (%) 3.78 7.41 3.99 7.82
plies in the laminate, i.e., 8 and 10 plies. For comparison purposes with the literature data, 𝐾0
𝐼𝐶of the UD-FFREC laminate was calculated back
from 𝐺0
𝐼𝐶and its elastic properties (given in Table2) using Eq.(4). The
results are presented in Table4.
It is difficult to compare these results with the literature considering the very limited works published on the measurement of TFT in NFR- PCs, particularly FFRECs. Nevertheless, the value obtained for 𝐾𝐼𝐶𝑙𝑎𝑚is in excellent agreement with the results published by Liu et al. [12]for woven-flax/epoxy CT tests, shown in Table5. They published 𝐾𝑙𝑎𝑚
𝐼𝐶 val-
ues in the range of 3 to 8.5 MPa m 1/2, albeit at lower V
f(from 31% to
35%), that covers the obtained value in this study. The 𝐾𝑙𝑎𝑚
𝐼𝐶 = 7.2 MPa
m 1/2mentioned in Table5, with the reinforcement configuration most
consistent with the cross-ply laminate tested in this present study but for a fabric instead of UD reinforcement in the present study, should be compared to the value of 𝐾𝑙𝑎𝑚
𝐼𝐶 in Table4. Overall, their results are
consistent with the findings of the present study, considering the Vfand
different ply architecture, and these two studies confirm each other.
KIC = 7.71 MPa m 1/2 reported by Ashik et al. [24]for 50/50 wt%
woven-jute/epoxy composite ( Table5) is also in the range of the ob- tained results. The higher fiber content, but lower strength of jute fibers could have balanced the toughness to be consistent with the result of the present work [3, 11, 59]. Chizyuka and Kanyanga [22]obtained KIC= 6.5
MPa m 1/2for fabric-sisal/polyester composites with V
fbetween 50% to
55% ( Table5). The lower KICof this composite can be attributed to the lower tensile strength of sisal fibers compared to flax fibers [3, 11, 59]. On the other hand, Silva et al. [19]reported GIC ≈ 11.5 and GIC ≈
7 kJ/m 2respectively for a fabric and short fiber sisal/PU composite with
Vf≈0.30 ( Table5). The GICof short fiber sisal/PU composite is in the
range of our results, but that of sisal-fabric is much higher. Due to re- porting the toughness of sisal-fabric/PU in the form of GIC, it cannot be
compared with those of similar materials; fabric-sisal/polyester compos- ite reported in [22]and textile sisal/vinyl-ester reported in [20], both indicated by KIC, see Table5. The authors attributed the high perfor-
mance of fabric-reinforced PU to the better compatibility between NFs
and natural resins and to the structure of the reinforcement. Li et al.
[20]reported a KIC= 4.2 MPa m 1/2for a textile sisal/vinyl ester com-
posite at Vf≈0.32, which increased to 6 MPa m 1/2 after applying a
fiber surface treatment. Hughes et al. [11]measured KIC = 5.04 and
KIC= 5.62 MPa m 1/2respectively for jute and hemp non-woven felt re-
inforced polyester, Table5. The reported KIC≈8.5 MPa m 1/2by Ismail
et al. [21]for UD twisted-kenaf-yarn/polyester composites is also con- sistent with the values determined in this research, Table5. Considering the reasonable variability of the results and after comparing them to the available literature data, it can be concluded that the measured values are a realistic representation of the fracture toughness and fracture en- ergy of the FFREC.
4.2. FractographyoftheECTspecimens
The fracture paths of ECT specimens when the load dropped to about 0.2P max, are shown in Figs.4(c) and 7(a). The failed specimen is not sep- arated into two parts to expose the fracture surface, so it is difficult to examine the fracture in terms of failure mechanisms. On the other hand, separating the two parts of the specimen would alter the rupture faces. Nevertheless, to perform a microstructural study and explore the frac- ture mechanisms, one of the specimens was loaded up to full separation to expose the fracture surface near the notch tip.
The micrographs are shown in Fig.7(a) and (b). At the surface ply, which is a 90° ply oriented parallel to the notch, matrix cracking and splitting of the ply has occurred, and then, with crack growth, fiber- matrix debonding and fiber bridging have developed. In addition, the crack emanated from the corner of the notch and propagated in a self- similar manner. For further analysis of the failure mechanisms, the frac- ture surface is investigated from three viewing directions, as indicated in Fig.8(a). The normal view of the fracture surface, Fig.8(b), clearly shows the 0° and 90° layers. Fiber-matrix debonding and matrix crack- ing can be observed in the 90° plies, while fiber fracture occurred in the 0° plies. The side view in Fig.8(c) shows a huge fiber pull-out, fiber bundle fracture, and fiber bundle splintering. These phenomena are ac- cepted as the dominant failure modes contributing to fracture toughness in composites [19, 28, 32, 35]. The high volume of fiber pull-out is an in- dication of the poor fiber-matrix adhesion (due to poor compatibility of hydrophilic NFs towards the hydrophobic polymer matrix), resulting in weak interfaces that have been observed several works [11, 20, 56, 60]. Although fiber pull-out is a mechanism that accounts for significant en- ergy absorption in FRCs [11], poor fiber-matrix adhesion along with fiber slippage inside the flax bundle after fiber fracture could ease the
Table5
Literature data for fracture toughness of NFRPCs
𝐾 𝑙𝑎𝑚
𝐼𝐶 (MPa m 1/2 ) 𝐾 𝐼𝐶𝑙𝑎𝑚 (MPa m 1/2 ) 𝐾 𝐼𝐶𝑙𝑎𝑚 (MPa m 1/2 ) 𝐺 𝑙𝑎𝑚𝐼𝐶 (kJ/m 2 ) 𝐾 𝐼𝐶𝑙𝑎𝑚 (MPa m 1/2 ) 𝐾 𝐼𝐶𝑙𝑎𝑚 (MPa m 1/2 ) 𝐾 𝑙𝑎𝑚𝐼𝐶 (MPa m 1/2 )
Ref. [12] [24] [22] [19] [20] [11] [21]
Material system Woven flax/epoxy Woven jute/epoxy Fabric sisal/polyester
Fabric and short fiber sisal/PU
Fabric sisal/vinyl ester
Jute and hemp mat/polyester
Woven kenaf/polyester Fiber content Vf = 0.31–0.35 50 wt% Vf = 0.50–0.55 Vf ≈ 0.30 Vf ≈ 0.32 Vf ≈ 0.41 No available
Toughness (3–8.5) 7.2 ( V f ≈ 0.33)
7.71 6.5 11.5 and 7 4.2–6 5.04 and 5.62 8.5
Fig.7. Fracture path of cross-ply ECT specimen; (a) whole crack growth after failure, (b) fiber bridging.
fiber pull-out without a corresponding large energy absorption. This ef- fect will cause fiber pull-out to share a smaller contribution to fracture toughness. There is no information in the literature about the fracture toughness of flax fibers; however, these might be some reasons why FFREC is offering lower TFT compared to engineered FRCs. The top view, Fig.8(d), reveals the depth of the pulled-out fibers and the severity of this phenomenon.
4.3. Infraredthermographymethod
Subjecting six CT to tensile load and seven CC specimens to compres- sion load, the translaminar fracture tests were conducted according to the method described above. Typical temperature variation fields mea- sured using IRT associated with the crack propagation are presented in
Fig.9. The temperature increase observed during crack propagation is clearly higher for the CT specimens than for the CC ones: increasing of about 5 °C for CT and less than 2 °C for CC. This result confirms the usual conclusion that the fracture toughness of translaminar failure is higher in tension than in compression [28, 30, 33, 35]. Moreover, the ex- tent of warming over the coupon is larger for compression; this means the phenomenon of compressive failure creates a larger area of damage. The corresponding load-displacement curves of CT and CC tests are plotted in Fig.10(a) and (b), respectively. For all the CT and CC tests, the crack propagation started about at maximum load. The CT specimens experienced a progressive propagation of crack during the load drop. The two first CC tests, CC1 and CC2, had to be stopped at 6.5 mm of displacement due to a contact between the edges of the notch. Then the other CC tests were continued until 5.5 mm of displacement and the sample unloaded until diminishing of the load.
Finally, the intrinsic dissipation was evaluated using the IRT measure for CT ( Fig.10(c)) and CC specimens ( Fig.10(d)). For the CT specimens, the intrinsic dissipation is significant (value higher than 4 ×10 6J/m 3)
and concentrated at the crack edges. In Fig.10(c), the edges of the sam- ple are also seen due to the movement of the sample during the test.
Evidently, the value of the intrinsic dissipation evaluated at the sam- ple edges should not be considered. For the CC specimens, the intrinsic dissipation is relatively low (a value lower than 0.5 ×10 6J/m 3), and
the crack path is barely detectable. Moreover, due to the scale used in
Fig.10(d), some measured noises are visible. As will be explained in the two subsequent sections, according to the literature data for synthetic FRCs, GICin compression is lower than in tension. Therefore, knowing that the generated heat is proportional to GIC, it is logical to obtain lower
intrinsic dissipation for CC specimens than for CT specimens. However, for the authors, the obtained result for CC tests seems too low. Since IRT measures the temperature only at the surface, this might be due to the delamination (observed in compression testing of FFREC [56]) and possible buckling of the outer plies, which would hide a significant part of the created heat. Hence, it will not be possible to evaluate the real temperature inside the laminate.
4.4. TensiontestingofCTspecimens
Globally, CT specimens exhibit a brittle behavior with a relatively linear response up to almost the maximum load, which is followed by a sudden and then continuous force drop, indicating consistent crack growth and stiffness reduction, as shown in Fig.10(a). These curves are very similar and are in good agreement with those reported in the litera- ture for CT specimens of carbon/epoxy composites [28, 31, 32, 35], which is as such an indication of the validity of the current tests. Therefore, they seem to have small enough damage zone to use the ASTM D5045 standard, which is developed for isotropic plastic materials, to evaluate the fracture toughness for comparison purposes. The fracture energy of the UD laminate ( 𝐺𝑇 𝑒𝑛
𝐼𝐶) was calculated using the same approach applied
to ECT specimens, and the results are summarized in Table6.
As shown in Fig.9, for CT specimens, the damage zone is minimal; this was also observed by Pinho et al. [28]using C-Scan. The propa- gation of the crack is perceivable from the thermal image exposed in
Fig.8. Fracture surface of cross-ply ECT specimen; (a) definition of the viewing directions, (b) normal view to fracture surface, (c) normal view to specimen surface and (d) view parallel to the notch.
polymers in the literature, two cases were investigated; first assuming
𝛽 = 0.5 and second, 𝛽 = 0.9. Data treatment in the selected zones was performed according to the developed and validated methodology in
[45, 49]. The obtained fracture energy value is presented in Table6. It can be seen that the value of 𝐺𝑇 𝑒𝑛
𝐼𝐶 obtained by ASTM D5045, which
was developed for isotropic plastic materials, is much ( ≈49%) higher than that determined by ASTM E1922, specially developed for FRCs. The later was particularly developed and validated based on synthetic FRCs, though, according to the standard, it is applicable to other types
of FRPCs provided that the criteria are met. However, in this study, it was applied to NFRPCs, which have a more complicated microstruc- ture and may behave differently. This is because NFs are composite by themselves that normally come in bundles containing technical fibers that are composed of helically arranged microfibrils as the main force carrying elements. Therefore, they exhibit more complex failure behav- ior with high variability in the material properties. The complex mi- crostructure of the NFs will impose a complex fiber fracture leading to different mechanisms of energy absorption. Consequently, as a domi-
Fig.9. Temperature variation field observed during the crack propagation of CT, (a) and CC, (b) specimens.
Fig.10. Load–displacement curves for the CT (a) and CC (b) specimens, and intrinsic heat measured by IRT for the CT (c) and CC (d) specimens.
Table6
Fracture toughness and fracture energy of UD-FFREC evaluated by IRT and standard methods
IRT ASTM standards
𝐺 𝑇 𝑒𝑛
𝐼𝐶 (kJ/m 2 ) 𝐺 𝐶𝑜𝑚𝑝𝐼𝐶 (kJ/m 2 ) 𝐺 𝑇 𝑒𝑛𝐼𝐶 (kJ/m 2 ) 𝐺 𝐼𝐶𝑇 𝑒𝑛 (kJ/m 2 ) 𝐺 𝐶𝑜𝑚𝑝𝐼𝐶 (kJ/m 2 ) 𝐺 𝐶𝑜𝑚𝑝𝐼𝐶 (𝐿𝑖𝑛𝑒𝑎𝑟)(kJ/m 2 )
𝛽 = 0.50 𝛽 = 0.90 𝛽 = 0.50 𝛽 = 0.90
E1922 D5045
Max Load Max Linear
Mean 19.88 11.10 1.30 0.77 15.71 23.37 41.29 9.84
STD 2.68 1.49 0.119 0.066 1.23 2.28 3.56 0.39
nant failure mechanism, the complex fracture of NFs will influence the fracture toughness of the composite and may require a different deter- mination method.
Nevertheless, there is no standard test method developed for testing NFRPCs and no literature data available to validate the results. Con- sequently, for the time being, 𝐺𝑇 𝑒𝑛
𝐼𝐶determined by ASTM E1922 can be
considered as the most reliable tensile TFT value for the understudy FFRECs. This value is placed between the values obtained by IFT analy- sis for 𝛽 = 0.90 and 𝛽 =0.50by ± 29% difference. Considering the high variability of material properties for NFs, these values could be consid- ered consistent with that of the standard method. In general, even the data available for synthetic FRPCs are scattered, for instance, CT tests of a unique CFRP composite show more than 15% variation [30, 35]. However, assuming the result of the standard method as the real value, it may be concluded that the realistic value of 𝛽 for the understudy flax/epoxy is between the margins (0.50 and 0.90) used for analysis, or, technically speaking, the ratio of dissipative work converted into heat in this composite is between 50% and 90%. Considering that GICis an inverse linear function of 𝛽, this ratio for the composite can be calcu- lated back from the result of the standard test ( 𝛽 =0.69) and be used in the future calculation of the fracture energy, for instance in compressive failure mode, presented in the following section. Consequently, having a precise enough value for 𝛽,the employed method based on IRT can be confidently used to determine the fracture energy of the composites.
Naturally, the failure modes in CT specimens are the same occurring in ECT, as discussed in the previous section.
4.5. CompressiontestingofCCspecimens
The load-displacement response of the CC tests ( Fig.10(b)) is more difficult to interpret. As can be observed, CC specimens exhibited com- plex, but similar behavior in compression loading. The similarity of the curves indicates a good reproducibility and the certainty of the data recorded for the composites under study. The composite displays a lin- ear behavior up to a displacement of about 1.2 mm (1500 N of loading), where a clear slope reduction happens. After this point, a relatively lin- ear response continues until a displacement of 3 mm followed by a non- linear curve up to the maximum load. For all of the specimens, the visual signs of failure occurred at the maximum load, and upon reaching this point, the load slowly dropped until the test was stopped. The load- displacement response of these CC specimens is more or less analogous to that of carbon/epoxy CC specimens [28, 30]; however, flax/epoxy composite demonstrates much higher nonlinearity. The ASTM D5045 standard was first employed to evaluate the fracture toughness in com- pression of the cross-ply laminate using the maximum load. Then, the fracture energy of the UD laminate in compression ( 𝐺𝐶𝑜𝑚𝑝𝐼𝐶 ) was cal- culated following the aforementioned approach used by Pinho et al.
[28]for CC specimens and assuming that 𝐺90
𝐼𝐶 is equivalent in mag-
nitude to the mode-II interlaminar fracture energy of the UD-FFREC,
𝐺𝑑𝑒𝑙𝑎𝑚
𝐼𝐼𝐶 , which was evaluated in a separate study as 𝐺𝑑𝑒𝑙𝑎𝑚𝐼𝐼𝐶 = 0 .378 kJ/m 2,
the results are summarized in Table6. However, the result is unreason- ably higher compared to 𝐺𝑇 𝑒𝑛𝐼𝐶, whereas it is expected to be lower for compression testing [28, 30, 33, 35]. This should be due to the nonlinear- ity that corresponds to some damages or plasticity in the sample and means that an important part of the dissipated energy is not due to the crack propagation but to other secondary damage phenomena. There- fore, the onset of damage must have happened much before reaching the maximum load point. Considering the low stiffness of flax fibers in compression and the poor fiber-matrix adhesion, this failure mode is a matrix-driven failure. Thus, it is expected that the isotropic epoxy ma- trix exhibits a linear behavior up to failure. Therefore, theoretically, the composite translaminar failure in compression should start in the end- point of the first linear part, after which, by the development of other secondary material damages, the stiffness of the sample and the slope of the curve reduce. As a result, the load at this point is considered as the compressive translaminar failure load and is used to evaluate the
𝐺𝐶𝑜𝑚𝑝𝐼𝐶 of the composite, the result is presented in Table6. The litera- ture data for 𝐺𝐼𝐶𝐶𝑜𝑚𝑝is very scattered, for instance, conducting 4-point bending tests, Laffan et al. [61]measured value of 𝐺𝐶𝑜𝑚𝑝𝐼𝐶 = 25 .9 kJ/m 2
for IM7/8552 CFRP, while Catalanotti et al. [30]reported 𝐺𝐶𝑜𝑚𝑝𝐼𝐶 = 47 .5 kJ/m 2 for the same material system and Pinho et al. [28]published
𝐺𝐶𝑜𝑚𝑝𝐼𝐶 = 79 .9 kJ/m 2for another CFRP, both using CC specimens. There-
fore, the value in this range can be a good representative of the fracture energy of the composite. Nevertheless, the complex microstructure of the NF composite and, consequently, its complex behavior increases the difficulty of recognizing the precise failure point and needs deeper anal- ysis.
Fig.9shows that CC specimens experience much broader damage zone compared to CT specimens, also observed by Pinho et al. [28]. However, the onset of failure and propagation of the crack couldn’t be recognized in the thermal images and the experimental heat source fields.
In a similar approach to CT tests, assuming 𝛽 = 0.50 and 𝛽 = 0.90 the data were processed to determine the translaminar fracture energy in compression ( 𝐺𝐼𝐶𝐶𝑜𝑚𝑝), and the obtained values are given in Table6. As expected, the values are lower than those for CT tests, though they are obviously too low, indicating that the IRT methodology is underestimat- ing the fracture energy in compression for these composites. There is no available literature data for 𝐺𝐶𝑜𝑚𝑝𝐼𝐶 to be compared with the obtained val- ues; however, the proportion of the 𝐺𝑇 𝑒𝑛
𝐼𝐶 to 𝐺𝐶𝑜𝑚𝑝𝐼𝐶 for other composites
evidently shows that these the measured values by IFT do not represent the 𝐺𝐶𝑜𝑚𝑝𝐼𝐶 of the composite. Considering the presence of complex failure modes in CC specimens, which is more complicated for NF composites, it is not trivial to perform a root-cause-analysis for this issue; however, some hypotheses can be made. A previous study shows that the UD- FFREC experiences delamination damage in compression failure [56]; this may be the case for the cross-ply CC specimen. Therefore, the sur- face layer might have been delaminated before a translaminar failure occurs and then buckled in the out-of-plane direction so that the gener- ated heat in the surface ply is not associated with a translaminar failure and could be the result of other failure modes, like buckling, produc- ing much less heat. It could also be related to the microstructure of the flax fibers so that, under compression loading, their internal structure collapses, with the fibers being compressed in themselves to generate re- versible energy, rather than failing to produce thermal energy. Finally, the poor fiber-matrix adhesion could make the fibers ineffective in car- rying the compression load; thus, the fracture energy could be mostly related to matrix failure in compression. This hypothesis is supported by Mode-II interlaminar fracture energy of UD-FFREC, 𝐺𝑑𝑒𝑙𝑎𝑚
𝐼𝐼𝐶 = 0 .378
kJ/m 2, measured in another study [58], as their failure modes are sim-
ilar, and the fracture energy values are close.
In summary, using IRT and cross-ply laminates, valid values cannot be determined for 𝐺𝐶𝑜𝑚𝑝𝐼𝐶 of the UD-FFRECs. However, assuming that the failure starts at the end of the first linear part of the load-displacement curve and using the ASTM D5045 standard, a reasonable value can be achieved for 𝐺𝐶𝑜𝑚𝑝𝐼𝐶 of the UD-FFRECs.
5. Conclusions
This study has investigated the fracture behavior and evaluated the fracture toughness parameters of the UD-FFRECs under quasi-static ten- sile and compressive loads. The existing ASTM E1922 standard test method was employed to examine the fracture toughness of ECT speci- mens in tension, and an already developed methodology based on IRT, as well as ASTM D5045, were applied to study the fracture energy in tension and compression respectively using CT and CC specimens. Af- terward, combining the micrographs and the load-NMOD curves, the fracture behavior and the fracture mechanisms of the composite were studied.
Applying the ASTM E1922 standard test method to determine the tensile fracture toughness using UD laminates was impossible, and the
self-similar translaminar crack growth of concern was not exhibited. A cross-ply laminate was instead used to evaluate the fracture toughness of the laminate and extract that of UD composite following an approach that was already used and proved valid in some earlier studies. Although there are no published fracture property data for these composites for comparison, the obtained values ( GIC= 15.71 kJ/m 2and KIC= 14.27
MPa m 1/2) fit very well in the range of those of the similar NFPCs avail-
able in the literature.
Experimental tests using IRT were conducted, and employing the developed program, the data were treated to determine the fracture toughness of the composite in tensile and compressive loadings using CT and CC cross-ply composite specimens, respectively. An assumption of
𝛽 =0.5 and 𝛽 = 0.9 was made for the Taylor–Quinney coefficient based on the existing values for similar materials. Compared to the standard test results, CT specimens demonstrated proper adequacy for this pur- pose; however, the results of CC tests were too low and thus unsatisfac- tory. Employing this methodology to CT tests, the values of 𝐺𝑇 𝑒𝑛
𝐼𝐶 = 19.88
and 11.1 kJ/m 2, respectively for 𝛽 = 0.5 and 𝛽 = 0.9, were obtained.
The results of IRT are consistent with and are covering those of the ASTM E1922, showing that the real value of 𝛽 is between the two as- sumed values. Therefore, the application of the IRT method for evalu- ating tensile translaminar fracture energy of UD-flax/epoxy composites using CT tests is validated; however, the accuracy of IRT for determin- ing the compressive translaminar fracture energy using CC specimens is not proved. Instead, for CC tests it was concluded that using the max- imum load of the initial linear load-displacement curve as the failure load and ASTM D5045 standard leads to a reasonable compressive frac- ture energy 𝐺𝐶𝑜𝑚𝑝𝐼𝐶 = 9 .84 kJ/m 2. The fractography study reveals that the
primary mechanisms activated in translaminar failure are fiber pull-out, fiber breakage, and fiber-matrix debonding. To conclude, a view of the translaminar fracture behavior of the UD-FFRECs has been drawn, and the translaminar fracture toughness parameters in the fiber direction and under tensile and compressive loadings are determined. These val- ues are the most reliable data ever obtained to be used in engineering design and numerical simulation studies.
DeclarationofCompetingInterest
The authors declare that they have no known competing financial interests or personal relationships that could have appeared to influence the work reported in this paper.
CRediTauthorshipcontributionstatement
YousefSaadati: Conceptualization, Investigation, Formal analysis, Data curation, Validation, Writing - original draft. GilbertLebrun:Con- ceptualization, Supervision, Writing - review & editing, Funding acquisi- tion. ChristopheBouvet:Investigation, Methodology, Software, Formal analysis, Writing - review & editing. Jean-FrançoisChatelain:Concep- tualization, Supervision, Writing - review & editing, Funding acquisi- tion. YvesBeauchamp: Conceptualization, Supervision, Writing - re- view & editing, Funding acquisition.
Acknowledgments
The authors sincerely thank Mr. Daniel Poirier and his colleagues from CDCQ (Centre de développement des composites du Québec), for molding the composite plates, as well as Serge Plamondon and Claude- Daniel Legault who provided technical assistance that greatly assisted us in this research. This work was supported by the NaturalSciences
andEngineeringResearchCouncilofCanada(NSERC) [grant number
RGPIN-2017-04305].
Dataavailability
The raw/processed data required to reproduce these findings cannot be shared at this time as the data also forms part of an ongoing study.
References
[1] T.G. Yashas Gowda , M.R. Sanjay , K. Subrahmanya Bhat , P. Madhu , P. Senthama- raikannan , B. Yogesha , Polymer matrix-natural fiber composites: an overview, Co- gent Eng. 5 (2018) 1446667 .
[2] M. Fuqua , S. Huo , C. Ulven , Natural fiber reinforced composites, Polym. Rev. 52 (2012) 259–320 .
[3] M. Ramesh , K. Palanikumar , K. Reddy , Plant fibre based bio-composites: sustainable and renewable green materials, Renew. Sustain. Energy Rev. 79 (2017) 558–584 . [4] D.U. Shah , P.J. Schubel , M.J. Clifford , Can flax replace E-glass in structural com-
posites? A small wind turbine blade case study, Compos. B: Eng. 52 (2013) 172–181 .
[5] A. Moudood , A. Rahman , A. Öchsner , M. Islam , G. Francucci , Flax fiber and its com- posites: an overview of water and moisture absorption impact on their performance, J. Reinforc. Plast. Compos. 38 (2018) 323–339 .
[6] L. Yan , N. Chouw , K. Jayaraman , Flax fibre and its composites – a review, Compos. B: Eng. 56 (2014) 296–317 .
[7] S. Goutianos , T. Peijs , The optimisation of flax fibre yarns for the development of high-performance natural fibre composites, Adv. Compos. Lett. 12 (2003) 237–241 . [8] S. Goutianos , T. Peijs , B. Nystrom , M. Skrifvars , Development of flax fibre based textile reinforcements for composite applications, Appl. Compos. Mater. 13 (2006) 199–215 .
[9] H.M. Khanlou , P. Woodfield , J. Summerscales , G. Francucci , B. King , S. Talebian , et al. , Estimation of mechanical property degradation of poly(lactic acid) and flax fibre reinforced poly(lactic acid) bio-composites during thermal processing, Mea- surement 116 (2018) 367–372 .
[10] S. Haldar , M. Herráez , F. Naya , C. González , C.S. Lopes , Relations between intralami- nar micromechanisms and translaminar fracture behavior of unidirectional FRP sup- ported by experimental micromechanics, Compos. B: Eng. 174 (2019) 107000 . [11] M. Hughes , C. Hill , J. Hague , The fracture toughness of bast fibre reinforced
polyester composites Part 1 evaluation and analysis, J. Mater. Sci. 37 (2002) 4669–4676 .
[12] Q. Liu , M. Hughes , The fracture behaviour and toughness of woven flax fibre rein- forced epoxy composites, Compos. A: Appl. Sci. Manuf. 39 (2008) 1644–1652 . [13] B.G. Falzon , P. Apruzzese , Numerical analysis of intralaminar failure mechanisms
in composite structures. Part I: FE implementation, Compos. Struct. 93 (2011) 1039–1046 .
[14] R. El-Hajjar , R. Haj-Ali , Mode-I fracture toughness testing of thick section FRP com- posites using the ESE(T) specimen, Eng. Fract. Mech. 72 (2005) 631–643 . [15] A. Faggiani , B. Falzon , Predicting low-velocity impact damage on a stiffened com-
posite panel, Compos. A: Appl. Sci. Manuf. 41 (2010) 737–749 .
[16] H.A. Israr , S. Rivallant , C. Bouvet , J.J. Barrau , Finite element simulation of 0°/90°CFRP laminated plates subjected to crushing using a free-face-crushing con- cept, Compos. A: Appl. Sci. Manuf. 62 (2014) 16–25 .
[17] S. Jose , R.R. Kumar , M. Jana , G.V. Rao , Intralaminar fracture toughness of a cross– ply laminate and its constituent sub-laminates, Compos. Sci. Technol. 61 (2001) 1115–1122 .
[18] M.J. Laffan , S. Pinho , P. Robinson , A. McMillan , Translaminar fracture toughness testing of composites: a review, Polym. Test. 31 (2012) 481–489 .
[19] R.V. Silva , D. Spinelli , W.W. Bose Filho , S. Claro Neto , G.O. Chierice , J.R. Tarpani , Fracture toughness of natural fibers/castor oil polyurethane composites, Compos. Sci. Technol. 66 (2006) 1328–1335 .
[20] Y. Li , Y-W Mai , L. Ye , Effects of fibre surface treatment on fracture-mechanical prop- erties of sisal-fibre composites, Compos. Interfaces 12 (2005) 141–163 .
[21] A.E. Ismail , S.H. Masran , S. Jamian , K.A. Kamarudin , M.K. Mohd Nor , N.H.M. Nor , et al. , Fracture toughness of woven kenaf fibre reinforced composites, IOP Conf. Ser.: Mater. Sci. Eng. 160 (2016) 012020 .
[22] C. Chizyuka , Effects of hydrothermal ageing on the fracture damage of sisal fibre reinforced polyester composites, Zambian Eng. 46 (2013) 11–19 .
[23] B.M. G , T.N. Vijaykumar , D.B. K N , Jmsse , Optimization of notch parameter on frac- ture toughness of natural fiber reinforced composites using taguchi method, J. Mater. Sci. Surf. Eng. 3 (2015) 244–248 .
[24] K.P. Ashik , R.S. Sharma , N. Raghavendra , Evaluation of tensile, modal and fracture properties of jute/epoxy natural composites with addition of silicon di oxide as filler material, Mater. Today: Proc. 4 (2017) 9586–9591 .
[25] ASTM, Standard Test Method for Translaminar Fracture Toughness of Laminated and Pultruded Polymer Matrix Composite Materials, ASTM International, West Con- shohocken, PA, 2015 .
[26] J. Underwood , M. Kortschot , W. Lloyd , H. Eidinoff, D. Wilson , N. Ashbaugh , Translaminar fracture toughness test methods and results from interlaboratory tests of carbon/epoxy laminates, Fract. Mech. 1256 (1995) 486–508 26th VolumeASTM STP .
[27] R. Piascik , J. Newman , J. Underwood , The extended compact tension specimen, Fatigue Fract. Eng. Mater. Struct. 20 (1997) 559–563 .
[28] S.T. Pinho , P. Robinson , L. Iannucci , Fracture toughness of the tensile and compres- sive fibre failure modes in laminated composites, Compos. Sci. Technol. 66 (2006) 2069–2079 .
[29] L.W.H. Leonard , K.J. Wong , K.O. Low , B.F. Yousif , Fracture behaviour of glass fi- bre-reinforced polyester composite, Proc. Inst. Mech. Eng. L: J. Mater.: Des. Appl. 223 (2009) 83–89 .
[30] G. Catalanotti , P.P. Camanho , J. Xavier , C.G. Dávila , A.T. Marques , Measurement of resistance curves in the longitudinal failure of composites using digital image correlation, Compos. Sci. Technol. 70 (2010) 1986–1993 .
[31] M.J. Laffan , S.T. Pinho , P. Robinson , L. Iannucci , Measurement of the in situ ply fracture toughness associated with mode I fibre tensile failure in FRP. Part I: data reduction, Compos. Sci. Technol. 70 (2010) 606–613 .
[32] M.J. Laffan , S.T. Pinho , P. Robinson , L. Iannucci , Measurement of the in situ ply fracture toughness associated with mode I fibre tensile failure in FRP. Part II: size and lay-up effects, Compos. Sci. Technol. 70 (2010) 614–621 .
[33] H. Liu , B. Falzon , G. Catalanotti , W. Tan , An experimental method to determine the intralaminar fracture toughness of high-strength carbon-fibre reinforced composite aerostructures, Aeronaut. J. 122 (2018) 1352–1370 .
[34] S. Pinho , P. Robinson , L. Iannucci , Developing a four point bend specimen to measure the mode I intralaminar fracture toughness of unidirectional laminated composites, Compos. Sci. Technol. 69 (2009) 1303–1309 .
[35] M.J. Laffan , S.T. Pinho , P. Robinson , A.J. McMillan , Translaminar fracture tough- ness: the critical notch tip radius of 0° plies in CFRP, Compos. Sci. Technol. 72 (2011) 97–102 .
[36] M. Laffan , S. Pinho , P. Robinson , L. Iannucci , Fracture toughness measurement for mode i fibre tensile failure in FRP, in: Proceedings of the International Conference on Composite Materials, 2009 .
[37] R.F. Teixeira , S.T. Pinho , P. Robinson , Thickness-dependence of the translaminar fracture toughness: experimental study using thin-ply composites, Compos. A: Appl. Sci. Manuf. 90 (2016) 33–44 .
[38] M.V. Donadon , B.G. Falzon , L. Iannucci , J.M. Hodgkinson , Intralaminar toughness characterisation of unbalanced hybrid plain weave laminates, Compos. A: Appl. Sci. Manuf. 38 (2007) 1597–1611 .
[39] C. Soutis , P. Curtis , A method for predicting the fracture toughness of CFRP laminates failing by fibre microbuckling, Compos. A: Appl. Sci. Manuf. 31 (2000) 733–740 . [40] R. Gutkin , S.T. Pinho , P. Robinson , P.T. Curtis , On the transition from shear-driven
fibre compressive failure to fibre kinking in notched CFRP laminates under longitu- dinal compression, Compos. Sci. Technol. 70 (2010) 1223–1231 .
[41] S. Dumoulin , H. Louche , O.S. Hopperstad , T. Børvik , Heat sources, energy storage and dissipation in high-strength steels: experiments and modelling, Eur. J. Mech. – A/Solids 29 (2010) 461–474 .
[42] B. Wattrisse , J-M Muracciole , A. Chrysochoos , Thermomechanical effects accom- panying the localized necking of semi-crystalline polymers, Int. J. Therm. Sci. 41 (2002) 422–427 .
[43] M. Naderi , A. Kahirdeh , M.M. Khonsari , Dissipated thermal energy and damage evo- lution of Glass/Epoxy using infrared thermography and acoustic emission, Compos. B: Eng. 43 (2012) 1613–1620 .
[44] T. Lisle , C. Bouvet , M-L Pastor , T. Rouault , P. Margueres , Damage of woven com- posite under tensile and shear stress using infrared thermography and micrographic cuts, J. Mater. Sci. 50 (2015) 6154–6170 .
[45] T. Lisle , C. Bouvet , M.L. Pastor , P. Margueres , R. Prieto Corral , Damage analysis and fracture toughness evaluation in a thin woven composite laminate under static tension using infrared thermography, Compos. A: Appl. Sci. Manuf. 53 (2013) 75–87 . [46] L.B. Freund , JW. Hutchinson , High strain-rate crack growth in rate-dependent plastic
solids, J. Mech. Phys. Solids 33 (1985) 169–191 .
[47] R. Kapoor , S. Nemat-Nasser , Determination of temperature rise during high strain rate deformation, Mech. Mater. 27 (1998) 1–12 .
[48] Z. Li , J. Lambros , Strain rate effects on the thermomechanical behavior of polymers, Int. J. Solids Struct. 38 (2001) 3549–3562 .
[49] T. Lisle , C. Bouvet , N. Hongkarnjanakul , M-L Pastor , S. Rivallant , P. Margueres , Mea- sure of fracture toughness of compressive fiber failure in composite structures using infrared thermography, Compos. Sci. Technol. 112 (2015) 22–33 .
[50] T. Lisle , N. Hongkarnjanakul , C. Bouvet , M-L Pastor , P. Margueres , S. Rivallant , Mea- sure of fracture toughness in composite structures using infrared thermography, in: Proceedings of the ECCM16 – Sixteenth European Conference on Composite Mate- rials, Seville, Spain, 2014 .
[51] N. Hongkarnjanakul , C. Bouvet , S. Rivallant , Validation of low velocity impact mod- elling on different stacking sequences of CFRP laminates and influence of fibre fail- ure, Compos. Struct. 106 (2013) 549–559 .
[52] J.D. Pujols Gonzalez , C. Bouvet , B. Vieille , Translaminar cracking modelling in wo- ven ply composite laminates at high temperature, in: Proceedings of the ECCM19 – Nineteenth European Conference on Composite Materials, Nantes, France, 2020 . [53] F. Hou , S. Hong , Characterization of R-curve behavior of translaminar crack growth
in cross-ply composite laminates using digital image correlation, Eng. Fract. Mech. 117 (2014) 51–70 .
[54] P. Paris , G. Sih , Stress analysis of cracks, in: Fracture Toughness Testing and its Applications Chicago: ASTM-STP 381, 1965, pp. 30–83 .
[55] S.T. Lin , Z. Feng , R.E. Rowlands , Thermoelastic determination of stress intensity factors in orthotropic composites using the J-integral, Eng. Fract. Mech. 56 (1997) 579–592 .
[56] Y. Saadati , G. Lebrun , J.-F. Chatelain , Y. Beauchamp , Experimental investigation of failure mechanisms and evaluation of physical/mechanical properties of unidirec- tional flax–epoxy composites, J. Compos. Mater. (2020) 0021998320902243 . [57] M.W. Hyer , SR. White , Stress Analysis of Fiber-Reinforced Composite Materials,
DEStech Publications, Inc, 2009 .
[58] Y. Saadati , J-F Chatelain , G. Lebrun , Y. Beauchamp , P. Bocher , N. Vanderesse , A study of the interlaminar fracture toughness of unidirectional flax/epoxy composites, J. Compos. Sci. 4 (2020) 66 .
[59] D.K. Rajak , D.D. Pagar , P.L. Menezes , E. Linul , Fiber-reinforced polymer composites: manufacturing, properties, and applications, Polymers 11 (2019) 1667 .
[60] M. Habibi , G. Lebrun , L. Laperrière , Experimental characterization of short flax fiber mat composites: tensile and flexural properties and damage analysis using acoustic emission, J. Mater. Sci. 52 (2017) 6567–6580 .
[61] M. Laffan , S. Pinho , P. Robinson , L. Iannucci , A. McMillan , Measurement of the fracture toughness associated with the longitudinal fibre compressive failure mode of laminated composites, Compos. A: Appl. Sci. Manuf. 43 (2012) 1930–1938 .