Experimental study and numerical reproduction of self-weight
1consolidation behavior of thickened tailings
23
Michaël Demers Bonin
1; Mathieu Nuth, Ph.D.
2; Alexandre Cabral, Ph.D., P.Eng.
2,*; Anne-Marie
4Dagenais, Ph.D., P.Eng.
35 6 ABSTRACT 7
Thickened tailings, defined as mineral wastes that behave as a non-Newtonian fluid, show a small yield stress 8
and release a small amount of water following deposition. Thickening has become an increasingly used option in 9
tailings management. This paper presents a detailed examination of gold mine thickened tailings undergoing self-10
weight consolidation, which is an important mechanism affecting soft soils immediately after deposition. Self-11
weight consolidation was evaluated using a column equipped with water pressure transmitters whereas a slurry 12
consolidometer was employed to obtain the compressibility relationship under low vertical effective stresses. The 13
piecewise-linear model CS2 was used to model the experimental self-weight consolidation test. This model 14
proved very accurate in reproducing the observed behavior. The test results as well as the model results also 15
confirmed the absence of sedimentation in the thickened tailings, which is in agreement with values reported in 16
the literature related to similar materials. 17
18
INTRODUCTION 19
20
The technology of thickened tailings (TT) has gained the attention of the mining industry in the last thirty years, 21
as several mines adopted a TT approach to tailings management (Williams and Ennis 1996; McPhail et al. 2004; 22
Oxenford and Lord 2006; Barbour et al. 1993). Many advantages have been reported since the development of 23
this technology by Robinsky in 1973 (Robinsky 1975), including a reduced amount of water released following 24
deposition, as well as the possibility of stacking tailings with a greater beach angle than non-thickened tailings 25
(Robinsky 1999). However, Fourie (2012) questions whether or not the attributed benefits to TT have in fact been 26
realized. Thickened or not, a key consideration in tailings management is the storage capacity of tailings disposal 27
areas (TDA). This aspect is in fact largely affected by how tailings settle. Understanding the settlement behavior 28
of thickened tailings is paramount to furthering the use of TT technology. 29
30
In this context, extensive research has been undertaken in the recent past to define the most important 31
mechanisms causing settlement in soft deposits such as marine sediments, dredging residues and mine tailings. 32
Mikasa (1965), followed by Gibson et al. (1967), published a theory on large strain consolidation of soft clays. 33
Further studies were published on the issue of large strain consolidation of soft deposits; Imai (1980; 1981), 34
1
Graduate student, Dept. of Civil Engineering, Université de Sherbrooke, 2500, boul. de l'Université,
Sherbrooke, QC, CANADA J1K 2R1
2
Professor, Dept. of Civil Engineering, Université de Sherbrooke, 2500, boul. de l'Université,
Sherbrooke, QC, CANADA J1K 2R1
3
Golder Associés Ltée., 1001 boul. de Maisonneuve O., 7
thFloor, Montreal, QC, CANADA H3A 3C8
*Corresponding author: alexandre.cabral@usherbrooke.ca
Demers Bonin, M., Nuth, M., Dagenais#, A-M. and Cabral, A.R. (2014). Experimental study and numerical
reproduction of self-weight consolidation behavior of thickened tailings. J. Geotechnical and Geoenvironmental
Engineering, ASCE 140(12): 04014068-1 to 10.
Been and Sills (1981), Schiffman et al. (1988) and Tan et al. (1990) made fundamental contributions by including 35
flocculation, sedimentation and self-weight consolidation. These physical mechanisms were found to be the first 36
processes influencing settlement of soft deposits after deposition. 37
38
The removal of process water affects the settlement processes immediately after deposition, insofar as it can 39
inhibit (or at least reduce) the flocculation and sedimentation phases that precede or overlap self-weight 40
consolidation. In other words, depending on the solids content, self-weight consolidation may be the sole 41
mechanism responsible for thickened tailings settlement and dissipation of excess pore water pressure (EPWP) 42
after deposition. 43
44
This paper analyzed self-weight consolidation of TT samples in a unique way by combining slurry deposition in 45
settling columns, consolidation tests in a consolidometer and the use of a numerical model to reproduce the 46
observed results. The evolution of pore water pressure values during the tests performed in the settling columns 47
and the accuracy with which these results were reproduced by the piecewise-linear model CS2 have made it 48
possible to clearly document an important element about the phenomena of self-weight consolidation. This 49
element relates to the fact that the settlement of the tailings-water interface generated by the region undergoing 50
self-weight consolidation affects excess pore water pressures in the region immediately above, which itself is 51
about to undergo self-weight consolidation. 52
53 54 55
REVIEW OF SELF-WEIGHT CONSOLIDATION AND ITS MODELING 56
57
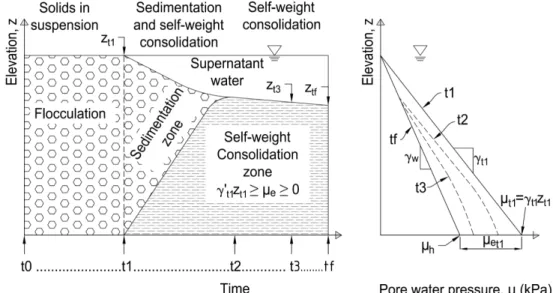
Different behaviors may be observed in soft deposits or hydraulic fills, such as flocculation, sedimentation and 58
self-weight consolidation (Fig.1). Initially, the particles are in suspension in a dense fluid medium. Self-weight 59
consolidation begins as soon as the solid particles build a skeleton whereby soil particles transmit their weight to 60
the bottom (following time t1 in Fig.1) (Been and Sills 1981), while dissipation of EPWP (µe in Fig.1) occurs 61
simultaneously with settlement. The driving mechanism is the dissipation of EPWP, which is caused by the 62
buoyant unit weight of the soil particles. When self-weight consolidation starts, the effective stress builds up and 63
the slurry starts to behave as a soil. Self-weight consolidation is over when the soil stratum is in equilibrium under 64
its own weight (time tf in Fig.1). 65
67
Fig. 1. Sedimentation and self-weight consolidation processes expressed in terms of the settlement-time 68
response (left) (adapted from Imai, 1981) and dissipation of pore water pressure with elevation when self-weight 69
consolidation dominates (right) 70
71
Settling columns are commonly used to evaluate self-weight consolidation of soft deposits. In column tests, the 72
initial void ratio is uniform. In addition, effective stress and self-weight consolidation start simultaneously. Alexis 73
et al. (2004) provide further details on settling column experiments, in which the transition from a settling 74
suspension regime (sedimentation) to a soil formation regime (self-weight consolidation) can be observed. Been 75
and Sills (1981) observed the development of effective stress together with structural density that seemed to 76
indicate the transition from a settling suspension to a soil formation. This transition was also described in terms of 77
critical water content (Imai 1980), of void ratio (Carrier III et al. 1983; Pane and Schiffman 1985; de Oliveira-Filho 78
and van Zyl 2006; Jeeravipoolvarn et al. 2009a; Azam 2011), or in terms of volumetric solid concentration (Li and 79
Williams 1995a; Burger and Concha 1998). Tan (1995) proposed that a significant increase in shear strength 80
marks the transition from a suspension to a soil. In silt-like materials, Oliveira-Filho and van Zyl (2006) proposed 81
that sedimentation starts to be negligible at a void ratio of 2.20 while Bartholomeeusen et al. (2002) studied the 82
self-weight consolidation of silt-like river sediment at initial void ratios between 2.09 and 4.48. 83
84
Several authors attempted to use numerical codes to predict the results of experimental self-weight consolidation 85
tests performed on various types of soils, dredging residues and mine tailings. Been and Sills (1981) used an 86
analytical solution to the Gibson’s finite strain consolidation theory. McVay et al. (1986), Hawlader et al. (2008) 87
and Jeeravipoolvarn et al.(2009b) used a numerical solution of the Gibson’s equation. Berilgen et al. (2006) 88
preferred to use a piecewise-linear model. Townsend and McVay (1990) showed that a numerical solution of the 89
finite strain theory and a piecewise-linear model yielded similar predictions of self-weight consolidation. In turn, 90
the use of analytical solutions to the finite-strain consolidation theory appears too limiting to predict consolidation 91
behavior of soft deposits because of restrictive assumptions that simplify the solution. Nonetheless, they are 92
convenient to validate numerical solutions of finite-strain consolidation of special cases as demonstrated by 93
Morris (2002) and Xie and Leo (2004). 94
The selection of a characteristic 𝑒 − 𝜎𝑣′ relationship is a key factor in modeling self-weight consolidation 96
settlement of soft deposits in settling columns. A major difficulty is measuring low effective stresses occurring 97
during the self-weight consolidation. Been and Sills (1981), Alexis (2004) and Pedroni (2011) overcame this 98
difficulty by measuring the evolution of density using accurate non-destructive apparatuses (X-ray and ɣ-ray). 99
With density and pore water it is possible to evaluate the vertical effective stress within the settling column at any 100
time, thus estimate a 𝑒 − 𝜎𝑣′ relationship (Been and Sills 1981; Sills 1998). Toorman (1999) suggested 101
nonetheless that the measurements of the lower effective stresses, especially in the top 10 cm, may not be 102
reliable due to the imprecision of the density and the pore water pressure measurements. 103
104
MATERIALS AND METHODS 105
106
Materials
107 108
The tailings samples were taken from a gold mine tailings facility (location to remain undisclosed). At their arrival 109
at the Soil Mechanics Laboratory of the Université de Sherbrooke, the tailings within the pails had settled, as 110
evidenced by the presence of supernatant water. The average gravimetric water content (w) of the settled 111
material was approximately 34.7%. The gravimetric water content was about 50.7% after being homogenized 112
with the supernatant water, corresponding to a tailings solids content of 66.4% (mass of dry solids divided by the 113
total mass of solids). For this study, the material was brought to a solids content of 68% (eo=1.3, for a degree of 114
saturation of 100% and specific gravity, Gs of 2.76) by drying and re-homogenizing with distilled water. This is 115
generally considered to be in the range of reported solids content (50% to 70%) for hard rock mine TT (McPhail 116
et al. 2004; Oxenford and Lord 2006; Fourie 2012; Bussière 2007). As confirmed by assessment tests (results 117
not presented herein), the use of distilled water instead of process water did not lead to any significant variation 118
in the EPWP dissipation during self-weight consolidation. The mine tailings studied in this project correspond to 119
a silt-sized material of low plasticity, a classification often reported for gold mine tailings (de Oliveira-Filho and 120
van Zyl 2006; Bussière 2007). Table 1 summarizes the geotechnical characteristics of the studied tailings. In 121
addition, hydraulic conductivities of 4.20x10⁻⁸ m/s, 4.99x10⁻⁸ m/s, 5.66x10⁻⁸ m/s and 6.22x10⁻⁸ m/s for void ratios 122
of 0.61, 0.65, 0.67 and 0.69, respectively, were obtained from falling head permeability tests performed in the 123
oedometer cell. The oedometric consolidation tests (whose results are presented in Fig.6 and discussed later) 124
started at void ratios between 0.88 and 0.89 and were performed according to ASTM D2435-11 in a 101.6-mm 125
interior diameter cell. Compression indexes (Cc) were comprised between 0.052 and 0.070 and the
126
recompression index (Cr) was 0.011. Compression indexes between 0.050 to 0.150, for initial void ratios between
127
0.5 to 1.0, have often been reported (e.g. McPhail et al. 2004; Mittal and Morgenstern 1976; Blight and Steffen 128
1979; Aubertin et al. 1996; Yunxin (Jason) and Sego 2001; Crowder 2004; Fahey et al. 2010) 129 130 131 132 133 134
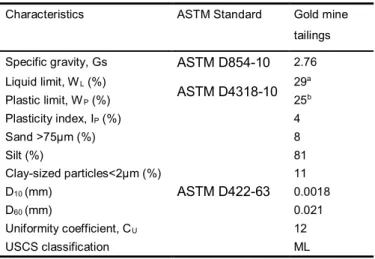
Table 1. Characteristics of the studied gold mine tailings 135
Characteristics ASTM Standard Gold mine
tailings
Specific gravity, Gs ASTM D854-10 2.76
Liquid limit, WL (%) ASTM D4318-10 29a Plastic limit, WP (%) 25b Plasticity index, IP (%) 4 Sand >75µm (%) ASTM D422-63 8 Silt (%) 81 Clay-sized particles<2µm (%) 11 D10 (mm) 0.0018 D60 (mm) 0.021 Uniformity coefficient, CU 12 USCS classification ML
a Determined with the Swedish cone method
136
bBased on one (1) sample
137 138 139
Laboratory equipment and experimental procedure
140 141
Settling column 142
143
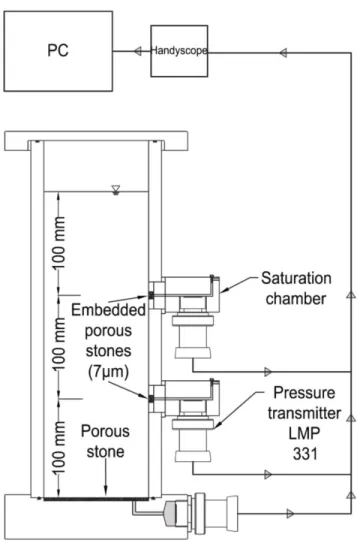
Self-weight consolidation experiments were conducted in a settling column represented in Fig. 2. The settling 144
column is made of clear acrylic with an internal diameter of 101.6 mm. Total pore water pressure was monitored 145
at three elevations (bottom, 0.1 m and 0.2 m) via pressure transmitters (BD|Sensors LMP 331, range of 0 to 10 146
kPa, accuracy of ±0.01 kPa) screwed to the column wall. The saturation chambers helped to establish saturation 147
in the lines between the pressure transmitters and the embedded porous stones. The output signal from the 148
pressure transmitters was monitored with a measuring instrument (Handyscope HS4 by TiePie engineering) 149
coupled with the software Tie-Pie Multi Channel (TiePie engineering). The transmitters are excited by a 20 V 150
external power supply. It was assumed that the column wall friction was negligible due to the use of a column 151
diameter greater than 100 mm (Elder 1985; Migniot 1989; Sills 1997). Since the phenomenon of self-weight 152
consolidation was primarily studied in terms of EPWP dissipation, no actual direct density measurement was 153
performed in this study. As detailed later, the void ratio/vertical effective stress and the hydraulic conductivity/void 154
ratio relationships were not obtained directly from the settling column experiments. 155
156
Once the porous stones had been saturated, the column was emptied and each transducer reading was set to 157
zero on the data logging system. Tailings were then poured to a height of 300 mm, and the sample was 158
homogenized to reach a uniform void ratio distribution. Total pore water pressure (µ) data started being recorded 159
after the mixer was removed from the sample. Water expelled from tailings during self-weight consolidation 160
formed a supernatant layer in the column. After completion of self-weight consolidation (i.e. once EPWP had 161
been completely dissipated), the tailings height was recorded, the supernatant water was weighted and samples 162
were taken at the top and bottom of the column for water content determination. Void ratios were calculated from 163
water content measurements, and by assuming complete saturation. EPWP (µe) was calculated by subtracting
164
the hydrostatic pressure (µh) from the total pore water pressure.
166
Fig. 2. 300-mm-high settling column 167
168
Consolidometer 169
170
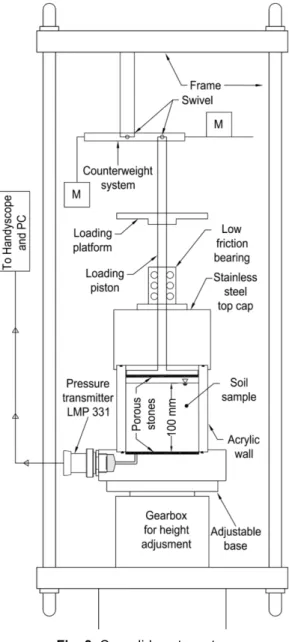
The consolidometer shown in Fig.3 was used for self-weight and primary consolidation. The apparatus is similar 171
to slurry consolidometers used elsewhere to obtain a 𝑒 − 𝜎𝑣′ relationships for samples submitted to large strains 172
(Yunxin (Jason) and Sego 2001; Bromwell and Carrier 1979; Wong et al. 2008). It consists of a 100-mm-high 173
acrylic column equipped with a water pressure transmitter installed at the base. A counterweight-swivel system 174
was developed to support the mass of the loading piston. Since the latter does not apply any additional stress to 175
the sample, initial low stress increments can be applied. 176
177
For the self-weight consolidation phase, the testing procedure is the same as in the 300-mm-high settling 178
column. Once the sample had consolidated under its own weight, the height of the sample and the thickness of 179
supernatant water were recorded. The loading piston was then gently lowered until it came into contact with the 180
tailings surface. Loadings corresponding to stresses (Δσ) of 0.06, 0.12, 0.3, 0.61, 1.1, 2.2, 4.4 and 8.8 kPa were 181
applied to the tailings surface. The strain was recorded before applying a new load. The dry mass of solids was 182
measured at the end of the experiment. An average void ratio throughout the column was calculated using the 183
height of the sample and the height of solids (𝐻 − 𝐻𝑠)/𝐻𝑠. The vertical effective stress was considered to be 184
equal to the load increment stress (𝛥𝜎 = 𝜎’) since the self-weight stress of the sample and the hydrostatic 185
pressure were neglected as is often reported in the technical literature (e.g. Bromwell and Carrier 1979; 186
Yunxin(Jason) and Sego 2001; Wong et al. 2008). 187
188
Demers Bonin et al. (2013) reported the dissipation of EPWP with time during self-weight consolidation of TT 189
samples (𝑒𝑜= 1.3) with initial heights of 100 mm and 300 mm. These results showed that the trend of dissipation 190
of EPWP measured at the bottom of samples of both heights was nearly the same. Subsequently, the 𝑒 − 𝜎𝑣′ 191
relationship obtained from the consolidometer is assumed to represent the compressibility behavior of the 300-192
mm-high TT samples at low effective stresses. Complementary data were obtained from standard consolidation 193
tests carried out with a 4 inch oedometer cell placed in a conventional oedometric apparatus, using dead-weight 194
loading. 195
196
Fig. 3. Consolidometer setup 197
198
THE CS2 NUMERICAL MODEL 199
200
The CS2 numerical model (Fox and Berles 1997) was used to reproduce the behavior of the fine-grained tailings 201
during self-weight consolidation. CS2 was developed to predict large-strain consolidation and is based on a one-202
dimensional piecewise-linear finite difference model. The initial geometry is discretized in vertical elements that 203
have constant properties during each time increment. The number of vertical elements (Rj) defined by the user
204
affects the accuracy of the results. CS2 accounts for large strain, self-weight effects, relative velocity of fluid and 205
solid phases and non-linearity of hydraulic conductivity and compressibility. The code was implemented in Matlab 206
and its capability was verified with the four verification problems presented by Fox and Berles (1997). The input 207
includes two constitutive relationships in the form of discrete point functions. One function represents 208
compressibility as an effective stress-dependent function and the other represents hydraulic conductivities as a 209
void ratio-dependent function. Additional inputs needed for a CS2 simulation are: specific gravity, water head at 210
bottom and at the top, the duration of the analysis and the initial effective stress associated with the initial void 211
ratio (eo). CS2 does not account for sedimentation of solid particles (Fox 2000).
212 213
A third time step criterion was added to the code to ensure numerical stability. It was observed that self-weight 214
effects were responsible for high hydraulic gradients in the very beginning of the simulation near the bottom of 215
the column. By implementing the time step criteria provided by Fox (2000), the code ensures that the change in 216
element height for any time step is no greater than 0.5%. Moreover, the code was modified to consider a uniform 217
void ratio distribution in the beginning of self-weight consolidation. The user specifies the initial void ratio and 218
CS2 refers to the compressibility constitutive relationship to find the initial effective stress. In theory, the effective 219
stress equals zero in the beginning of self-weight consolidation but a value different from zero is required to run 220
CS2. 221
222
RESULTS AND DISCUSSION 223
224
Self-weight consolidation: settling column
225 226
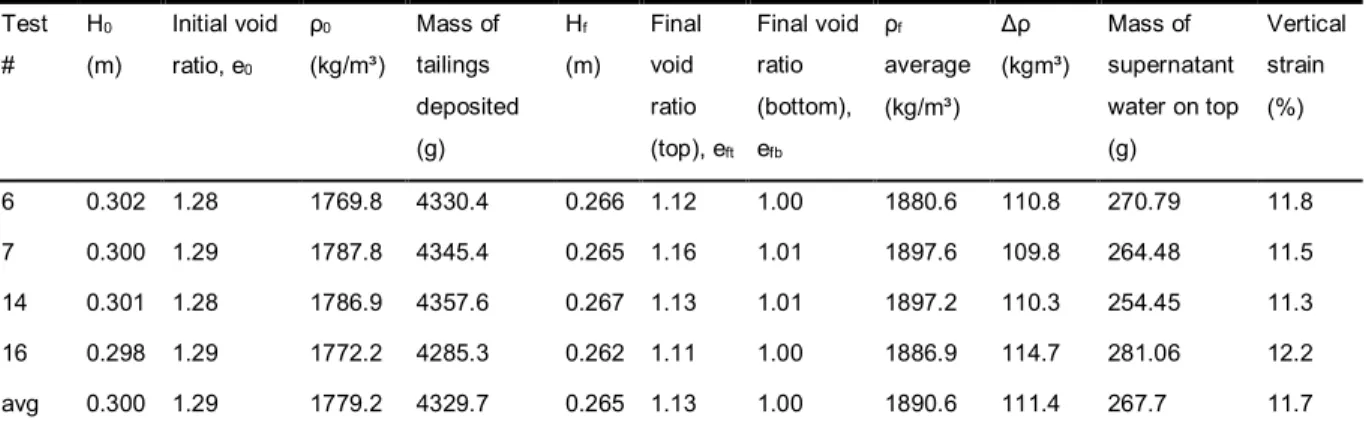
From a total of 16 tests performed in the 300-mm-high settling column, 4 had the same initial conditions (see 227
Table 2). At the end of self-weight consolidation, there was a supernatant water layer at the top of the column, 228
resulting from an average vertical strain of 11.7% and an average increase in density (ρf -ρ0) of 111 kg/m³. The
229
initial void ratios (𝑒𝑜) were nearly equal for the four tests, while at the end of the self-weight consolidation, the 230
bottom of the column was denser. Final void ratio values ranged between 1.11 and 1.16 at the top (eft) and 231
between 1.00 and 1.01 at the bottom (efb). The greater density at the bottom of the column is caused by the 232
increasing weight of slurry with depth. 233
234
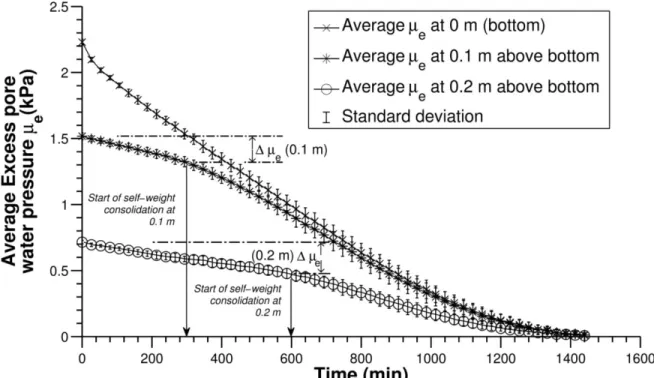
Fig. 4 presents the evolution of average dissipation of EPWP with time and the corresponding standard 235
deviations. The greatest standard deviations for the four tests are noticeable between 500 and 1100 min, i.e. 236
approximately halfway through the self-weight consolidation process. The intercepts with the y-axis in Fig. 4 are 237
2.24 kPa (at the bottom), 1.52 kPa (0.1 m above bottom) and 0.72 kPa (0.2 m above bottom). From the average 238
initial density (ρ0) and the mean initial height (H0), the theoretical intercepts with the y-axis are respectively, 2.29
kPa, 1.53 kPa and 0.76 kPa. Dissipation of EPWP at the base (0 m) began immediately after homogenization of 240
the sample in the column, while dissipation of EPWP at 0.1 m and 0.2 was slower (dissipation curves are 241
smoother). The results in Fig. 4 indicate that self-weight consolidation started at approximately 300 min at an 242
elevation of 0.1 m above the bottom, and at 600 min at 0.2 m above the bottom. Before self-weight consolidation 243
reached 0.1 m and then 0.2 m, there was still a slow decrease in EPWP. Apparently, this slow dissipation was 244
caused by weight consolidation at the bottom. Indeed, the tailings-water interface moving down by self-245
weight consolidation generated a decrease in the height of solids, which, in turn, reduced the excess pore water 246
pressure (µe) at 0.1 m and 0.2 m (µe=ɣ’H). Theoretically, the part of the column undergoing self-weight
247
consolidation causes a change in the void ratio distribution, while the part of the column that has not begun self-248
weight consolidation remains at its initial void ratio. Consequently, in the present case, the EPWP in the 249
uppermost part that had not begun to consolidate was affected by the tailings-water interface settlement (H is 250
decreasing), while the buoyant unit weight (ɣ’) remained constant. Self-weight consolidation was complete after 251
1440 minutes (24 hours) for all 4 tests. 252
253
Table 2. Summary of self-weight consolidation tests in the 300-mm-high settling column 254
255
256
Variations above and below the average dissipation curves in Fig. 4 were possibly due to slight differences in 257
initial experimental conditions, such as initial height or initial water content or slight variations in grain size or 258
mineralogy. Those may have influenced dissipation of EPWP since they can affect the hydraulic conductivity or 259
the specific gravity of the samples. 260
261
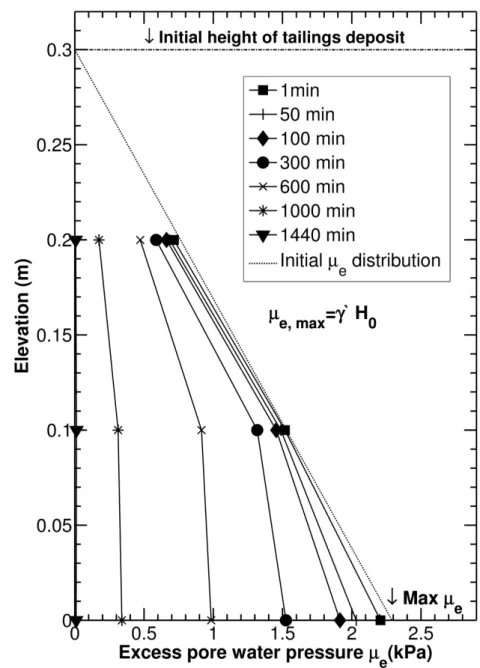
Fig. 5 presents the elevation versus average EPWP at the same elevations (bottom, 0.1 m and 0.2 m). The 262
theoretical maximum EPWP developed in the beginning of self-weight consolidation (2.29 kPa) is represented by 263
an arrow and was calculated using the mean initial density (ρ0) and the mean initial height, both presented in 264
Table 2. This estimated value is quite close to the highest average EPWP at 0 m (~ 2.24 kPa shown in Fig. 4). 265
At the very beginning of the test (1-minute reading), dissipation of EPWP was only observed at the bottom. As 266
the test progressed, dissipation of EPWP moved from the initial triangular EPWP distribution, particularly near 267
the bottom of the sample. As long as the self-weight consolidation had not reached a specific elevation, 268
dissipation curves above this elevation were nearly parallel to the initial EPWP distribution curve. This typical 269
pattern is associated with self-weight consolidation in settling columns with an impervious base, and shows that 270
the process started from the bottom up (Sills 1997; Masutti 2001). For instance, the 600-minute profile shows 271 Test # H0 (m) Initial void ratio, e0 ρ0 (kg/m³) Mass of tailings deposited (g) Hf (m) Final void ratio (top), eft Final void ratio (bottom), efb ρf average (kg/m³) Δρ (kgm³) Mass of supernatant water on top (g) Vertical strain (%) 6 0.302 1.28 1769.8 4330.4 0.266 1.12 1.00 1880.6 110.8 270.79 11.8 7 0.300 1.29 1787.8 4345.4 0.265 1.16 1.01 1897.6 109.8 264.48 11.5 14 0.301 1.28 1786.9 4357.6 0.267 1.13 1.01 1897.2 110.3 254.45 11.3 16 0.298 1.29 1772.2 4285.3 0.262 1.11 1.00 1886.9 114.7 281.06 12.2 avg 0.300 1.29 1779.2 4329.7 0.265 1.13 1.00 1890.6 111.4 267.7 11.7
that the process of self-weight consolidation already reached 0.2 m because the profile comprised between 0.1 272
m and 0.2 m followed a steeper slope than the initial distribution. 273
274
275
Fig. 4. Evolution of average dissipation of excess pore water pressure with time and standard deviations for the 276
four tests performed in the 300-mm-high settling column 277
279 280
Fig. 5. Elevation versus average excess pore water pressure for the four tests performed in the 300-mm-high 281
settling column 282
283
Self-weight and primary consolidation: Consolidometer and oedometer tests
284 285
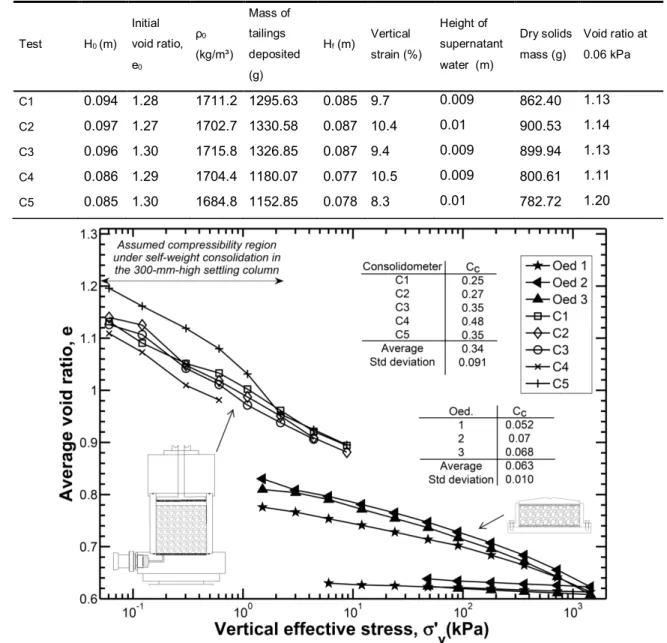
Five tests were performed using the consolidometer to evaluate the 𝑒 − 𝜎𝑣′ relationship under a low effective 286
stress range. Table 3 presents a summary of the main characteristics of samples C1 to C5. In the beginning of 287
each test the samples had a similar height (H0), therefore the same water pressure conditions. The initial void
288
ratios (eo) of the 5 experiments were approximately 1.3, while initial densities (ρ0) were similar to those of the
289
settling column experiments. 290
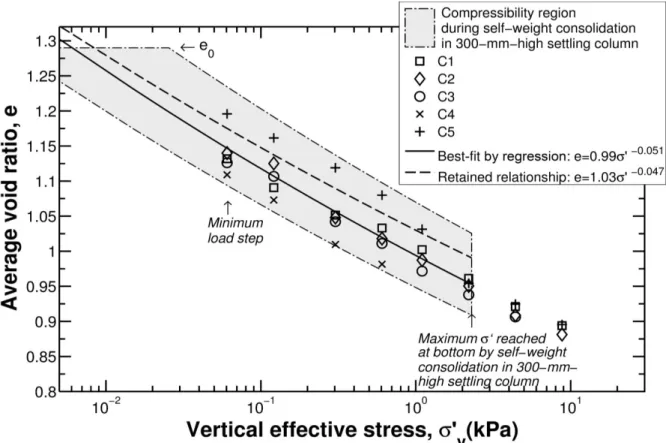
Fig. 6 presents the average void ratio versus vertical effective stress obtained in the consolidometer (lower stress 292
range) and in the oedometric apparatus (higher stress range). The load range of the consolidometer was 293
comprised between 0.06 kPa and 8.80 kPa. The results followed a rather similar trend for all tests, albeit a slight 294
scatter in void ratios, which nonetheless decreased with the increase in vertical effective stress. A similar trend 295
was obtained by Liu and Znidarcic (1991). As in the majority of soft soils such as TT, the 𝑒 − 𝜎𝑣′ relationship at 296
low effective stresses is greatly dependent on the initial void ratio and is not unique (Imai 1981; Been and Sills 297
1981; Liu and Znidarcic 1991). The consolidation behavior for loads greater than 8.80 kPa was obtained using 298
the oedometer cell. The primary consolidation in the consolidometer experiments started at initial void ratios 299
varying between 1.11 and 1.19, while the initial void ratios in the oedometer varied between 0.78 and 0.83. 300
Sample preparation, mainly compaction, induced stiffening of the material, thus lower void ratios. Hence, the 301
compression indexes (Cc) at lower effective stresses were higher than those determined using the oedometer. 302
303
Fig.6 shows more scattering in the results from the consolidometer than those from the oedometer tests and 304
there is one order of magnitude between the standard deviations obtained in the two types of tests. The slight 305
variation in Cc observed in the 5 tests performed in the consolidometer possibly relates to the accuracy of the 306
adopted experimental method. Moreover, the void ratio during self-weight consolidation was non-uniform over 307
the entire depth. As reported by Liu (1990), the use of an average value over the whole sample (as was the case 308
with the oedometer tests) can raise concerns. To overcome these limitations, other apparatus or methods might 309
be recommended to obtain the 𝑒 − 𝜎𝑣′ relationship at low effective stresses; i.e. the hydraulic consolidation test 310
(Imai 1979; Abu-Hejleh et al. 1996; Fox and Baxter 1997) or actual density measurements with non-destructive 311
readings using x-ray or ɣ-ray, during self-weight consolidation (Been and Sills 1981; Alexis et al. 2004; 312
Bartholomeeusen et al. 2002; Pedroni 2011; Masutti 2001; Tan et al. 1988). 313
314
Fig 7. shows that a compressibility relationship (𝑒 − 𝜎𝑣′) for low vertical effective stresses was found from the 315
consolidometer results. The latter is comprised between the estimated vertical effective stress at a void ratio of 316
1.3 and the theoretical vertical effective stress reached in the 300-mm-high settling column. The 𝑒 − 𝜎𝑣′ 317
relationship was estimated by means of a power law of the form 𝑒 = 𝐴𝜎’𝐵. (Carrier III et al. 1983; McVay et al. 318
1986; Somogyi 1980; Huerta and Rodriguez 1992; Stone et al. 1994; Aydilek et al. 2000). The power law was 319
fitted by regression analysis using the average void ratio at each stress. This best-fit was used as a first attempt 320
to reproduce the self-weight consolidation behavior in a CS2 simulation. 321 322 323 324 325 326 327 328 329 330 331 332
333
Table 3. Summary of the five experiments in the consolidometer setup 334 Test H0 (m) Initial void ratio, e0 ρ0 (kg/m³) Mass of tailings deposited (g) Hf (m) Vertical strain (%) Height of supernatant water (m) Dry solids mass (g) Void ratio at 0.06 kPa C1 0.094 1.28 1711.2 1295.63 0.085 9.7 0.009 862.40 1.13 C2 0.097 1.27 1702.7 1330.58 0.087 10.4 0.01 900.53 1.14 C3 0.096 1.30 1715.8 1326.85 0.087 9.4 0.009 899.94 1.13 C4 0.086 1.29 1704.4 1180.07 0.077 10.5 0.009 800.61 1.11 C5 0.085 1.30 1684.8 1152.85 0.078 8.3 0.01 782.72 1.20 335
Fig. 6. Compressibility (average void ratio versus vertical effective stress) of experiments in consolidometer 336
setup and oedometer cell 337
339
Fig. 7. Compressibility (average void ratio versus vertical effective stress) from the five experiments in the 340
consolidometer setup 341
342
REPRODUCTION OF EXPERIMENTAL SELF-WEIGHT CONSOLIDATION 343
344
In addition to the best-fit compressibility relationship obtained in Fig. 7, a hydraulic conductivity versus void ratio 345
relationship was obtained from falling head permeability tests performed in the oedometer cell. To prevent 346
seepage-induced consolidation in the oedometer cell, hydraulic conductivity measurements were not performed 347
at void ratios greater than e=0.7. Best-fit regression of the experimental results by means of a power law (𝑘 = 348
𝐶𝑒𝐷) is generally reported to represent the k-e relationship for soft soils (Jeeravipoolvarn et al. 2009a; Pane and 349
Schiffman 1997; Gjerapic and Znidarcic 2007). Thus, the following hydraulic conductivity relationship was 350
estimated from a best-fit regression analysis: (𝑘(𝑚 𝑠⁄ ) = 2.1 × 10⁻⁷𝑒3.29). 351
352
Both best-fit relationships obtained by regression analysis (𝑒 − 𝜎𝑣′ and 𝑘 − 𝑒) were used in the first CS2 353
simulation (results not shown herein), which showed that in terms of mechanical response (total settlement and 354
final void ratio distribution), CS2 accurately reproduced the experimental results. However, the reproduction 355
overestimated the time of dissipation of EPWP. Subsequently, the constitutive parameters (A, B, C and D) were 356
optimized to determine the relationships giving the best reproduction of the experimental EPWP response, the 357
tailings-water interface settlement and the final void ratio distribution. 358
359
Suthaker and Scott (1994) and Bharat and Sharma (2011) noted that parameters A and B seem to have little 360
influence on the tailings-water interface response, but their influence on the final void ratio distribution is 361
important. On the other hand, parameter D considerably affects both the settlement response and final void ratio 362
distribution. Suthaker and Scott (1994) also reported that the change in the compressibility characteristics (A and 363
B) does not affect the short-term prediction of EPWP while the long-term prediction is slightly affected. They also 364
reported that the variation of parameter D has considerable effects on the EPWP response. 365
366
The parameters retained from this optimization process including the constitutive relationships are presented in 367
Table 4 and in Fig.7. Both constitutive relationships used 51 discrete data points. The self-weight consolidation 368
was modeled with a 0.3 m high sample subdivided in 50 vertical elements (Rj=50). An initial vertical effective
369
stress (qo) of 0.0083 kPa and an initial hydraulic conductivity (kqo) of 8.11x10⁻⁷ m/s were derived from the
370
retained constitutive relationships for the homogeneous initial void ratio of 1.29. The top boundary was 371
considered as drained while the bottom boundary was considered undrained. The water was maintained at a 372
constant elevation, which was equal to the initial height (0.3 m). 373
374
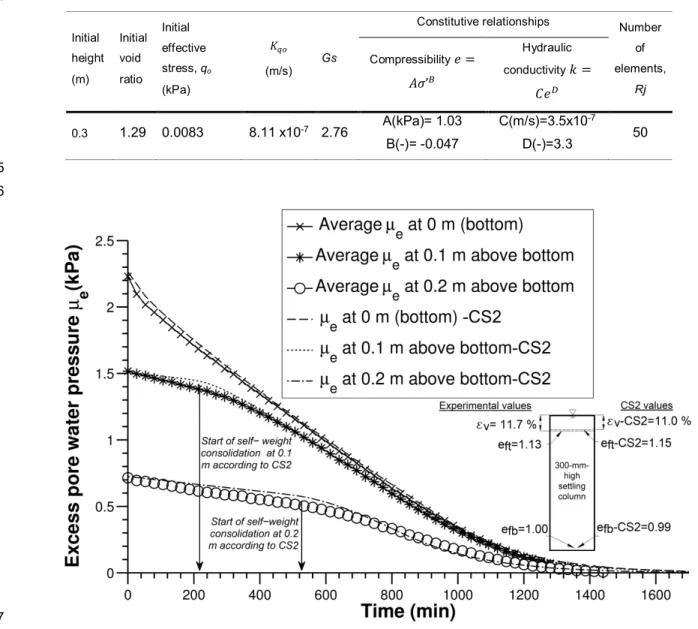
Fig.8 presents the evolution of EPWP with time at the three elevations corresponding to the positions of the 375
pressure transmitters. CS2 accurately reproduces the immediate startup of the EPWP dissipation at the bottom. 376
At 0.1 m and 0.2 m above bottom, CS2 quite accurately reproduces the pseudo-linear decrease in EPWP before 377
the start of the self-weight consolidation (change in slope). For instance, at 0.2 m, CS2 predicts the start of the 378
self-weight consolidation after approximately 540 min. The slope of the pseudo-linear portions of the 379
experimental curves is slightly steeper, which may be attributed to several factors: superficial sedimentation, non-380
unique experimental compressibility relationship (Been and Sills 1981; Hawlader et al. 2008) or discrepancy 381
between constitutive relationships and the self-weight consolidation behavior. The end of self-weight 382
consolidation at 1440 min is also closely reproduced by CS2. Beside the pore water pressure response, Fig.8 383
also shows the mechanical response of CS2 at the end of the simulation. CS2 reproduces a void ratio of 1.15 at 384
the top of the column and 0.99 at the bottom while the tailings-water interfaces underwent a vertical strain of 385
11.0%. All those values are nearly the same as the experimental values from the 300-mm-high settling column. 386
387
The reproduction of the experimental results proved to be successful as confirmed by the evolution of the EPWP 388
with elevation (Fig.9). The theoretical experimental maximum EPWP is indicated by an arrow (𝑀𝑎𝑥 µ𝑒= 389
2.29 𝑘𝑃𝑎). The EPWP profiles are calculated by CS2 using the density, pore water pressure conditions and 390
elevation at each element of the discretized geometry. The 1-minute profile determined by CS2 indicates that the 391
model had not begun to consolidate under its own weight at this time as the calculated EPWP is 2.24 kPa at 0 m 392
(the experimental value was 2.21 kPa) and the EPWP profile was linear throughout the column. The reproduced 393
intercept with the y-axis after 1 min is 0.3 m, which was the average initial height of the samples. From 50 394
minutes on, the curved ends of the EPWP profiles indicated the portion of the column that had begun to 395
consolidate under its own weight. Based on the profiles determined by CS2, self-weight consolidation had been 396
initiated for a height of approximately 0.06 m at 100 min and after 300 min, it had reached 0.12 m above the 397
bottom. Moreover, the intercept with the y-axis went down as the tailings-water interface settled due to self-398
weight consolidation at lower depths. It is also worth noting that CS2 has the capacity to reflect the fact that 399
dissipation of EPWP by self-weight consolidation at the bottom affects the EPWP at the top as observed by 400
experimental results. 401
402
Table 4. Input parameters used in CS2 403
404
405 406
407
Fig. 8. Evolution of average dissipation of EPWP with time in the 300-mm-high column: experimental results and 408 values reproduced by CS2 409 410 Initial height (m) Initial void ratio Initial effective stress, qo (kPa) 𝐾𝑞𝑜 (m/s) Gs
Constitutive relationships Number
of elements, Rj Compressibility 𝑒 = 𝐴𝜎’𝐵 Hydraulic conductivity 𝑘 = 𝐶𝑒𝐷 0.3 1.29 0.0083 8.11 x10⁻⁷ 2.76 A(kPa)= 1.03 B(-)= -0.047 C(m/s)=3.5x10-7 D(-)=3.3 50
411
Fig. 9. Profile of elevation versus EPWP in the 300-mm-high settling column: experimental results and values 412 reproduced by CS2 413 414 Discussion 415 416
In the context of this study, a TT sample deposited to 68% of solids would undergo mainly self-weight 417
consolidation. This initial void ratio is well below the critical void ratios reported by de Oliveira-Filho and van Zyl 418
(2006), Bartholomeeusen et al. (2002) for silty materials. The sedimentation phase seems to be inhibited by the 419
proximity of solid particles that can rapidly transmit their own weight to a soil structure supported at the bottom of 420
the column and dissipate EPWP. The main EPWP decrease occurs by self-weight consolidation from the bottom 421
and proceeds upward while a minor EPWP diminution is observed in the uppermost part of the column. The CS2 422
simulations support that this minor dissipation seems to result mainly from settlement of the slurry height caused 423
by self-weight consolidation and not because of potential sedimentation. 424
425
CS2 proved quite capable of reproducing the behavior of thickened tailings under self-weight consolidation, be it 426
the EPWP dissipation, the final settlement or the final void ratio distribution. This tends to confirm that the sole 427
mechanism (or the main one) influencing settlement of TT initially deposited at 68% solids is probably self-weight 428
consolidation. It is believed that CS2 would not have adequately reproduced the experimental behavior of the 429
same material deposited at an initial void ratio higher than its critical void ratio. In fact, the prediction of the 430
sedimentation combined with self-weight consolidation should lead to different profiles of EPWP as shown by 431
Concha and Bürger (1998). Li and Williams (1995b), Sills (1998) and Masutti (2001) presented such 432
experimental EPWP profiles of soils deposited below their structural density. 433
The reproduction of the self-weight consolidation behavior in the 300-mm-high settling column proved to be 435
reliable in using the one-dimensional model CS2 and the retained constitutive relationships. The transposition of 436
this model to a larger scale should be conducted with caution given the nature of the constitutive relationships, 437
which might not represent the behavior at higher effective stresses (Carrier III et al. 1983) and the one-438 dimensional formulation. 439 440 441 CONCLUSION 442 443
A 300-mm-high settling column was used to assess the self-weight consolidation behavior of TT. An accurate 444
monitoring of total pore water pressure showed that self-weight consolidation finishes after 24 hours at 68% 445
solids and confirmed that the mechanism moves from the bottom up. A consolidometer was used to establish an 446
initial estimate of the 𝑒 − 𝜎𝑣′ relationship at low effective stresses. The CS2 numerical model was used to 447
calibrate the 𝑒 − 𝜎𝑣′ and the 𝑘 − 𝑒 relationships in order to reproduce the self-weight consolidation from the 300-448
mm-high settling column. Slight differences were observed between the calibrated and the experimental best-fit 449
relationships. 450
451
Analysis carried out with CS2 by using calibrated constitutive relationships highlighted the capabilities of this 452
model to accurately reproduce the self-weight consolidation of TT be it the dissipation of EPWP or the 453
mechanical response. Moreover, the experimental study coupled with the numerical reproduction have confirmed 454
that sedimentation can be neglected when tailings are thickened to 68% solids. CS2 confirms the characteristics 455
of a typical profile of EPWP dissipation when self-weight consolidation is the sole mechanism at the very moment 456
of the deposition. 457
458
Identifying the main mechanisms behind the settlement of TT is an advance for the mining industry as it enlarges 459
the knowledge related to TT. A better understanding of self-weight consolidation helps to identify processes 460
involved in TT settlement. This information is relevant to estimate the storage capacity of TDA, to evaluate the 461
freeboard of confining structures and to analyze the density distribution throughout the tailings deposit. 462
463 464
ACKNOWLEDGEMENTS 465
The authors would like to thank geotechnical technicians Jean-Guy Lemelin and Valérie Dumoulin for their 466
technical support. Funding for this research has been provided by the National Sciences and Engineering 467
Research Council (NSERC), the Fond Québécois pour la Recherche Nature et Technologies (FQRNT) and 468
Golder Associés Ltée. through a BMP-Innovation Scholarship. 469 470 471 472 473 474 475
REFERENCES
Abu-Hejleh, A., Znidarčić, D., and Barnes, B. (1996). "Consolidation Characteristics of Phosphatic Clays." J.Geotech.Eng., 122(4), 295-301.
Alexis, A., Le bras, G., and Thomas, P. (2004). "Experimental bench for study of settling-consolidation soil formation." Geotech Test J, 27(6), 557-567. Aubertin, M., Bussière, B., and P.Chapuis, R. (1996). "Hydraulic conductivity of homogenized tailings from hard rock mines." Canadian Geotechnical Journal, 33(3), 470-482.
Aydilek, A. H., Edil, T. B., and Fox, P. J. (2000). "Consolidation characteristics of wastewater sludge." Geotechnics of High Water Content Materials, January 28, 1999 - January 29, ASTM, Memphis, TN, USA, 309-323.
Azam, S. (2011). "Large strain settling behavior of polymer-amended laterite slurries." International Journal of Geomechanics, 11(2), 105-112. Barbour, S. L., Wilson, G. W., Salvas, R. J., St Arnaud, L., and Bordin, D. (1993). "Aspects of environmental protection provided by thickened tailings disposal." Proceedings of the International Congress on Mine Design, A.A. Balkema, Kingston, Ont, Canada, 725-725.
Bartholomeeusen, G., Sills, G. C., Znidarcic, D., Van Kesteren, W., Merckelbach, L. M., Pyke, R., Carrier, W. D., Lin, H., Penumadu, D., Winterwerp, H., Masala, S., and Chan, D. (2002). "Sidere: Numerical prediction of large-strain consolidation."
Geotechnique, 52(9), 639-648.
Been, k., and Sills, G. C. (1981). "Self-weight consolidation of soft soils: an experimental and theoretical study." Géotechnique, 31(4), 519-535.
Berilgen, S. A., Berilgen, M. M., Ozaydin, K. I., and Bicer, P. (2006). "Assessment of consolidation behavior of golden horn marine dredged material." Marine Georesources and Geotechnology, 24(1), 1-16.
Bharat, T. V., and Sharma, J. (2011). "Prediction of compression and permeability characteristics of mine tailings using natural computation and large-strain consolidation framework." Geo-Frontiers 2011: Advances in Geotechnical Engineering, March 13, 2011 - March 16, American Society of Civil Engineers (ASCE), Dallas, TX, United states, 3868-3877. Blight, G. E., and Steffen, O. K. H. (1979). "Geotechnics of gold mining waste disposal."
Proceedings of Current Geotechnical Practice in Mine Waste Disposal, American Society of Civil
Engineering, New York, 1-52.
Bromwell, L. G., and Carrier, W. D. (1979). "Consolidation of fine-grained mining wastes." Proceedings of the sixth Pan-American conference on soil mechanics and foundation engineering, Lima, Peru, 293-304.
Burger, R., and Concha, F. (1998). "Mathematical model and numerical simulation of the settling of flocculated suspensions." Int.J.Multiphase Flow, 24(6), 1005-23.
Bussière, B. (2007). "Colloquium 2004:
Hydrogeotechnical properties of hard rock tailings from metal mines and emerging geoenvironmental disposal approaches." Canadian Geotechnical Journal, 44(9), 1019-1052.
Carrier III, W. D., Bromwell, L. G., and Somogyi, F. (1983). "Design capacity of slurried mineral waste ponds." J.Geotech.Eng., 109(5), 699-716.
Crowder, J. J. (2004). "Deposition, consolidation, and strength of a non-plastic tailings paste for surface disposal". Ph.D. University of Toronto (Canada), Canada.
de Oliveira-Filho, W. L., and van Zyl, D. (2006). "Modeling discharge of interstitial water from tailings following deposition. Part 2: Application." Solos e Rochas, 29(2), 211-221.
Demers Bonin, M., Nuth, M., Cabral, A., and Dagenais, A. -M. (2013). "Self-weight consolidation behavior of thickened gold tailings." GeoMontreal 2013, Montréal, 1-7.
Elder, D. M. (1985). "Stress-Strain and strength behaviour of very soft soil sediment". DPhil thesis. University of Oxford, UK.
Fahey, M., Helinski, M., and Fourie, A. (2010). "Consolidation in accreting sediments: Gibson's solution applied to backfilling of mine stopes." Geotechnique, 60(11), 877-882.
Fourie, A. (2012). "Paste and thickened tailings: has the promise been fulfilled?" 4126-4135.
Fox, P. J., and Baxter, C. D. P. (1997). "Consolidation properties of soil slurries from hydraulic consolidation test." J.Geotech.Geoenviron.Eng., 123(8), 770-776. Fox, P. J., and Berles, J. D. (1997). "CS2: a
piecewise-linear model for large strain consolidation." Int.J.Numer.Anal.Methods Geomech., 21(7), 453-475. Fox, P. J. (2000). "CS4: A large strain consolidation model for accreting soil layers." Geotechnics of High Water Content Materials, January 28, 1999 - January 29, ASTM, Memphis, TN, USA, 29-47.
Gibson, R. E., England, G. L., and Hussey, M. J. L. (1967). "Theory of one-dimensional consolidation of saturated clays -- 1." Geotechnique, 17(3), 261-273.
Gjerapic, G., and Znidarcic, D. (2007). "A mass-conservative numerical solution for finite-strain consolidation during continuous soil deposition." Geotech Spec Publ, (157).
Hawlader, B. C., Muhunthan, B., and Imai, G. (2008). "State-dependent constitutive model and numerical solution of self-weight consolidation." Geotechnique, 58(2), 133-141.
Huerta, A., and Rodriguez, A. (1992). "Numerical analysis of non-linear large-strain consolidation and filling." Computers and Structures, 44(1-2), 357-365. Imai, G. (1981). "Experimental studies on
sedimentation mechanism and sediment formation of clay materials." Soils and Foundations, 21(1), 7-20. Imai, G. (1980). "Settling behaviour of clay
suspension." Soils and Foundations, 20(2), 61-77. Imai, G. (1979). "Development of a new consolidation test procedure using seepage force." Soils and Foundations, 19(3), 45-60.
Jeeravipoolvarn, S., Chalaturnyk, R. J., and Scott, J. D. (2009a). "Sedimentation-consolidation modeling with an interaction coefficient." Comput.Geotech., 36(5), 751-61.
Jeeravipoolvarn, S., Scott, J. D., and Chalaturnyk, R. J. (2009b). "10 m standpipe tests on oil sands tailings: Longterm experimental results and prediction." Canadian Geotechnical Journal, 46(8), 875-888. Li, H., and Williams, D. J. (1995a). "Numerical modelling of combined sedimentation and self-weight consolidation of an accreting coal mine tailings slurry." Part 1 (of 2), Hiroshima, Japan, 441-446.
Li, H., and Williams, D. J. (1995b). "Sedimentation and self-weight consolidation behaviour of coal mine tailings." Part 1 (of 2), Hiroshima, Japan, 117-122.
Liu, J. (1990). "Determination of soft soil characteristics". Ph.D. University of Colorado at Boulder, United States -- Colorado.
Liu, J., and Znidarcic, D. (1991). "Modeling one-dimensional compression characteristics of soils." J.Geotech.Eng., 117(1), 162-169.
Masutti, F. (2001). "Étude expérimentale de la sédimentation-consolidation et de l'acquisition de résistance d'un sol fin". Thèse de Doctorat. École Nationale Supérieure de Géologie de Nancy, Institut National Polytechnique de Lorraine, France. McPhail, G., Noble, A., Papageorgiou, G., and Wilkinson, D. (2004). "Development and
implementation of thickened tailings discharge at Osborne Mine, Queensland, Australia." 2004 International Seminar on Paste and Thickened Tailings, 1-32.
McVay, M., Townsend, F., and Bloomquist, D. (1986). "Quiescent consolidation of phosphatic waste clays." J.Geotech.Eng., 112(11), 1033-1049.
Migniot, C. (1989). "Tasssement et rhéologie des vases Première partie." La Houille Blanche, (1), 11-30.
Mikasa, M. (1965). "Consolidation of soft clay -- New consolidation theory and its application." Civil Engineering in Japan, 4 21-26.
Mittal, H. K., and Morgenstern, N. R. (1976). "Seepage control in tailings dams." Canadian Geotechnical Journal, 13(3), 277-293.
Morris, P. (2002). "Analytical Solutions of Linear Finite-Strain One-Dimensional Consolidation." J.Geotech.Geoenviron.Eng., 128(4), 319-326. Oxenford, J., and Lord, E. R. (2006). "Canadian experience in the application of paste and thickened
tailings for surface disposal." Paste 2006, Australian Centre for Geomechanics, Limerick, Ireland, 93-105. Pane, V., and Schiffman. (1997). "The permeability of clay suspensions." Geotechnique, 47(2), 273-288. Pane, V., and Schiffman, R. L. (1985). "Note on sedimentation and consolidation." Geotechnique, 35(1), 69-72.
Pedroni, L. (2011). "Étude expérimentale et
numérique de la sédimentation et de la consolidation des boues de traitement des eaux acides". Ph.D. École Polytechnique, Montreal (Canada), Canada. Robinsky, E. I. (1999). Thickened tailings disposal in the mining industry Quebecor Printpak, Toronto. Robinsky, E. I. (1975). "Thickened discharge-A new approach to tailings disposal." CIM Bulletin, 68(764), 47-53.
Schiffman, R. L., Vick, S. G., and Gibson, R. E. (1988). "Behavior and properties of hydraulic fills." Geotechnical Special Publication, 166-202. Sills, G. (1998). "Development of structure in sedimenting soils." Philosophical Transactions of the Royal Society A: Mathematical, Physical and Engineering Sciences, 356(1747), 2515-2534. Sills, G. C. (1997). "Consolidation of cohesive sediments in settling columns." Cohesive Sediments, John Wiley & Sons Ltd., 107-120.
Somogyi, F. (1980). "LARGE-STRAIN
CONSOLIDATION OF FINE-GRAINED SLURRIES." Ann.Biomed.Eng., 1-16.
Stone, K. J. L., Randolph, M. F., Toh, S., and Sales, A. A. (1994). "Evaluation of consolidation behavior of mine tailings." J.Geotech.Eng., 120(3), 473-490.
Suthaker, N. N., and Scott, J. D. (1994). "Large strain consolidation of oil sand fine tails in a wet landscape." 47th Canadian Geotechnical Conference, Halifax, 514-523.
Tan, S., Tan, T., Ting, L. C., Yong, K., Karunaratne, G.-P., and Lee, S. (1988). "Determination of consolidation properties for very soft clay." Geotech Test J, 11(4), 233-240.
Tan, T.-S., (1995). "Sedimentation to consolidation: A geotechnical perspective." Part 2 (of 2), Hiroshima, Japan, 937-937.
Tan, T. S., Yong, K. Y., Leong, E. C., and Lee, S. L. (1990). "Sedimentation of clayey slurry."
J.Geotech.Eng., 116(6), 885-898.
Toorman, E. A. (1999). "Sedimentation and self-weight consolidation: Constitutive equations and numerical modelling." Geotechnique, 49(6), 709-726. Townsend, F. C., and McVay, M. C. (1990). "SOA. Large strain consolidation predictions."
J.Geotech.Eng., 116(2), 222-243.
Williams, M. P. A., and Ennis, P. C. (1996). "Suitability of the central thickened discharge method for nickel tailings disposal in Western Australia." Proceedings of the 1996 Nickel Conference, November 27, 1996 - November 29, Australian Inst of Mining & Metallurgy, Kalgoorlie, Aust, 275-283.
Wong, R. K., Mills, B. N., and Liu, Y. B. (2008). "Mechanistic model for one-dimensional consolidation: Behavior of nonsegregating oil sands tailings." J.Geotech.Geoenviron.Eng., 134(2), 195-202. Xie, K. H., and Leo, C. J. (2004). "Analytical solutions of one-dimensional large strain consolidation of saturated and homogeneous clays."
Comput.Geotech., 31(4), 301-314.
Yunxin (Jason), Q., and Sego, D. C. (2001). "Laboratory properties of mine tailings." Canadian Geotechnical Journal, 38(1), 183-190.