HAL Id: hal-00856330
https://hal.inria.fr/hal-00856330
Submitted on 8 Oct 2013
HAL is a multi-disciplinary open access
archive for the deposit and dissemination of
sci-entific research documents, whether they are
pub-lished or not. The documents may come from
teaching and research institutions in France or
abroad, or from public or private research centers.
L’archive ouverte pluridisciplinaire HAL, est
destinée au dépôt et à la diffusion de documents
scientifiques de niveau recherche, publiés ou non,
émanant des établissements d’enseignement et de
recherche français ou étrangers, des laboratoires
publics ou privés.
On the Performance and Energy Efficiency of Hadoop
Deployment Models
Eugen Feller, Lavanya Ramakrishnan, Christine Morin
To cite this version:
Eugen Feller, Lavanya Ramakrishnan, Christine Morin. On the Performance and Energy Efficiency of
Hadoop Deployment Models. The IEEE International Conference on Big Data 2013 (IEEE BigData
2013), Oct 2013, Santa Clara, United States. �hal-00856330�
On the Performance and Energy Efficiency of
Hadoop Deployment Models
Eugen Feller∗†, Lavanya Ramakrishnan†, Christine Morin∗†
∗Inria Centre Rennes - Bretagne Atlantique
Campus universitaire de Beaulieu, 35042 Rennes Cedex, France {eugen.feller, christine.morin}@inria.fr
†Lawrence Berkeley National Laboratory
1 Cyclotron Road, Berkeley, CA 94720, USA [email protected]
Abstract—The exponential growth of scientific and business data has resulted in the evolution of the cloud computing and the MapReduce parallel programming model. Cloud computing emphasizes increased utilization and power savings through consolidation while MapReduce enables large scale data analysis. The Hadoop framework has recently evolved to the standard framework implementing the MapReduce model. In this paper, we evaluate Hadoop performance in both the traditional model of collocated data and compute services as well as consider the impact of separating out the services. The separation of data and compute services provides more flexibility in environments where data locality might not have a considerable impact such as virtualized environments and clusters with advanced networks. In this paper, we also conduct an energy efficiency evaluation of Hadoop on physical and virtual clusters in different configura-tions. Our extensive evaluation shows that: (1) performance on physical clusters is significantly better than on virtual clusters; (2) performance degradation due to separation of the services depends on the data to compute ratio; (3) application completion progress correlates with the power consumption and power consumption is heavily application specific.
Keywords-Cloud Computing, Hadoop MapReduce, Perfor-mance, Energy Efficiency, Virtualization
I. INTRODUCTION
Over the past years the amount of data generated by scientific as well as business applications has experienced an exponential growth. For instance, the Large Hadron Collider (LHC) is expected to generate dozens of petabytes of data [1] per year. Similarly, Facebook is already processing over 500 terabytes of new data daily [2].
Cloud computing environments and MapReduce [3] have evolved separately in the last few years to address the need to process large data sets. Cloud computing environments lever-age virtualization to increase utilization and decrease power consumption through virtual machine (VM) consolidation. The key idea of MapReduce is to divide the data into fixed-size chunks which are processed in parallel. Several open-source MapReduce frameworks have been developed in the last years with the most popular one being Hadoop [4]. While Hadoop has been initially designed to operate on physical clusters, with the advent of cloud computing it is now also deployed across virtual clusters (e.g., Amazon Elastic MapReduce [5]). However, the performance and power implications of the integrated environment are still not well investigated.
In this paper, we explore two Hadoop deployment models on both physical and virtual clusters to understand their performance and power implications. First, we use the tra-ditional model of Hadoop where data and compute services are collocated. Second, we consider an alternative Hadoop de-ployment model that involves separating the data and compute services. Separating data and compute services is especially interesting in environments where data locality might not have a considerable impact such as virtualized environments and clusters with advanced networks [6].
We consider the effects of the deployment models on the application performance (i.e., execution time). We also con-sider the power consumption issue since data centers enabling scalable data analysis now require a tremendous amount of energy. Several works (e.g., [7], [8]) have investigated the design of energy saving mechanisms for Hadoop. However, only one work [9] has studied the power consumption of Hadoop applications with a focus on physical clusters, the traditional Hadoop deployment model, and compute-intensive applications. Understanding the application performance pro-file and power consumption is a fundamental step towards devising energy saving mechanisms.
Our study is conducted in realistic conditions on power-metered servers of the Grid’5000 experimentation testbed [10]. Specifically, we address the following three key issues:
• We investigate the Hadoop application performance with collocated and separated data and compute services on physical and virtual clusters.
• We study the performance-to-power ratios for Hadoop ap-plications when executed on physical and virtual clusters with collocated and separated data and compute services. • We analyze the power consumption profiles of compute
and data-intensive Hadoop applications.
The remainder of this paper is organized as follows. We give an overview of our work in Section II. We describe the methodology in Section III and present the results in Section IV. In Section V, we discuss the related work. Finally, conclusions are presented in Section VI.
II. OVERVIEW
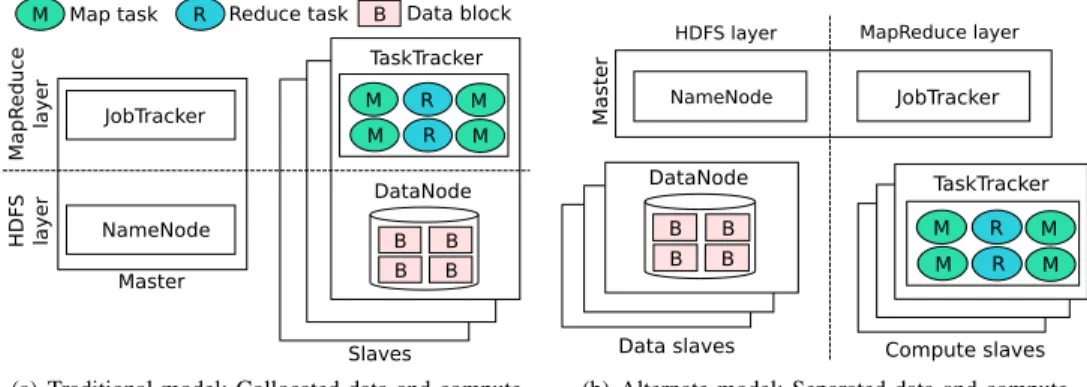
Figure I provides a high-level overview of the two deploy-ment models we consider in this paper. The two models are:
TaskTracker B B B B B M R M M R M DataNode R JobTracker NameNode Ma pR edu ce layer HDF S layer Master Slaves
M Map task Reduce task Data block
(a) Traditional model: Collocated data and compute
TaskTracker M R M M R M JobTracker NameNode MapReduce layer HDFS layer Ma st er
Data slaves Compute slaves B B
B B DataNode
(b) Alternate model: Separated data and compute
Fig. 1. Hadoop deployments models. Master and slaves can be either servers or VMs. 1) traditional model in which data and compute services are
collocated and 2) alternate model in which data and compute services are separated. In this section, we discuss these two models in greater detail.
A. Traditional Model: Collocated Data and Compute Figure 1(a) shows the traditional deployment of Hadoop where the data and compute services are collocated on each slave machine. A slave machine can be either a server or VM. Hadoop provides a compute layer through the MapReduce framework (top layer in Figure I) and a data layer through the Hadoop Distributed File System (HDFS) (bottom layer in Figure I). The JobTracker accepts users requests to start MapReduce jobs and manages the jobs execution based on available map/reduce capacity. In the event a TaskTracker fails, failed tasks are restarted on the remaining TaskTrackers by the JobTracker. The HDFS layer is used to store the input and out-put data. The system consists of a NameNode system service to manage metadata and one or multiple DataNode system services that holds the data blocks. One of the key properties of Hadoop is its ability to exploit the effects of data locality. Consequently, in the traditional Hadoop deployment model, TaskTracker and DataNode system services are collocated on each slave machine.
B. Alternate Model: Separated Data and Compute
Figure 1(b) is an alternate deployment model we study in the paper. In this alternate model, the data (i.e., DataNode) and compute (i.e., TaskTracker) services are run on separate dedicated sets of nodes. However, the performance impacts of such a deployment model are still not well understood. In this work we focus on HDFS and thus target the execution of DataNode system services on the data slaves. However, in principle any distributed file system (e.g., Ceph [11], GlusterFS [12]) can be used.
The separation of data and compute services provides flex-ibility that is a key characteristic of virtualized cloud envi-ronments. Collocating MapReduce and HDFS layers is often not feasible in cloud environments. This has shown to cause difficulties with elastic MapReduce and VM live migration and/or reuse of existing large shared storage infrastructures in traditional clusters [6]. Moreover, with recent advances in
networks, it is believed that data locality is now becoming less important [13] thus suggesting that the performance advantages of collocating MapReduce and HDFS layers are most likely to become negligible in the future.
C. Energy Efficiency
Processing large amounts of data requires huge compute and storage infrastructures, which consume substantial amounts of energy. One common approach to save energy is to perform Dynamic Voltage and Frequency Scaling (DVFS), which involves slowing down the CPU. However, arbitrary slowing down the CPU can yield significant performance degradation [14] especially during compute-bound application phases. It is therefore essential to understand the power con-sumption of Hadoop applications and their correlation with the application progress. Understanding the power consumption is the first step towards the design of effective energy saving mechanisms exploiting DVFS and other power management techniques (e.g., core on/off).
III. METHODOLOGY
In this section, we present our evaluation methodology. A. Workloads
To evaluate the performance and energy efficiency of Hadoop applications in different Hadoop deployment scenar-ios we use three micro-benchmarks: TeraGen, TeraSort, and Wikipedia data processing [15]. The former two benchmarks are among the most widely used standard Hadoop benchmarks. TeraGen is typically used to generate large amounts of data blocks. This is achieved by running multiple concurrent map tasks. Consequently, TeraGen is a write intensive I/O bench-mark. The data generated by TeraGen is then sorted by the TeraSort benchmark. The TeraSort benchmark is CPU bound during the map phase and I/O bound during the reduce phase. The Wikipedia data processing application is used to rep-resent common operations of data-intensive scientific appli-cations, which involve filtering, reordering, and merging of data. The filter operation takes a large amount of data as input and outputs a subset of the data and is thus read intensive during the map phase. In the current implementation, the filter operation searches for a first title tag in the input data of each map task and writes the content of the title tag back to disk.
The reorder operation performs manipulations on a data set which result in a similar amount of reads and writes in the map and reduce phases respectively. In the current implementation, reorder searches for a timestamp tag and replaces it with another string of the same length in the entire map input. The merge operation involves manipulations on the data set such that more data is written back to disk than was read. In the current implementation of the merge operation, a string is appended by each map task to its input. Thereby, the string length is chosen such that the amount of data written back is approximately twice the input size.
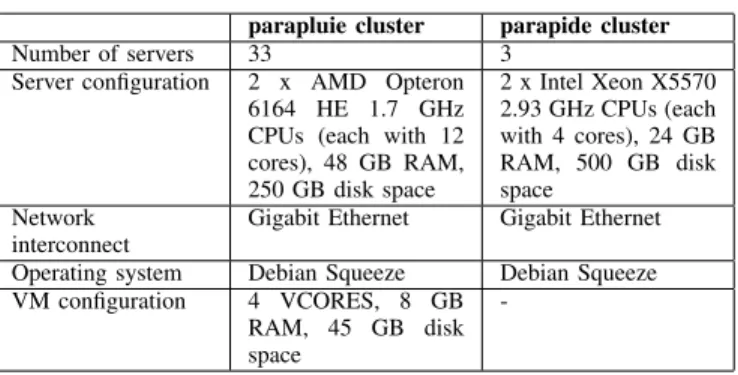
B. Platform Setup
To conduct the experiments we have used 33 HP Proliant DL165 G7 servers of the parapluie cluster which is part of the Grid’5000 experimentation testbed [10]. In the virtualized cluster configuration, the Snooze [16] cloud stack is used to manage the parapluie servers. Snooze system management ser-vices are deployed on three dedicated Sun Fire X2270 servers of the parapide cluster. Table I summarizes our platform setup. Each VM has 4 virtual cores (VCORES), 8 GB of RAM, and 45 GB of disk space. This is similar to Amazon’s EC2 large instance configuration. This configuration allowed us to accommodate 161 VMs. In our experiments, the Snooze round-robin VM placement algorithm has assigned the first six VMs on the first server and the remaining 155 ones, 5 per server. This way 4 spare physical cores were left on all the parapluie servers except the first one which was fully utilized. Finally, an external NFS server with 2 TB storage
TABLE I
PLATFORM SETUP SUMMARY
parapluie cluster parapide cluster
Number of servers 33 3
Server configuration 2 x AMD Opteron 6164 HE 1.7 GHz CPUs (each with 12 cores), 48 GB RAM, 250 GB disk space 2 x Intel Xeon X5570 2.93 GHz CPUs (each with 4 cores), 24 GB RAM, 500 GB disk space Network interconnect
Gigabit Ethernet Gigabit Ethernet Operating system Debian Squeeze Debian Squeeze VM configuration 4 VCORES, 8 GB
RAM, 45 GB disk space
-is used to host data sets for the Wikipedia data processing application. The NFS server is interconnected using Gigabit Ethernet to the parapluie cluster.
C. Power Measurement and Hadoop Setups
We use the parapluie cluster in all experiments. The power measurements are done from the first parapide server in order to avoid influencing the experiment results through measurements. The total power consumption of the parapluie cluster is computed by aggregating the power values of the six PDUs every two seconds. In all experiments Hadoop 0.20.2 is deployed on the servers and VMs using our scalable deployment scripts. It is configured with 128 MB block size,
128 KB I/O buffer size, and a replication level of one. The JobTracker and the NameNode system services are running on the first server (or VM). Note, that tuning the Hadoop parameters is known to be a non-trivial task. In this work, the Hadoop parameters were based on published literature and the resource constraints in our environment.
D. Experiment Scenarios
In order to provide a fair comparison of Hadoop perfor-mance across different scenarios, we have configured Hadoop on servers and VMs to have the same map and reduce capacity. On servers, each TaskTracker is configured with 15 map and 5 reduce slots. On VMs, each TaskTracker is configured with 3 map and 1 reduce slots. The first server and VM act as the JobTracker. This results in a total of 480 map and 160 reduce slots for the remaining 32 servers and 160 VMs.
In the experiments with separated data and compute services on a physical cluster we deploy Hadoop with the following data-compute server ratios: 8-8, 16-8, 16-16, 8-16, and 8-24. The ratios are selected such as to enable the performance and power evaluation of Hadoop with balanced and unbalanced data to compute servers. On virtual clusters, the following data-compute VM ratios are used: 30, 80-30, 130, 30-80, 80-30-80, and 30-130. Note that in all ratios, total power of 33 servers is measured due to the lack of power-meters supporting per-outlet measurements.
E. Metrics
For our experiments, we have identified three key metrics of interest: application execution time, performance to power ration, and application progress correlation with power con-sumption. The first metric is especially important in order to understand the performance impact of different Hadoop de-ployments. The second metric enables to compare the deploy-ment models power efficiency. To compute the performance to power ratio, we define performance to be inverse proportional
to the execution time (i.e.,T1
exec). Consequently, the higher the
execution time, the lower the performance. Power consumption is estimated by computing the application’s average power consumption. Note that given that average power consumption is near identical across all application runs, performance to power metric also captures the execution time degradation. A lower performance-to-power value implies longer execution time. Finally, the third metric gives an understanding of the workload’s power consumption profiles.
IV. EXPERIMENTRESULTS
We now present our experiment results with collocated and separated data and compute services on physical and virtual clusters for the aforementioned workloads. Particularly, we focus on: (1) application execution time; (2) performance to power ratio; (3) application power consumption profiles. A. Traditional Deployment: Application Execution Time
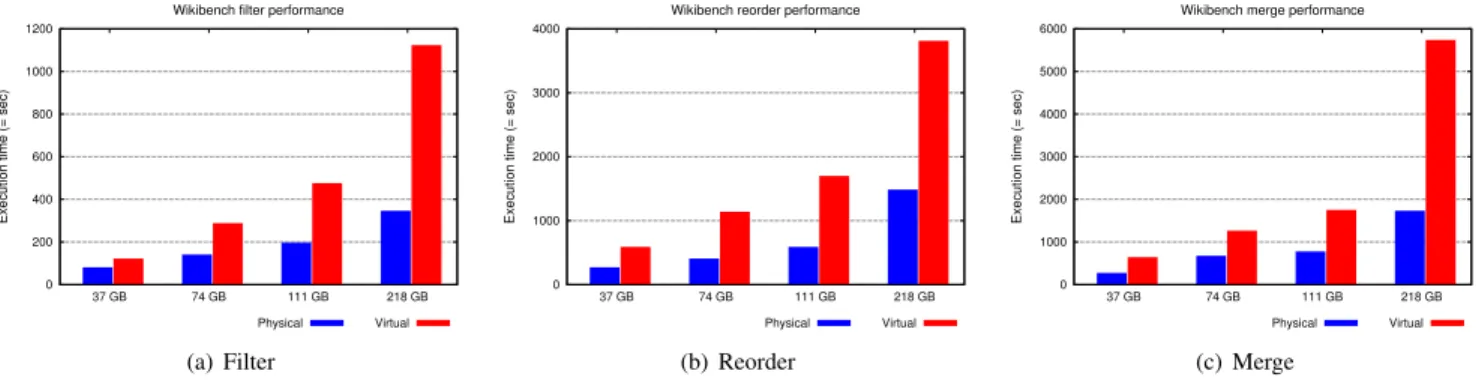
Figure 2 shows the Wikipedia data processing execution time on physical and virtual clusters with collocated data
0 200 400 600 800 1000 1200 37 GB 74 GB 111 GB 218 GB
Execution time (= sec)
Wikibench filter performance
Physical Virtual (a) Filter 0 1000 2000 3000 4000 37 GB 74 GB 111 GB 218 GB
Execution time (= sec)
Wikibench reorder performance
Physical Virtual (b) Reorder 0 1000 2000 3000 4000 5000 6000 37 GB 74 GB 111 GB 218 GB
Execution time (= sec)
Wikibench merge performance
Physical Virtual
(c) Merge
Fig. 2. Hadoop Wikipedia data processing for three data-intensive operations on Wikipedia data with collocated data and compute services. Servers outperform VMs. 0 0.1 0.2 0.3 0.4 0.5 0.6 0.7 0.8 0.9 1 1.1 1.2 1.3 1.4 1.5 1.6 1.7 1.8 1.9 2 2.1 2.2 8-8 16-8 16-16 8-16 8-24 collocation Performance/power (10^3)
Wikibench on servers, filter
37GB 74GB 111GB (a) Filter 0 0.05 0.1 0.15 0.2 0.25 0.3 0.35 0.4 0.45 0.5 0.55 0.6 8-8 16-8 16-16 8-16 8-24 collocation Performance/power (10^3)
Wikibench on servers, reorder
37GB 74GB 111GB (b) Reorder 0 0.05 0.1 0.15 0.2 0.25 0.3 0.35 0.4 0.45 0.5 0.55 0.6 8-8 16-8 16-16 8-16 8-24 collocation Performance/power (10^3)
Wikibench on servers, merge
37GB 74GB 111GB
(c) Merge
Fig. 3. Hadoop Wikipedia data processing performance to power ratios for three data-intensive operations with separated data and compute services on servers. For filter with largest input size, the 16-8 data-compute ratio achieves the best results due to high write I/O. Reorder and merge perform the best with the 8-16 data-compute ratio. Adding more compute servers does not yield improvements.
5 6 7 8 0 100 200 300 400 500 600 0 10 20 30 40 50 60 70 80 90 100 Power (= kW)
Remaining map/reduce percentage (= %)
Time (= sec) Wikibench 80-30 filter - VMs / 111 GB
Shuffle start Shuffle end
Power consumption Map percentage Reduce percentage (a) Filter 5 6 7 8 0 400 800 1200 1600 2000 2400 2800 3200 0 10 20 30 40 50 60 70 80 90 100 Power (= kW)
Remaining map/reduce percentage (= %)
Time (= sec) Wikibench 80-30 reorder - VMs / 111 GB
Shuffle start Shuffle end
Power consumption Map percentage Reduce percentage (b) Reorder 5 6 7 8 0 400 800 1200 1600 2000 2400 2800 3200 3600 4000 0 10 20 30 40 50 60 70 80 90 100 Power (= kW)
Remaining map/reduce percentage (= %)
Time (= sec) Wikibench 80-30 merge - VMs / 111 GB
Shuffle start Shuffle end
Power consumption Map percentage
Reduce percentage
(c) Merge
Fig. 4. Remaining percentage of map/reduce and power consumption for Hadoop Wikipedia data processing with 80 data and 30 compute VMs. Power consumption drops as the map and reduce complete.
and compute layers for three data intensive operations: filter, reorder, and merge. As it can be observed all the operations exhibits a significant performance degradation when executed on VMs. Filter is from 1.3 to 3.2 × faster on servers than on VMs depending on the data size. Similarly, reorder exhibits performance benefits from 2.1 to 2.5 × on servers. Finally, merge is from 2.3 to 3.3 × faster on servers. Similarly, TeraGen execution time is 1.2 to 2.7 × (resp. 2.1 to 2.7 × for TeraSort) faster on servers than on VMs depending on the data size (figures omitted due to space constraints).
The performance degradation can be explained by the fact that both benchmarks are heavily I/O intensive and previous work has shown that these perform poorly in virtualized envi-ronments [17]. Moreover, in all the experiments five VMs are
hosted per server additionally causing contention for shared resources particularly disk and memory. Previous studies [18] targeting one VM per server indicate virtualization overheads of 6% to 16% only. However, cloud environments servers are shared between multiple VMs to increase utilization, our results obtained with five VMs per server suggest significantly higher performance decrease.
B. Alternate Deployment: Performance to Power Ratio Figure 3 shows the performance to power ratios for filter, merge, and reorder operations with collocated and separated data and compute services on servers. As it can be observed, the collocated scenario results in the highest performance to power ratio for all input data sizes due to data locality. The im-pact of separating the data and compute layers heavily depends
5 6 7 8 0 200 0 10 20 30 40 50 60 70 80 90 100 Power (= kW)
Remaining map percentage (= %)
Time (= sec)
Teragen power consumption - Physical / 500 GB
Power consumption Map percentage
(a) TeraGen 5 6 7 8 0 200 400 600 800 1000 0 10 20 30 40 50 60 70 80 90 100 Power (= kW)
Remaining map/reduce percentage (= %)
Time (= sec)
Terasort power consumption - Physical / 500 GB
Shuffle start Shuffle end
Power consumption Map percentage
Reduce percentage
(b) TeraSort
Fig. 5. TeraGen and TeraSort percentage of remaining map/reduce and power consumption with collocated data and compute layers on servers for 500 GB. Map and reduce completion correlates with decrease in power consumption.
on the right data to compute ratio choice. For instance, for the read intensive filter operation, it is beneficial to have more data than compute servers. The best performance to power ratio is achieved at 16 data and 8 compute servers. Reorder and merge operations benefit from having more compute than data servers. The best results are achieved with 8 data and 16 compute servers. Adding more compute servers did not yield significant improvements as 16 compute servers were enough to process the largest data set.
Similarly, collocation of data and compute layers achieves the best results on VMS as well (figures not shown due to space constraints). For filter, the best results are obtained with 80 data and 30 compute VMs. Beyond 80 data VMs no improvements could be observed for our data sets. Reorder and merge operations achieved the best results with 30 data and 80 compute VMs.
C. Application Power Consumption Profiles
Figure 5 shows the TeraGen and TeraSort completion progress in conjunction with the power consumption on servers with collocated compute and data layers for input size of 500 GB. Particularly, we plot the percentage of map and reduce remaining against the power consumption. The trends are similar for other data sizes which are not shown due to limited space. As it can be observed, the remaining percentage of maps and reduces correlate with the power consumption. Particularly, when the map and reduce complete, the power consumption decreases thus indicating underutilized servers. Both TeraGen and TeraSort exhibit different power consump-tion. TeraGen has a relatively long phase of a high steady power consumption between 100% and 40% maps remaining thus indicating high CPU utilization. TeraSort has a similar behavior in its map phase. However, the existence of a long shuffle and reduce phase yields a more fluctuating power consumption with tails and peaks. The results show that the different power profiles in the map, shuffle, and reduce phases provide a granularity at which energy saving mechanisms (e.g., DVFS [19]) might be considered. However, the energy saving mechanisms must be designed to carefully consider the resource (e.g., CPU) boundness during the map/reduce phases since otherwise they might yield decreased performance.
Next, we present the Wikipedia data processing completion progress and power consumption on VMs for the 80 data and 30 compute VMs (Figure 4 ). The trend is similar for the collocated scenario and the other ratios of separated data and compute services and not shown due to space constraints. Similar power consumption pattern were obtained on servers. Similar to TeraGen and TeraSort, a correlation between the percentage of remaining of map/reduce and the power con-sumption exist. However, another important observation is that the power consumption profile of Wikipedia data processing is significantly different from TeraGen and TeraSort. Particularly, power consumption is steady in the map phase, and more smooth in the reduce phase. A significant drop in power consumption can be observed during the shuffle phase thus making the shuffling phase a good candidate to apply power management mechanisms. These results show that power consumption profiles are heavily application specific.
D. Summary
The three key findings of our study are:
1) Hadoop on VMs yields significant performance degra-dation with increasing data scales for both compute and data intensive applications. For instance, TeraSort at 500 GB is 2.7 × faster on servers than on VMs. 2) Separation of data and compute layers reduces the
performance-to-power ratio. The degree of the reduction depends on the application, data size, and the data to compute ratio. For instance, reorder performance to power ratio with collocated data and compute layers on VMs with 111 GB data is 3.6 × better than at 130-30 and only 1.2 × better than at 30-130.
3) Power consumption profiles are application specific and correlate with the map and reduce phases providing opportunities for applying energy savings.
V. RELATEDWORK
We discuss the related work in performance and energy efficiency of Hadoop.
Performance. Previous work [20], has shown that VMs are suitable for executing data intensive Hadoop applications through use of sort and wordcount benchmarks. The work by
Jian et. al [21] shows that a proper MapReduce implementation can achieve a performance close to parallel databases through experiments performed on Amazon EC2. Previous work [15] evaluated Hadoop for scientific applications and the trade-offs of various hardware and file system configurations. Our work complements the aforementioned performance efforts by investigating the Hadoop performance with separated data and compute layers and specific data operations.
Energy efficiency. Leverich et. al. [7] propose Covering Subset (CS) data layout and load balancing policy. An al-ternative approach called All-In Strategy (AIS) [8] has been found to be a better choice. Previous work shows that DVFS can yield substantial energy savings in compute-intensive Hadoop application [9]. Berkeley Energy Efficient MapReduce (BEEMR) [22] proposes the processing of interactive jobs on a small subset of servers and transitions the remaining servers into a power saving state. Finally, GreenHadoop [23] considers the availability of green energy (i.e., solar) as well as the MapReduce jobs energy requirements when scheduling. Our study complements existing energy efficiency efforts by investigating the impacts of separating data and compute layers on the performance to power ratios. Moreover, it gives insights in the power profiles of data intensive Hadoop applications.
VI. CONCLUSIONS
In this paper, we have investigated the performance and power implications of running Hadoop in various deployment models. Particularly, our study has focused on the applica-tion execuapplica-tion time, the performance to power ratios, and application progress correlation with power consumption when running Hadoop on physical and virtual server and separating the data and compute services. Evaluating the implications of separating data and compute services is especially impor-tant as Hadoop is now increasingly used in environments where data locality might not have a considerable impact such as virtualized environments and clusters with advanced networks. Our extensive evaluation shows that: (1) separating data compute services is feasible at the cost of decreased performance to power ratios. The data to compute ratio must be carefully selected based on the application characteristics, available hardware, and the amount of data to be processed; (2) energy saving mechanisms must carefully consider the re-source boundness and differences between the map and reduce tasks. We believe that our study provides valuable insights for running Hadoop in physical and virtualized environments with separated data and compute services. Moreover, it can serve as a starting point to design effective energy saving mechanisms.
VII. ACKNOWLEDGMENTS
This research was done in the context of the Inria DAL-HIS associate team, a collaboration between the Inria Myr-iads project-team and the LBNL’s Advanced Computing for Science Department. This work was also supported by the Director, Office of Science, of the U.S. Department of Energy under Contract No. DE-AC02-05CH11231 and by NSF under
Grant No. 1032873. The experiments presented in this paper were carried out using the Grid’5000 testbed, being developed under the INRIA ALADDIN development action with support from CNRS, RENATER and several Universities as well as other funding bodies (see https://www.grid5000.fr).
REFERENCES
[1] J. Ekanayake, S. Pallickara, and G. Fox, “Mapreduce for data intensive scientific analyses,” in Proceedings of the 2008 Fourth IEEE Interna-tional Conference on eScience, ser. ESCIENCE ’08, 2008, pp. 277–284. [2] A. Menon, “Big data @ facebook,” in Proceedings of the 2012 workshop on Management of big data systems, ser. MBDS ’12, 2012, pp. 31–32. [3] J. Dean and S. Ghemawat, “Mapreduce: simplified data processing on large clusters,” in Proceedings of the 6th conference on Symposium on Opearting Systems Design & Implementation, 2004, pp. 10–10. [4] “The Apache Hadoop Framework,” http://hadoop.apache.org, 2013. [5] “Amazon Elastic MapReduce,” http://aws.amazon.com/
elasticmapreduce/, 2013.
[6] R. McDougall, “Towards an Elastic Elephant: En-abling Hadoop for the Cloud,” http://cto.vmware.com/ towards-an-elastic-elephant-enabling-hadoop-for-the-cloud/, 2012. [7] J. Leverich and C. Kozyrakis, “On the energy (in)efficiency of hadoop
clusters,” SIGOPS Oper. Syst. Rev., vol. 44, no. 1, pp. 61–65, Mar. 2010. [8] W. Lang and J. M. Patel, “Energy management for mapreduce clusters,”
Proc. VLDB Endow., vol. 3, no. 1-2, pp. 129–139, Sep. 2010. [9] T. Wirtz and R. Ge, “Improving mapreduce energy efficiency for
com-putation intensive workloads,” in Proceedings of the 2011 International Green Computing Conference and Workshops, ser. IGCC ’11, 2011. [10] R. Bolze et al., “Grid’5000: A large scale and highly reconfigurable
experimental grid testbed,” Int. J. High Perform. Comput. Appl., vol. 20, no. 4, pp. 481–494, Nov. 2006.
[11] S. Weil et al., “Ceph: A scalable, high-performance distributed file system,” in Proceedings of the 7th symposium on Operating systems design and implementation, ser. OSDI ’06, 2006, pp. 307–320. [12] “The Gluster Filesystem,” http://www.gluster.org, 2013.
[13] G. Ananthanarayanan and et. al, “Disk-locality in datacenter computing considered irrelevant,” in Proceedings of the 13th USENIX conference on Hot topics in operating systems, ser. HotOS’13, 2011.
[14] E. Le Sueur and et. al., “Dynamic voltage and frequency scaling: the laws of diminishing returns,” in Proceedings of the 2010 international conference on Power aware computing and systems, 2010, pp. 1–8. [15] Z. Fadika, M. Govindaraju, R. Canon, and L. Ramakrishnan, “Evaluating
hadoop for data-intensive scientific operations,” in Proceedings of the 2012 IEEE Conference on Cloud Computing, 2012, pp. 67–74. [16] E. Feller, L. Rilling, and C. Morin, “Snooze: A scalable and autonomic
virtual machine management framework for private clouds,” in Proceed-ings of the 2012 12th IEEE/ACM International Symposium on Cluster, Cloud and Grid Computing, ser. CCGRID ’12, 2012, pp. 482–489. [17] D. Ghoshal, R. S. Canon, and L. Ramakrishnan, “I/o performance of
virtualized cloud environments,” in Proceedings of workshop on Data intensive computing in the clouds, 2011, pp. 71–80.
[18] D. Moise and A. Carpen-Amarie, “Mapreduce applications in the cloud: A cost evaluation of computation and storage,” in Data Management in Cloud, Grid and P2P Systems, vol. 7450, 2012, pp. 37–48.
[19] G. Dhiman, G. Marchetti, and T. Rosing, “vgreen: a system for energy efficient computing in virtualized environments,” in Proceedings of the 14th ACM/IEEE international symposium on Low power electronics and design, ser. ISLPED ’09, 2009, pp. 243–248.
[20] S. Ibrahim et al., “Evaluating mapreduce on virtual machines: The hadoop case,” in Proceedings of the 1st International Conference on Cloud Computing, ser. CloudCom ’09, 2009, pp. 519–528.
[21] D. Jiang, B. C. Ooi, L. Shi, and S. Wu, “The performance of mapreduce: an in-depth study,” Proc. VLDB Endow., vol. 3, no. 1-2, pp. 472–483, Sep. 2010.
[22] Y. Chen, S. Alspaugh, D. Borthakur, and R. Katz, “Energy efficiency for large-scale mapreduce workloads with significant interactive analysis,” in Proceedings of the 7th ACM european conference on Computer Systems, ser. EuroSys ’12, 2012, pp. 43–56.
[23] I. n. Goiri et al., “Greenhadoop: leveraging green energy in data-processing frameworks,” in Proceedings of the 7th ACM european conference on Computer Systems, ser. EuroSys ’12, 2012, pp. 57–70.