HAL Id: hal-01086803
https://hal.inria.fr/hal-01086803
Submitted on 24 Nov 2014
HAL is a multi-disciplinary open access
archive for the deposit and dissemination of
sci-entific research documents, whether they are
pub-lished or not. The documents may come from
teaching and research institutions in France or
abroad, or from public or private research centers.
L’archive ouverte pluridisciplinaire HAL, est
destinée au dépôt et à la diffusion de documents
scientifiques de niveau recherche, publiés ou non,
émanant des établissements d’enseignement et de
recherche français ou étrangers, des laboratoires
publics ou privés.
Distributed under a Creative Commons Attribution - NonCommercial| 4.0 International
License
Re-Typograph Phase I: a Proof-of-Concept for Typeface
Parameter Extraction from Historical Documents
Bart Lamiroy, Thomas Bouville, Julien Blégean, Hongliu Cao, Salah Ghamizi,
Romain Houpin, Matthias Lloyd
To cite this version:
Bart Lamiroy, Thomas Bouville, Julien Blégean, Hongliu Cao, Salah Ghamizi, et al.. Re-Typograph
Phase I: a Proof-of-Concept for Typeface Parameter Extraction from Historical Documents. Document
Recognition and Retrieval XXII, IS&T/SPIE, Feb 2015, San Francisco, United States. �hal-01086803�
Re-Typograph Phase I: a Proof-of-Concept for Typeface
Parameter Extraction from Historical Documents
Bart Lamiroy
a, Thomas Bouville
b, Julien Blégean
c, Hongliu Cao
d, Salah Ghamizi
d, Romain
Houpin
cand Matthias Lloyd
da
Université de Lorraine – Loria UMR 7503
Campus Scientifique, BP 239, 54506 Vandœuvre-lès-Nancy cedex, France
[email protected]
b
Atelier National de Recherche Typographique – École nationale supérieure d’art de Nancy
1 avenue Boffrand, BP 13129, 54013 Nancy cedex, France
[email protected]
c
Université de Lorraine – Télécom Nancy
dUniversité de Lorraine – Mines Nancy
ABSTRACT
This paper reports on the first phase of an attempt to create a full retro-engineering pipeline that aims to construct a complete set of coherent typographic parameters defining the typefaces used in a printed homogenous text. It should be stressed that this process cannot reasonably be expected to be fully automatic and that it is designed to include human interaction. Although font design is governed by a set of quite robust and formal geometric rulesets, it still heavily relies on subjective human interpretation. Furthermore, different parameters, applied to the generic rulesets may actually result in quite similar and visually difficult to distinguish typefaces, making the retro-engineering an inverse problem that is ill conditioned once shape distortions (related to the printing and/or scanning process) come into play.
This work is the first phase of a long iterative process, in which we will progressively study and assess the techniques from the state-of-the-art that are most suited to our problem and investigate new directions when they prove to not quite adequate. As a first step, this is more of a feasibility proof-of-concept, that will allow us to clearly pinpoint the items that will require more in-depth research over the next iterations.
1. INTRODUCTION
1.1 Context and Motivations
The initial motivation behind this work is to be found in Digital Humanities, and the studies of early printed documents dating back to the XV and XVI centuries. Both the physical constraints of how typesetting was done, as well as the influence of calligraphy and pre-existing font shapes determined how the first typefaces were developed in the early days of typesetting, but most of the design rules originating in this period still greatly dominate the modern geometric rulesets currently in use for typeface design.
Trying to recover the typeface parameters from an existing original document is valuable for historians and type designers and may have useful applications for document encoding and compression in digital libraries. For historians, the study of influence between various known early printers and type designers, the way the craft evolved and stabilised can be well observed from the evolution of the shapes, and various typographical details or characteristics. It gives valuable information of where techniques evolved and how they were influenced by others or influenced future developments. It may give indications of exchanges, artistic movements or migrations throughout Renaissance Europe. For modern typeface designers, revisiting the origins of existing fonts can be a source of inspiration and a field of study that fosters creativity and design of new typefaces. Tools that provide straightforward means to convert scanned printed text into readily usable font descriptions are currently non existent and would be a great asset and produce a leap in productivity for modern designers. In the case of digital libraries, there is an obvious advantage of being able to provide appropriate document encodings for contextual visualisation.1 Rather than providing access to either scanned pixmap versions of historical printed material, or,
on the other hand, OCRed text versions that are not visually representative of the original text, a tool that could recreate a visually satisfying modern version of the original font would greatly enhance the user’s interaction experience with the documents. For instance, Marc Smith, identifies four levels of possible transcription for historical documents.2 We transpose these findings to the context of user interaction with historical digitised
documents:
• facsimile, bearing the greatest possible resemblance with the original document (including defects or stains on the paper, etc.) usually obtained with high resolutions scans;
• diplomatic or conservative transcriptions, offering an OCRed, searchable text, usually void of the most obvious defects of the original document, but trying to provide a visual representation close to the original (especially with respect to fonts and characters and by keeping spelling and the use of special characters unchanged);
• modernised transcriptions, using modern spelling, correcting possible spelling errors or reinterpreting no longer used special signs or characters, favouring readability and not necessarily maintaining visual resem-blance with the original text;
• translations, using a modern lexicon.
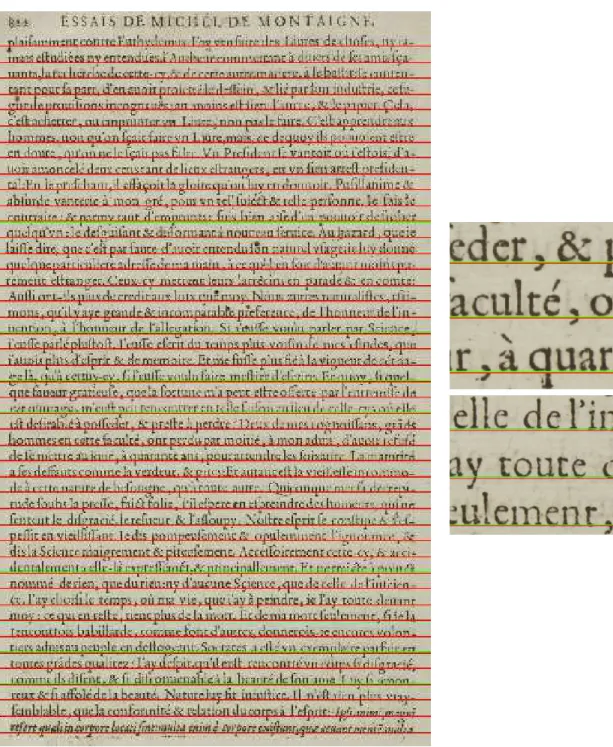
Our approach would be situated at the diplomatic or conservative level. Fig. 1 show an example of possible transcriptions from Michel de Montaigne’s “Essays”.3 We will be using excerpts from this edition throughout
this paper.
Figure 1. Different levels of transcription for a given document2
(here Michel de Montaigne’s “Essays” in an edition from 1635); from top to bottom: facsimile, diplomatic, modernised and translation.
1.2 State-of-the-Art
1.2.1 In Document Image Analysis
Font analysis is a topic that is not very much addressed in document image analysis, with two notable exceptions: font variability handling for OCR4, 5 and font recognition (essentially for document content classification). The
first class of approaches consists of trying to provide elements of font structure to OCR engines to make them more robust in the presence of different character shapes. The second consists of trying to identify instances of known fonts,6–9which is totally different from what we want to achieve here. In the first case, the main goal is
more to extract sufficient invariants over a class of typefaces and their individual fonts, such as to identify what best describes each character. In other terms, the main goal of font variability in OCR is to ignore what defines a typeface with respect to another. In the second case, the goal is to classify text with respect to a set of known fonts. In this context it is not quite necessary to actually exhibit typeface characteristics, but rather to identify a distance measure between font instances.
These approaches do not address the questions we try to cover here. In our case, the main goal is to extract typographically significant information from scanned shapes of characters, and to reconstruct, to the best of our ability the overall font (or, if possible, typeface) description. Only very rare cases exists10–12 where this was
attempted. Our approach is closest related to is.12 It extends its scope by not only addressing basic typographic
metrics, but also by looking into more elaborate structures of size and shape relationships as to not only recover distinguishable features related to overall character shape sizes, but also laying groundwork to allow for reverse engineering the typeface shapes and forms.
1.2.2 Typography
Although typeface design undoubtably is a creative process that relies on the sensibility its creator, and as such is an artistic process, it is built upon a consistent set of rules and metrics that can be used as a basis for image analysis. Conversely, however, these rules cannot be considered as universally applicable or valid, since artistic creation necessarily integrates a part of disruption with established conventions. Therefore, the following list of invariants or metrics can only be considered as a set of general guidelines, and not as an absolute ruleset. This also explains why we are aiming at an overall process that integrates user feedback, rather than expecting to develop a fully automatic algorithm.
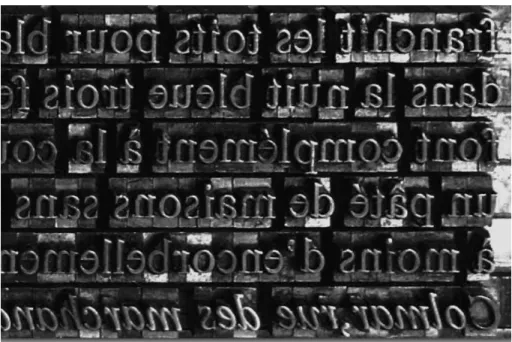
Figure 2. A picture of a movable type, set in a printing matrix and showing the alignment of the Case Height. Here, a lead Times New Roman originally created by Stanley Morison in 1932 for Monotype.
1. Case Height is usually the most robust invariant attribute of a font. Font case height is directly derived from the original constraints of typesetting where the fonts were set in a case, and needed to have the height of their encasings aligned. This is illustrated in Fig. 2, showing a font case with actual lead fonts set for printing. One can clearly distinguish the individual letter blocks, all of the same height and consequently perfectly horizontally aligned.
The case height produces a direct relation to the body height of the font, and introduces hard constraints of maximal admitted heights for ascenders and descenders and inter line spacing.
2. As a result of the previous point, one can derive a number of support lines that capture the main dimensions of the font.13 This is shown in Fig. 3.
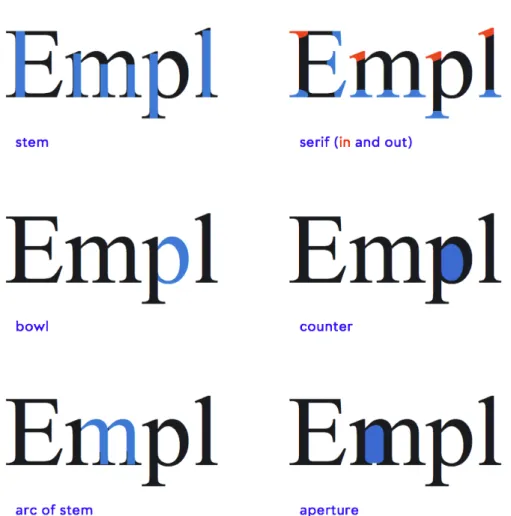
3. Once the main heights and widths fixed, many of the structural characteristics of the font have a coherent behaviour over all characters. As shown in Fig. 4 stroke width, curvatures of the arcs, stem slanting, serifs etc. share properties that make the font balanced and distinct. The same geometric characteristics are reused for similar characters (like ‘n’ and ‘m’ or ‘b’, ‘d’ and p’, for instance) or can be derived easily.11
Figure 3. Main typographic measures, as presented in.13
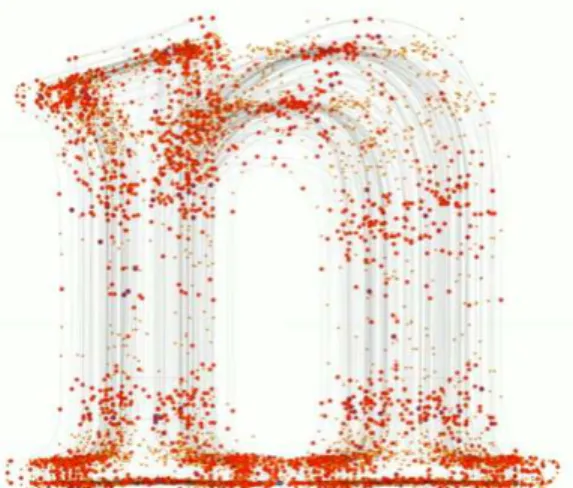
Notwithstanding the sound structural grounding of type design, and the possibility to geometrically describe fonts, reverse engineering of a printed instance remains ill conditioned. An empirical proof of this conditioning was given by Erik Van Blokland’s experiment14 involving a large number of professional type designers, who
were asked to reverse engineer a shown font. They were given a printed instance of particular typeface, and were asked to conceive a digitised version of the given instance. The digitised version consisted of a series of B-Spline curves modelling the font’s contours. One of the obtained results, superposing approximately 50 obtained reconstructions of a letter ‘n’ is shown in Fig. 5: the grey lines are the obtained B-Spline outlines, the dark orange dots are the B-Spline control points, and the clear orange dots are the corresponding left and right tangency control handle points. Given the fact that all participants were professional type designers, it is quite interesting to observe how different the various interpretations can be, and it is tempting to infer from these results that there is no strong human consensus. One does observe “clusters” of control points that tend to occur in areas of strong curvature, but the variance remains quite high. These results also underscore an aspect of type design that should not be neglected: the interpretation of printed material often occurs in a context of re-appropriation and re-design, and not necessarily with an aim of fully identical reproduction of the original shapes. The need for carefully provided tools that allow human interaction with automatically extracted typographic parameters should therefore not be neglected.
Figure 5. Results from an experiment by Erik Van Blokland, requesting professional type designers to reverse engineer a given font: dots are B-Spline control points and tangency handle points.
In the next sections we will be describing in detail how we can extract typographically significant measures and shape identifications that will help type designers and typographers to use scanned instances of characters to construct modern vector fonts, based on the originals.
2. PROCESS DESCRIPTION
The overall process we will be implementing is shown in Fig. 6. It should be clear to the reader that this is currently an account of a proof-of-concept that will be gradually enhanced and developed. The general underlying idea is to conceive an iterative process that will rely on human interaction for guiding the automatic process, especially with respect to enforcing or relaxing some of the typographical rules discussed in § 1.2.2.
The current version operates in the following manner:
1. From a scanned original document, we use the Agora and Retro software∗developed by Ramel et al.15–17
at the University of Tours, France. This step allows us to extract all instances of the characters used in the document, and group them together, in order to obtain sets of ‘a’, b’ ...
The tools provide the bounding boxes and positions in the page of each extracted character. The obtained bounding boxes strongly depend on the quality of the original image and may have several pixels of
∗
difference among different character instances. Furthermore, the resulting clipped image patches have the same resolution as the original document (which may be relatively low).
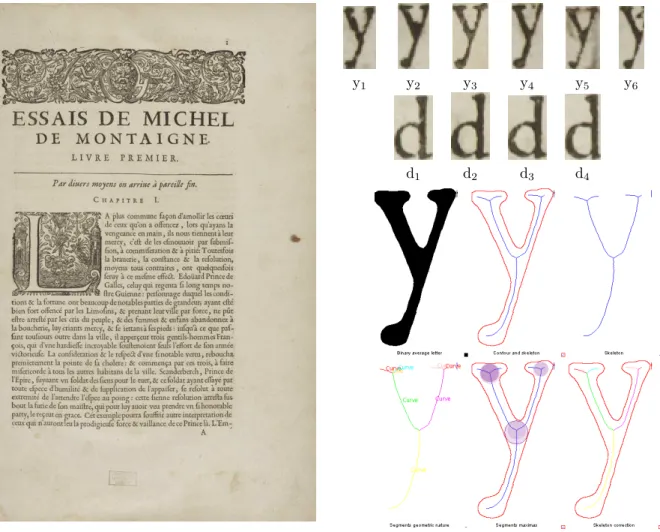
2. For each obtained class of characters, we extrapolate the image patch to a higher resolution and then compute the average shape over all instances in the class. This part will be discussed in more detail in § 3. The use of an average image will smoothen out noise and shape deformations due to printing defects, ageing, bleed through or segmentation errors (cf. respectively y2, y4, y5 and y6in Fig. 6)
y1 y2 y3 y4 y5 y6
d1 d2 d3 d4
Figure 6. Page from "Essays" by M. de Montaigne, in a 1635 edition3
from which all instances of printed characters are extracted and clustered by shape. For each cluster, a high resolution average shape is computed, from which further typographically significant measures, related to those in Fig. 4, are derived.
3. Since our goal is to provide a typographically rich description of the fonts for subsequent use by designers, we need to extract the information that is used for font representation. Many approaches to representing fonts exist,18, 19but can be categorised in three main classes: contour based, skeleton based and component
based. We therefore compute the average shape’s contour (§ 4) and skeleton (§ 5). These then further allow us to start measuring characteristic shape features like vertical straight strokes (stems) or curves (bowls) as well as line thickness and its evolution over strokes. These are illustrated in Fig. 6 on the large y’ shapes.
possible to extract more fine-grained information related to typographical structure, such as stem and serif detection, curvature thickness estimation in bowls, etc. These points will be addressed in § 7.
3. AVERAGE IMAGE COMPUTATION
One of the main challenges is to compute a robust, high enough resolution representation of the extracted characters, in order to be able to obtain useful typographical information. As can be seen in Fig. 6, the quality of the individual characters, scanned at a 300 or 400dpi resolution is insufficient for direct handling by image analysis algorithms. Although this may not be visually obvious, the extracted characters are, on average, 22 × 43 pixels in size, which does not allow for a robust estimation of the shape parameters. This is not only due to the scanning resolution. As can be seen, many other defects, usually observed in historical documents, affect the shape quality: paper and ink quality, ageing, stains, bleed through ...
3.1 Image Interpolation
We proceed first by artificially enhancing the image resolution by bilinear image extrapolation. In our current context, both due to the fact this is a proof-of-concept phase on the one hand, and the fact that we know our initial data is noisy, and will be filtered in subsequent stages, on the other hand, we do not require a sophisticated extrapolation method. Therefore, given an original n × m image I, we define the extrapolated 2n × 2m image
ˆ I as ˆ I (i, j) = I (i′, j′) iff i = 2i′ and j = 2j′ I(i′,j′)+I(i′,j′+1) 2 iff i = 2i ′+ 1 and j = 2j′ I(i′,j′)+I(i′+1,j′) 2 iff i = 2i ′ and j = 2j′+ 1 I(i′,j′)+I(i′+1,j′)+I(i′,j′+1)+I(i′+1,j′+1) 4 iff i = 2i ′+ 1 and j = 2j′+ 1 (1)
The extrapolation can be extended to any needed scale factor.
3.2 Average Image
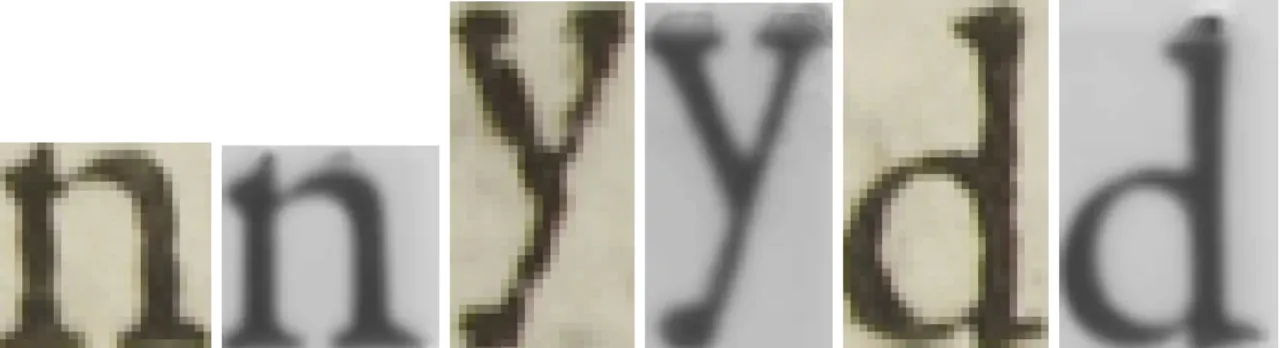
In order to compensate for the large variability between individual shapes for each character, we compute the average grey level image over all instances. The combined result of resolution enhancement and average shape computation is shown in Fig. 7. While it is clear that the averaging greatly improves the regularity of the shapes and removes the ruggedness of the contours, there are two side effects that need to be observed.
Figure 7. Comparison between individual instances of characters, and their higher resolution, averaged counterparts
First, one can notice artefacts at the top of the averaged images. These are the result of segmentation issues that propagate from the character extraction process. Indeed, the individual bounding boxes are not normalised, and may (or may not) be touching the printed shape. This requires the averaging algorithm to extrapolate pixels on the boundary, for which we have currently not yet implemented a smoothing algorithm. This problem will be addressed in further work and is purely related to low-level image processing.
Second, however, there is a more “semantical” side effect, that may have a greater impact on the typographical interpretations of the extracted shapes. The effects are most visible on the in and out serifs of the ‘d’. The smoothing effect that is beneficial for removing the overall ruggedness of the shapes also smooths the more prominent features of the font. This is exacerbated by the fact that the document we are treating seems to have been mixing two slightly distinct font types for the letter ‘d’ (note the presence or absence in slant for the in serif, in Fig. 6: for d1 and d3the serif is horizontal, for d2 and d4 it is oblique). The averaging process will tend
to create a smoothed combination of both, which becomes inconsistent with respect to typography. The effect is not noticeable for the ‘n’ in Fig. 7.
4. CONTOUR APPROXIMATION
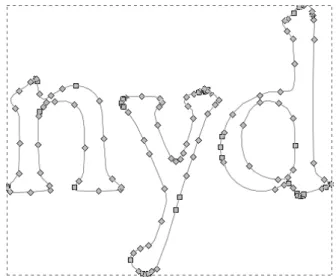
Now that we have clean and sufficiently consistent data to work with (disregarding the previously mentioned problem with le letter ‘d’) we can start extracting information that can characterise the font. The first step will consist of vectorising the character contours using B-Splines.20, 21 To achieve this we have used Potrace,22a
freely available tool, specifically tuned toward character vectorisation. The result is shown in Fig. 8. It is stored in SVG and can be readily imported into typeface design software.
Figure 8. SVG contour approximation of average shapes
From this point, a font designer can edit and correct shape artefacts, or adjust smoothing effects observed earlier. As we shall show in § 7, these edits can then be further used to fine-tune the segmentation and extraction process, for instance. It is also interesting to observe the vectorisation of the letter ‘n’ in Fig. 8 and relate it to the experiment reported in § 1.2.2. Indeed, the control points lie in the general area of those identified by human typographers. At this stage it is not quite possible to further evaluate the perceived quality of the vectorization with respect to human acceptability since, as we have pointed out earlier, there is a large discrepancy in human interpretation criteria on the one hand, et very often they are related to a specific application context on the other. Further work will integrate evaluations of human perceived quality of this vectorisation.
5. SKELETON EXTRACTION
Since many of the features we need to compute (cf. § 1.2.2) or even font representation languages like META-FONT,23 rely on stroke descriptions characterised by their skeletons and associated stroke widths, we have also implemented standard skeleton detection24, 25 on the average shapes by using the ImageJ library†. The results
can be observed in Fig. 6. The skeleton (and associated distance transform) provides the basis for stroke width computation and stem localisation. The lower part of Fig. 6 shows the areas of maximal stroke width, as well as the parts of the skeleton that can be identified as straight lines.
†
At this point, we have all the required information to compute more detailed typographical parameters, such as average stroke width, the dynamics of arcs and bowls, the slant of stems, etc.
6. BASELINE COMPUTATION
One of the drawbacks of the segmentation and character extraction software15–17 is that the extracted image
snippets are not always consistently aligned. This, in its turn, creates blurring side effects for the average shape computation in § 3.
Figure 9. Illustration of the baseline extraction algorithm. In red: average baseline; in green: median baseline. Zoom shows slight advantage of median baseline computation (right top) and effects of curved pages (right bottom).
As previously mentioned, our goal is to eventually succeed in developing an interactive process that is capable of refining its various treatments, in function of previously lifted ambiguities, errors or incomplete data, guided by the user’s context. Our baseline computation algorithm is one of those examples. Since the previous extraction algorithms15–17already did low level base line extraction, we can build upon them to refine the results, by taking
into account more specific typesetting information. As usual with historical documents, the initial extracted base lines are often imprecise. In our case, there was a strong tendency in over segmentation (e.g. the document in Fig. 9 produces 73 text line blocks, using standard extraction parameters) On the other hand, it quite well succeeds in extracting individual characters.
In order to refine the base line detection, our algorithm operates a k-means clustering on all y coordinates of the extracted character bounding boxes by proceeding as follows:
• retrieve all bottom y coordinates of the extracted character bounding boxes,
• operates a k-means clustering on all y coordinates, with k set to the number of (over segmented) text lines identified by,15–17
• filter out the clusters that only have a very few number of members (in our case < 25); those correspond to descenders,
• for each remaining cluster, compute either the average y value or the median y value.
The obtained results are shown in Fig. 9. One can notice that the median value (in green) is slightly more precise than the average value (in red). It is to be noted that this approach makes the assumption that base lines in the scanned documents are preserved as straight lines, and that the document was placed on a flat surface. The effect of this assumption can be seen in Fig. 9 on the right bottom, there page curvature affects the precision of the extracted baseline.
7. DISCUSSION AND FURTHER WORK
In this paper we have exposed the initial proof-of-concept for a set of tools that will eventually allow for the extraction of typographically significant descriptions of fonts from scanned documents. The presented platform is available for experimentation and testing‡ and will be extended in subsequent research phases.
The current version scans a directory for instances of different scanned similar characters, and then processes them to extract their average shape, contours, B-Spline approximation, skeleton extraction and filtering as well as some basic measurements, like maximal width values and positions.
This, of course, does not qualify as a full font retro-engineering platform. We are currently working on the following topics:
1. As mentioned in § 6 one of the main difficulties related to the computation of the average image is that the extracted snippets are not always correctly aligned. This results in spreaded smoothing of the shape, making it thicker and fuzzier than it should be. The use of the baseline (and the refinement of its computation) for aligning the extracted characters is one of the extensions we are working on, combined with a more elaborate alignment algorithm based on global energy minimisation.
2. From a performance evaluation viewpoint, we are going to conduct an exhaustive evaluation of our approach using modern printed types, for which we can obtain ground truth by comparing the digital typeface model with the data extracted from high quality printed instances of the same typeface, thus removing all artefacts related to document ageing, scanning defects, inking effects and page curvature.
3. Another enhancement of the average image computation consists of using the median value, rather than the average. This can be combined with robust outlier detection, and the expected result consists of being able to filter out the effects observed with multiple font collisions of the letter ‘d’ in Fig. 6.
‡
4. More generally speaking, the use of a refined and robust average or median shape, can then be further used for discrepancy measurement in individual characters, or for the computation of general document quality statistics. These data can then be fed back into the global image analysis process and provide a loopback for detection and extraction refinement.
5. The current version does only consider classes of the same character. However, from a typographical point of view there exists a consistency over the whole font where curvature, thickness and slant is concerned. We therefore need to integrate inter-character constraint propagation and coherence. Again the resulting data can then be used in a loopback mechanism for refining and making the whole extraction and recognition process more robust.
6. A more in-depth study and the subsequent modelling of image degradation effects (related to known effects of ink absorption, ageing, etc.) can be used for improved contour segmentation26, 27and subsequent
refinement of the measurement process.
REFERENCES
[1] Le Bourgeois, F. and Emptoz, H., “DEBORA: Digital AccEss to BOoks of the RenAissance,” International Journal of Document Analysis and Recognition (IJDAR) 9(2-4), 193–221 (2007).
[2] Smith, M., “La typographie face aux écritures anciennes : entre reproduction et transcodage,” Introductory talk at the colloque international Gestion informatisée des écritures anciennes, Université de Tours, Centre d’études supérieures de la Renaissance. (May 2013).
[3] de Montaigne, M., [Les Essais], A Paris, Chez Pierre Rocolet, Imp. & Libraire ordinaire du Roy, au Palais, en la des prisonniers, Paris, 15 juin 1635, chez Toussainct du Bray, ruë Sainct Jacques, aux Espies-meurs et Pierre Ricolet ed. (1580).
[4] Kahan, S., Pavlidis, T., and Baird, H., “On the recognition of printed characters of any font and size,” Pattern Analysis and Machine Intelligence, IEEE Transactions on PAMI-9, 274–288 (March 1987). [5] Cao, H. and Natarajan, P., “Machine-printed character recognition,” in [Handbook of Document Image
Processing and Recognition], Doermann, D. and Tombre, K., eds., 331–358, Springer London (2014). [6] Wayner, P. and Huttenlocher, D., “Image analysis to obtain typeface information,” (Oct. 12 1993). US
Patent 5,253,307.
[7] Zramdini, A. W. and Ingold, R., “Optical font recognition using typographical features,” IEEE Trans. Pattern Anal. Mach. Intell. 20(8), 877–882 (1998).
[8] Zhu, Y., Tan, T., and Wang, Y., “Font recognition based on global texture analysis,” Pattern Analysis and Machine Intelligence, IEEE Transactions on 23, 1192–1200 (Oct 2001).
[9] Jeong, C., Kwag, H., Kim, S., Kim, J., and Park, S., “Identification of font styles and typefaces in printed korean documents,” in [Digital Libraries: Technology and Management of Indigenous Knowledge for Global Access], Sembok, T., Zaman, H., Chen, H., Urs, S., and Myaeng, S.-H., eds., Lecture Notes in Computer Science 2911, 666–669, Springer Berlin Heidelberg (2003).
[10] Shamir, A. and Rappoport, A., “Extraction of typographic elements from outline representations of fonts,” Computer Graphics Forum (proceedings, Eurographics) 15(3), 259–268 (1996).
[11] Herz, I., Coherent Processing of Typographic Shapes, PhD thesis, École Polytechnique Fédérale de Lausanne (1997).
[12] LiVolsi, R., Zanibbi, R., and Bigelow, C. A., “Collecting historical font metrics from google books.,” in [Proceedings of the 21st International Conference on Pattern Recognition, ICPR 2012, Tsukuba, Japan, November 11-15], 351–355, IEEE Computer Society (2012).
[13] Brógáin, S. O., “Typographic measurement: a critique and a proposal,” Professional Printer: Journal of Institute of Printing 27(5), 9–14 (1983).
[14] Van Blokland, E., “On digitization: analysis of the different approaches of several type designers from one single model,” in [Automatic Type Design], Atelier National de Rercherche Typographique, ARTEM, Nancy (6–7 May 2014).
[15] Ramel, J. Y., Busson, S., and Demonet, M. L., “Agora: the interactive document image analysis tool of the BVH project,” in [Document Image Analysis for Libraries, 2006. DIAL ’06. Second International Conference on ], 11 pp.–155 (April 2006).
[16] Roy, P. P., Ramel, J.-Y., and Ragot, N., “Word retrieval in historical document using character-primitives,” in [ICDAR], 678–682, IEEE (2011).
[17] Ramel, J.-Y., Sidere, N., and Rayar, F., “Interactive layout analysis, content extraction, and transcription of historical printed books using pattern redundancy analysis,” LLC 28(2), 301–314 (2013).
[18] Haralambous, Y. and Horne, P., [Fonts & Encodings], O’Reilly Series, O’Reilly Media (2007).
[19] Hassan, T., Hu, C., and Hersch, R. D., “Next generation typeface representations: revisiting parametric fonts,” in [Proceedings of the 10th ACM symposium on Document engineering], 181–184, ACM (2010). [20] Yang, H.-M., Lu, J.-J., and Lee, H.-J., “A bezier curve-based approach to shape description for chinese
calligraphy characters,” in [Document Analysis and Recognition, 2001. Proceedings. Sixth International Con-ference on], 276–280 (2001).
[21] Sarfraz, M. and Khan, M., “An automatic algorithm for approximating boundary of bitmap characters,” Future Generation Computer Systems 20(8), 1327 – 1336 (2004). Computer Graphics and Geometric Mod-eling.
[22] Selinger, P., “Potrace: a polygon-based tracing algorithm,” (2003). Potrace (online), http://potrace. sourceforge.net/potrace.pdf(2009-07-01).
[23] Knuth, D. E., [The Metafont Book], Addison-Wesley Longman Publishing Co., Inc., Boston, MA, USA (1986).
[24] di Baja, G. S. and Thiel, E., “Skeletonization algorithm running on path-based distance maps,” Image and Vision Computing 14(1), 47 – 57 (1996). Image and Vision Computing Journal on Vision-Based Aids for the Disabled.
[25] Choi, W.-P., Lam, K.-M., and Siu, W.-C., “Extraction of the euclidean skeleton based on a connectivity criterion,” Pattern Recognition 36(3), 721 – 729 (2003).
[26] Barney Smith, E. H. and Qiu, X., “Statistical image differences, degradation features, and character distance metrics,” IJDAR 6(3), 146–153 (2003).
[27] Likforman-Sulem, L., Darbon, J., and Barney Smith, E. H., “Enhancement of historical printed document images by combining total variation regularization and non-local means filtering,” Image Vision Com-put. 29(5), 351–363 (2011).