This is an author-deposited version published in: https://sam.ensam.eu Handle ID: .http://hdl.handle.net/10985/12044
To cite this version :
Emmanuel LIZE, Marc REBILLAT, Nazih MECHBAL - Estimation of the temperature field on a composite fan cowl using the static capacity of surface-mounted piezoceramic transducers - In: 20th IFAC World Congress, France, 2017 - 20th IFAC World Congress - 2017
Any correspondence concerning this service should be sent to the repository Administrator : [email protected]
Estimation of the temperature field on a composite fan cowl using the
static capacity of surface-mounted piezoceramic transducers.
Emmanuel LIZÉ*. Marc RÉBILLAT**. Nazih MECHBAL**. Christian BOLZMACHER* *CEA, LIST, Sensorial and Ambient Interfaces Laboratory,
91191 - Gif-sur-Yvette CEDEX, France.
**Processes and Engineering in Mechanics and Materials Laboratory (PIMM, UMR CNRS 8006, Arts et Métiers ParisTech (ENSAM)),
151, Boulevard de l'Hôpital, Paris, F-75013, France. (e-mail: [email protected])
Abstract: The influence of temperature on SHM (Structural Health Monitoring) systems using guided
waves is a major problem for their industrial deployment. One of the most used and cheapest SHM process developed in aeronautic context is based on piezoelectric transducers mounted on the monitored structure. Several methods are then used to assess the presence of damage. A popular one is based on tracking changes in the static capacity of the transducers: it is an efficient damage indicator in close area surrounding the device and is often used as a fault diagnosis of the transducer itself. However, monitoring decision are robustified with temperature sensors also mounted on the structure, adding wires and signal processing post-treatments. In this article, the static capacity is used to determine the temperature on each lead zirconate titanate transducer (PZT). By imparting this additional functionality to PZT devices, supplementary instrumentation is not necessary and an estimation of the entire temperature field of the structure is obtained. The original proposed approach is tested experimentally on a on a small composite plate and then on a large real part of an A380 composite nacelle. The results show that the temperature field on the structure can be estimated with a precision of ±5 °C using a linear regression between static capacity and temperature.
Keywords: aerospace, health monitoring and diagnosis, smart sensors and actuators, networks of sensors
and actuators, piezoceramic devices, temperature effect, electromechanical signature. 1. INTRODUCTION
SHM is an important field for aeronautic industries. The revolution of new technologies and the increasing interest for composite materials and piezoceramic devices lead to the creation of light and large smart structures able to give relevant auto-diagnosis for SHM processes.
Guided wave is one of the most used methods for damage detection and localization. Lead zirconate titanate transducer (PZT) mounted on the structure being monitored is a cheap and easy-to-settle method to trigger and detect waves using the PZT as sensor and actuator.
The electromechanical (EM) signature of PZT devices consists in measuring the impedance of PZTs coupled to the structure under test. This measurement has gained importance in the SHM community (Park et al., 2006, 2003; Venu Gopal Madhav Annamdas and Chee Kiong Soh, 2010) because it can be used as a damage detection method and to evaluate the health degradation of a PZT or its boundary conditions.
In an aeronautical context, the structures are exposed to varying temperatures and heterogeneous fields which have a non-negligible influence on wave propagation, and their
interpretation can lead to false detection (Marzani and Salamone, 2012; Putkis et al., 2015).
The influence of temperature on the EM signature has been the focus of several research teams. Experimental (Lin et al., 2010; Qing et al., 2008; Yang et al., 2008) and numerical studies (Sepehry et al., 2011; Yang and Miao, 2008) pointed out that the static capacity of a PZT increases, and the modal frequencies are lowered when the temperature rises (Balmes et al., 2014; Grisso and Inman, 2010; Overly et al., 2009). Temperature compensation methods have been proposed based on those observations, and studies have been made to distinguish modifications attributable to the presence of damage from modifications due to temperature variations (Grisso and Inman, 2010; Overly et al., 2009; Koo et al., 2008; Zhou et al., 2009). All those studies are efficient in proving the sensitivity of PZT to temperature, but very few works have been carried out to use the PZT as temperature sensors. For instance (Ilg et al., 2013) describes the use of the static capacity of air coupled ultrasound transducers to estimate the temperature of a structure with a precision of ±4.5 °C. Our previous work (Lize et al., 2016) showed good temperature estimation results (±2 °C) on a composite plate but was only realized under homogeneous temperature in an environmental chamber.
of the PZT mounted on a structure for varying temperature. This approach will first be applied on a composite plate under heterogeneous temperature field, and then on a large A380 fan cowl (real part of an airplane nacelle) made of the same composite material.
2. STATIC CAPACITY
2.1 theoretical background
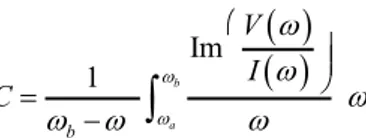
A PZT mounted on a structure can be qualified by its electro-mechanical signature. The impedance 𝑍 of a PZT is defined as the transfer function between the voltage 𝑉 applied to the PZT element and the resulting electrical current 𝐼. The static capacity 𝐶 is defined as the imaginary part of the admittance 𝑌(𝜔) (inverse of the impedance) divided by 𝜔, 𝜔 denoting the angular frequency.
Im( ( ))Y C (1) with ( ) 1 ( ) ( ) ( ) I Y Z
A piezoelectric material is characterized by its electric field strength 𝐸 and the electric charge density displacement 𝐷. The linear electrical behavior of the material and the Hooke’s law lead to the following coupled equations:
T s d E D d E (2)
where 𝜀 is the strain, 𝜎 is the stress 𝑑 is the matrix of direct piezoelectric effect, 𝑑𝑇 is the matrix of the converse
piezoelectric effect, 𝑠𝐸 is the matrix of the elastic
compliance at constant electric field, and 𝜖𝜎 is the matrix of
permittivity at constant stress field.
Fig. 1. Circular PZT bounded to a rigid structure In our case-study, thin circular PZTs are mounted on a rigid structure (Fig. 1) that will not be deformed in the plane direction ( 𝜀1= 𝜀2= 0), and are not constrained in the
out-of-plane direction ( 𝜎3= 0). The electric charge density
displacement can then be written as:
3 31( 1 2 3 3 D d
E with 1 2 31 3 11 12 1 E d E s and 3 V E w (3)where 𝑉 is the voltage applied to the PZT and 𝑤 is the thickness of the PZT. 2 3 31 3 11 12 2 b E SD S d C V s (4)
where 𝑆 is the surface of the PZT.
A free PZT (not bounded to the structure) is not constrained (𝜎 = 0) which means that its capacity 𝐶𝑓 is only defined by:
3 f S C w (5)
The capacity of the bounded PZT can then be expressed as:
b f C C K with 2 31 11 12 2 b E d S K w s (6)
This value of the capacity is purely theoretical, obtained considering a totally rigid structure and a perfect gluing. In application, the value of the capacity should be included between 𝐶𝑏 and 𝐶𝑓.
The variation of the relative permittivity with temperature is given by the constructors. For soft piezoceramic of type 5A, this variation can be considered as linear on a limited range of temperature. The permittivity in terms of temperature 𝜃 can be calculated as:
,
3 ref 1 ref (7)where 𝜃𝑟𝑒𝑓 states for the temperature of reference at which
the PZT parameters are defined and 𝛼𝜖 the temperature
coefficient for permittivity.
Bounding a PZT to a structure causes a drop of its capacity (compared to free conditions). When the bounding is perfect, the slope of the variation of the capacity with temperature is the same for a free or bounded PZT. It means that the term 𝐾𝑏 in (6) does not depend on temperature. The
capacity of the PZT in terms of temperature is calculated using (4) and (7):
ref
c ref C with c S w (8)where 𝛼𝐶 is the temperature coefficient for capacity and
𝐶𝜃𝑟𝑒𝑓 is the static capacity at 𝜃
𝑟𝑒𝑓.
We use (8) to compute an estimation of the temperature 𝜃̂𝑒𝑠𝑡𝑖𝑚 from any static capacity measurement 𝐶𝑚𝑒𝑎𝑠:
ref meas b estim ref c C C (9) 𝑉 𝑆 𝑤 PZT structure 1 2 3
2.2. Experimental approach
In the experimental approach, the static capacity is the mean of the capacity obtained from voltage and intensity measurements on a range of frequencies (𝜔𝑎 to 𝜔𝑏):
Im 1 b a b V I C
(10) Coefficients 𝛼𝐶 and 𝐶𝜃𝑟𝑒𝑓 are determined by applying alinear regression on reference capacity measurements realized at different temperatures (Lize et al., 2016). The linear regression is evaluated with the coefficient of determination 𝑟². This indicator is contained between 0 (erroneous regression) and 1 (perfect fit).
The estimation temperature error is given by difference between the estimated temperature 𝜃̂𝑒𝑠𝑡𝑖𝑚 and the measured
temperature 𝜃𝑚𝑒𝑎𝑠.
3. EXPERIMENTS ON A COMPOSITE PLATE Before applying the approach on real airplane parts, experiments have been realized on a small plate of the same anisotropic composite material.
3.1. Experiments and results
A CFRP plate of four plies [0/−45/45/0] of 0.28 mm each was used for the first experiments. It was instrumented with five Noliac NCE51 PZT (diameter: 20 mm, thickness: 0.5 mm, Curie temperature: 360 °C) and glued with a Redux 322 epoxy adhesive (operating temperature range from −55 °C to 200 °C).
Impedance measurements were realized with a Hioki IM3570 impedance analyser and data processed with Matlab and the static capacity computed using (10) with 800 impedance measurements between 20 kHz and 60 kHz acquired 3 times to increase the signal to noise ratio (SNR). Previous studies on a composite plate with the same dimensions and properties have shown that a linear regression can be applied to the variation of static capacity with temperature. In this previous case, measurements had been done between 10 and 60 °C to determine the linear regression coefficients (Lize et al., 2016).
Before one uses the PZT as temperature sensors, the linear regression parameters 𝛼𝐶 and 𝐶0 are determined under
controlled temperature variations to create the database. In this study, they are determined for each PZT on the structure with experimental measurements of static capacity realized at only three different temperatures: 22, 35 and 42 °C (see Table 1).
It can be noticed from Table 1 that the coefficients for each PZT are close to each other, meaning that they have the same boundary condition and health. The coefficients of determination are high, meaning that the linear regression is well fitted, but this result should be interpreted with great
care considering that only three measurements were used to get the coefficients.
Table 1. Linear regression parameters and coefficient of determination of the capacity variation with temperature
for the five PZT of the composite plate. PZT1 PZT2 PZT3 PZT4 PZT5 𝛼𝐶×10−11(F/°C) 1.32 1.30 1.40 1.34 1.37
𝐶0×10−9(F) 7.38 7.38 7.22 7.22 7.39
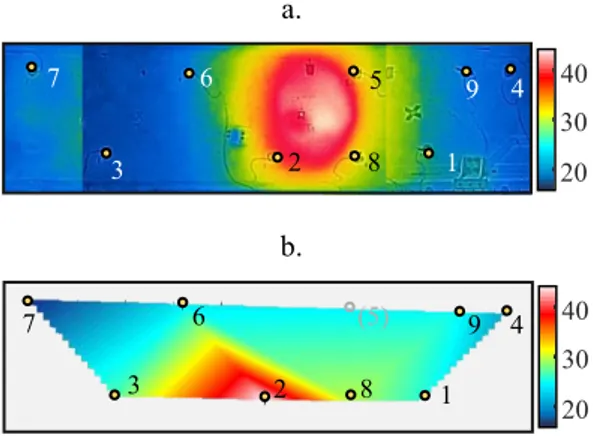
𝑟² 0.98 0.99 0.99 1 1 With this database containing the regression coefficient for each PZT, it is possible to estimate the temperature of the monitored plate under heterogeneous temperature fields (spatial temperature gradient). The temperature field is applied with an infrared lamp of 300 W placed one meter away from the structure and captured using a thermal camera. Fig. 2 and Table 2 is an example of results obtained for a temperature field applied on the composite plate.
a.
b.
Fig. 2. Temperature field on the composite plate obtained with the thermal camera (a.) and estimated
using the static capacity measurements (b.) Table 2. Temperature measured with the thermal camera
(𝜃𝑚𝑒𝑎𝑠) and estimated with the static capacity (𝜃̂𝑒𝑠𝑡𝑖𝑚)
on PZT locations corresponding to Fig. 2
PZT 1 2 3 4 5 𝜃𝑚𝑒𝑎𝑠 (°𝐶) 40,5 32,4 27,6 50,4 32,4 𝜃̂𝑒𝑠𝑡𝑖𝑚 (°𝐶) 43,4 32,8 28 55,4 32,2
30
40
50
1
2
3
4
5
30
40
50
1
2
3
4
5
results: as for the results presented in Table 2, a precision of ±5 °C was obtained.
3.2. Comparison with theoretical values
The values of theoretical capacities for a bounded PZT and a free one presented in Table 4 are obtained using parameters from constructor (see Table 3) and equations (4), (5) and (8).
Table 3. Parameters from the constructor used to compute theoretical values of capacities and
temperature variation coefficient. 𝜃𝑟𝑒𝑓 (°C) 𝜖3𝜎 (F. m−1) 𝑠11 𝐸 (m2. N−1) 𝑠12 𝐸 (m2. N−1) 𝛼𝜖 (K−1) 23 1.68 ×10⁻⁸ 1.7 ×10⁻¹² −5.36 ×10⁻¹² 4.0 ×10⁻³
Table 4. Theoretical values of the capacity and the coefficient of temperature variation. 𝐶𝑏 (F) 𝐶𝑓 (F) 𝛼𝐶 (F. K−1)
5.9×10⁻⁹ 10.6×10⁻⁹ 4.2×10⁻¹¹
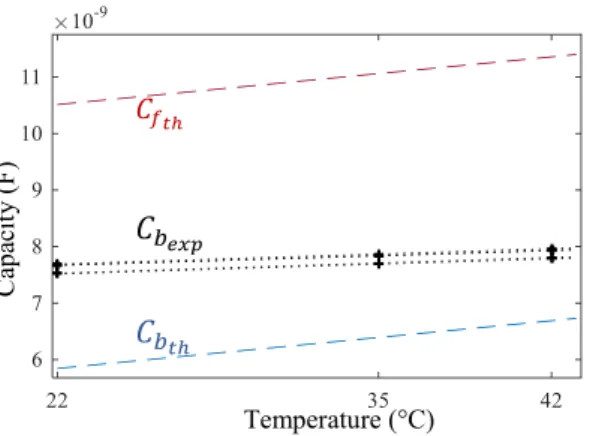
Fig. 3 displays the variation of static capacity in terms of temperature for theoretical values and experimental values of the 5 PZTs mounted on the composite plate.
Fig. 3. Variation of capacity in terms of temperature. Comparison of theoretical and experimental results.
4. EXPERIMENT ON THE FAN COWL
4.1 The structure
The fan cowl is part of the structure embracing the plane reactor (Fig. 4). In application, it is exposed to heterogeneous temperature variation from −40 to 150 °C. The SHM process is really interesting concerning this structure: thanks to guided wave methods with surface mounted PZT, in-situ measurement of delamination can be
Fig. 4. Exploded view of the turbomachine of an Airbus A380 and its nacelle.
The large dimensions of this structure against thickness (diameter: 3.90 m, height: 2.10 m, thickness: 1.12 cm) allows us to think that the behaviour of lamb waves in the fan cowl will be very close to the one in the plate. It is monitored with 30 Noliac NCE51 PZT patches of (diameter: 25 mm, thickness: 0.5 mm ) glued with a Redux 322 epoxy adhesive (Fig. 5a).
a.
b.
Fig. 5. Fan cowl monitored by 30 PZTs (a.) and focus on the test zone used for experiments in this article (b.) In this work, only the results obtained for the test zone shown in Fig. 5b are presented.
4.2 Experimental set-up
The set-up used for the experiments on the fan cowl is the same as the one used on the composite plate (Fig. 6).
𝐶𝑓𝑡ℎ
𝐶
𝑏𝑡ℎ𝐶
𝑏𝑒𝑥𝑝 Temperature (°C) Ca pa cit y (F ) Inlet Cowl Inner Fixed Structure Fan Cowl 3.90 m 3m 0. 45 m 7 6 5 9 4 1 8 2 3Fig. 6. Experimental set-up for impedance measurements
4.3 Creation of the database
The temperature of the fan cowl couldn’t be easily monitored because one must use an environmental chamber large enough for such structure. Therefore, the database was created using 245 measurements realised at ambient temperatures from 15 to 21 °C during three consecutive days to determine the regression coefficient for each PZT (see Table 5). The PZT 5 is not included in the results because a first auto-diagnostic based on the impedance has shown that it is damaged (faulty sensor).
Table 5. regression coefficients and coefficient of
determination for the 8 healthy PZT of the test zone PZT1 PZT2 PZT3 PZT4 𝛼𝐶×10−11 (F/°C) 1.84 1.77 1.16 2.35 𝐶0×10−9(F) 11.3 11.6 11.7 11.5 𝑟² 1 1 1 1 PZT6 PZT7 PZT8 PZT9 𝛼𝐶×10−11 (F/°C) 1.55 1.16 1.66 2.74 𝐶0×10−9(F) 11.5 10.6 10.4 10.3 𝑟² 0.96 1 1 1
4.4 Experiments with homogeneous temperature
First experiments have been performed under a homogeneous temperature on the complete test zone to check the applicability of this technique on the large structure. 54 measurements that were not used for the database creation with temperatures between 15 and 21 °C were used. Fig. 7 shows the distribution of the error of estimation computed for each PZT, and the same precision as the test realised on the plate under homogeneous temperature were found (±2 °C).
4.5 Experiments with a heterogeneous temperature field
Previous experiments and the temperature field estimated on the composite plate let suppose that a heterogeneous temperature field can be estimated on the fan cowl.
Fig. 7. Error of temperature estimation for the 8 healthy PZTs obtained on 54 random measurements between 15
and 21 °C.
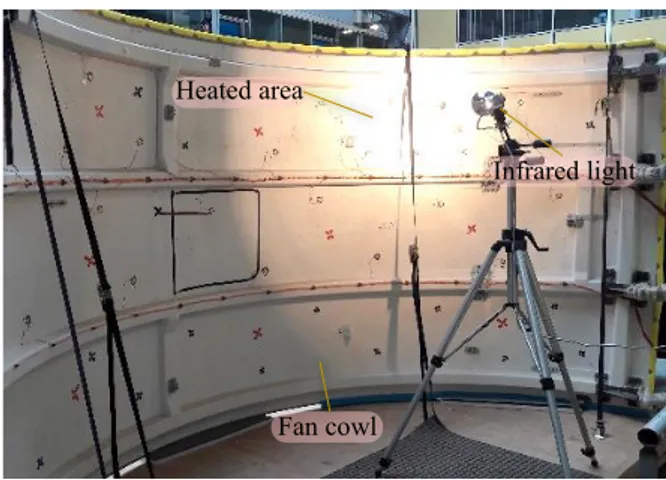
Different temperature field configurations have been tested on the test zone by placing the infrared light at various positions (Fig. 8).
Fig. 8. Set up realised to generate a heterogeneous temperature field on the fan cowl
The thermal images are obtained with a thermal camera (Fig. 9a). The following results (Fig. 9 and Fig. 10) show the temperature field obtained with the thermal camera against the temperature field obtained with the static capacity of the PZT using the same colour scale.
Real temperatures at the PZT transducer locations are determined with the FLIR software which allowed us to measure the real temperature of the structure under test on precise points of the image. Three thermal images are taken on the test zone for a better precision. this way.
The structure was heated 20 minutes with the infrared lamp before the measurements were realised to make sure that the temperature field is stable. The images obtained with the static capacity agrees with the ones of the thermal camera (Fig. 9 and Fig. 10). However, the temperature field obtained with the PZT is slightly less precise because it is obtained with less estimation points.
Acquisition system Impedance analyser multiplexor Fan Cowl PZT E rro r of e stim ati on (° C) Infrared light Fan cowl Heated area
b.
Fig. 9. First configuration of the temperature field. Temperature field obtained with the thermal camera (a.)
and with the static capacity of PZT (b.)
Table 6. Temperature measured with the thermal camera
(𝜃𝑚𝑒𝑎𝑠) and estimated with the static capacity (𝜃̂𝑒𝑠𝑡𝑖𝑚) on
PZT locations corresponding to Fig. 9
PZT 1 2 3 4 6 7 8 9 𝜃𝑚𝑒𝑎𝑠 (°C) 24 37 22 20.3 22.3 17.6 26.6 24 𝜃̂𝑒𝑠𝑡𝑖𝑚 (°C) 24.2 41.2 25.2 20.2 22.9 16.7 28.2 23.5 5. DISCUSSION
In this paper, we propose to further investigate the relation between static capacity of the PZT and the temperature of the structure on which they are mounted.
The slope of the variation of theoretical capacity with temperature is three times higher than the experimental values (Fig. 3), because the model proposed in this article only consider the influence of temperature on the permittivity. The experimental values obtained for capacity are included between the theoretical capacity of a free PZT and a perfectly bounded one. It makes sense because when the bonding conditions get worth, the PZTs tends to behave like a free PZT, and this parameter wasn’t integrated in the model.
The hysteretic behaviour observed by (Ilg et al., 2013) has been noticed on measurements realised on the fan cowl. During the three days of measurements, the static capacity varied linearly with temperature but with different slopes depending on the temperature variation direction. In our previous works (Lize et al., 2016), a precision of ±2 °C on each PZT was obtained, but the measurements used for the test were taken on one cycle (rising and dropping temperature) just after the database had been created, so the hysteretic effect had not a lot of influence on the results. In this study, the precision of ±5 °C (see Table 2) is caused by temperature variations that occurred between the database creation and the test-case recording.
b.
Fig. 10. Second configuration of the temperature field. Temperature field obtained with the thermal camera (a.)
and with the static capacity of PZT (b.)
Table 7. Temperature measured with the thermal camera
(𝜃𝑚𝑒𝑎𝑠) and estimated with the static capacity (𝜃̂𝑒𝑠𝑡𝑖𝑚) on
PZT locations corresponding to Fig. 10
PZT 1 2 3 4 6 7 8 9
𝜃𝑚𝑒𝑎𝑠
(°C) 32 17.2 20 28.7 18.5 17.8 20.7 42 𝜃̂𝑒𝑠𝑡𝑖𝑚
(°C) 38.5 18.7 22.4 28.1 18.2 16.1 20.6 41.7 For the measurements on the fan cowl, a good precision is obtained for low temperatures (±2 °C), but less precision is obtained for higher temperatures (see PZT 2 in Table 6 and PZT 1 in Table 7). Considering the results displayed in Table 5 and Fig. 7, it can be noticed that the higher the coefficient of variation 𝛼𝐶 is, the more precision we get.
Measurements on a too small range (7 °C ) is not enough to get a robust evaluation of the linear regression coefficients. Further studies using a large heating mat will allow us to generate a larger and controlled temperature variation for the database creation.
PZT transducers cannot be used as reliable temperature sensors since the temperature field can be estimated with a precision of ±5 °C (Table 6 and Table 7), but this is enough for the targeted application that is robustifying SHM systems based on PZT and Lamb waves without adding supplementary temperature sensors.
Other features obtained from lamb waves measurements - such as time-of-arrival of the waves or the frequency shift of the transfer function - could also be used to have an estimation of the temperature field between two PZTs and increase the robustness of the temperature estimation and the number of sensing points on the structure.
In the presented approach, the static capacity is computed with impedance measurements on a large range of frequencies (from 20 to 60 kHz ) on contrary to (Ilg et al., 2013) who only considered a single measurement at 1 kHz . We could have used only one frequency for impedance measurements but using the mean on a range makes the
7 6 5 9 4 1 8 2 3 20 30 40 7 6 (5) 9 4 1 8 2 3 20 30 40 7 6 5 9 4 1 8 2 3 20 30 40 7 6 (5) 9 4 1 8 2 3 20 30 40
static capacity measurement less vulnerable to other temperature effect or presence of damage (Koo et al., 2008). As it is pointed out by (Overly et al., 2009), it is important that the PZT are healthy to use this method because a damage or change in bonding conditions of the PZT will have an influence on the static capacity: 𝐶0 for each PZT
increases as the bonding is deteriorated and decreases when the PZT breaks, but the coefficient of temperature variation 𝛼𝐶 is not really affected. The coefficients obtained for the
PZT on the composite plate (Table 1) are quite similar compared to those of the test zone (Table 5). A small difference is accountable for the PZT dimensions considering (4). Differences between coefficients of identical PZTs might be due to different boundary conditions and material anisotropy. For both structures, the coefficients of determination 𝑟2 are high for every PZT,
meaning that the linear regression is a good model (see Table 1 and Table 5).
The experiments presented on the fan cowl deal with temperatures between 15 and 50 °C which is less than the extreme temperatures reachable during operation. Tests on the small plate in an environmental chamber showed that the linear regression was accurate between −10 and +100 °C but the authors cannot guarantee that the linear regression is still a good model for temperatures exceeding this range.
6. CONCLUSION
Using measurements from the PZT for temperature estimation enables to get rid of supplementary temperature sensors and include a weight gain by using devices that are already mounted on the structure. The sensor network gives the opportunity to have a lot of sensing spots, leading to the imaging of the temperature field of the structure being monitored.
REFERENCES
Balmes, E., Guskov, M., Rebillat, M., Mechbal, N., 2014. Effects of temperature on the impedance of piezoelectric actuators used for SHM.
Fendzi, C., 2015. Contrôle Santé des Structures Composites: application à la Surveillance des Nacelles Aéronautiques. Paris, ENSAM.
Grisso, B.L., Inman, D.J., 2010. Temperature corrected sensor diagnostics for impedance-based SHM. Journal of Sound and Vibration 329, 2323–2336.
Ilg, J., Rupitsch, S.J., Lerch, R., 2013. Impedance-Based Temperature Sensing With Piezoceramic Devices. IEEE Sensors Journal 13, 2442–2449.
Koo, K.-Y., Park, S., Lee, J.-J., Yun, C.-B., 2008. Automated Impedance-based Structural Health Monitoring Incorporating Effective Frequency Shift for Compensating Temperature Effects. Journal of Intelligent Material Systems and Structures 20, 367– 377.
Lin, B., Giurgiutiu, V., Pollock, P., Xu, B., Doane, J., 2010. Durability and Survivability of Piezoelectric Wafer Active Sensors on Metallic Structure. AIAA Journal 48, 635–643.
Lize, E., Hudin, C., Guenard, N., Rebillat, M., Mechbal, N., Bolzmacher, C., 2016. Combination Of Frequency Shift And Impedance-Based Method For Robust Temperature Sensing Using Piezoceramic Devices For Shm.
Marzani, A., Salamone, S., 2012. Numerical prediction and experimental verification of temperature effect on plate waves generated and received by piezoceramic sensors. Mechanical Systems and Signal Processing 30, 204– 217.
Overly, T.G., Park, G., Farinholt, K.M., Farrar, C.R., 2009. Piezoelectric Active-Sensor Diagnostics and Validation Using Instantaneous Baseline Data. IEEE Sensors Journal 9, 1414–1421.
Park, G., Farrar, C.R., Rutherford, A.C., Robertson, A.N., 2006. Piezoelectric Active Sensor Self-Diagnostics Using Electrical Admittance Measurements. Journal of Vibration and Acoustics 128, 469.
Park, G., Sohn, H., Farrar, C.R., Inman, D.J., 2003. Overview of piezoelectric impedance-based health monitoring and path forward.
Putkis, O., Dalton, R.P., Croxford, A.J., 2015. The influence of temperature variations on ultrasonic guided waves in anisotropic CFRP plates. Ultrasonics 60, 109–116. Qing, X.P., Beard, S.J., Kumar, A., Sullivan, K., Aguilar,
R., Merchant, M., Taniguchi, M., 2008. The performance of a piezoelectric-sensor-based SHM system under a combined cryogenic temperature and vibration environment. Smart Materials and Structures 17, 055010.
Sepehry, N., Shamshirsaz, M., Bastani, A., 2011. Experimental and theoretical analysis in impedance-based structural health monitoring with varying temperature. Structural Health Monitoring 10, 573–585. Venu Gopal Madhav Annamdas, Chee Kiong Soh, 2010. Application of Electromechanical Impedance Technique for Engineering Structures: Review and Future Issues. Journal of Intelligent Material Systems and Structures 21, 41–59.
Yang, Y., Lim, Y.Y., Soh, C.K., 2008. Practical issues related to the application of the electromechanical impedance technique in the structural health monitoring of civil structures: I. Experiment. Smart Materials and Structures 17, 035008.
Yang, Y., Miao, A., 2008. Effect of External Vibration on PZT Impedance Signature. Sensors 8, 6846–6859. Zhou, D., Kim, J.K., Ha, D.S., Quesenberry, J.D., Inman,
D.J., 2009. A system approach for temperature dependency of impedance-based structural health monitoring. Proc. SPIE, 7293, 72930U-72930U-10