A System-Level Methodology for the Design and
Deployment of Reliable Low-Power Wireless Sensor
Networks
by
Oussama BRINI
THESIS PRESENTED TO ÉCOLE DE TECHNOLOGIE SUPÉRIEURE IN
PARTIAL FULFILLMENT OF THE REQUIREMENTS FOR A MASTER’S
DEGREE WITH THESIS IN ELECTRICAL ENGINEERING
M. A. SC.
MONTREAL, APRIL 2
ND, 2019
ÉCOLE DE TECHNOLOGIE SUPÉRIEURE
UNIVERSITÉ DU QUÉBEC
This Creative Commons licence allows readers to download this work and share it with others as long as the author is credited. The content of this work can’t be modified in any way or used commercially.
BOARD OF EXAMINERS (THESIS M.SC.A.) THIS THESIS HAS BEEN EVALUATED BY THE FOLLOWING BOARD OF EXAMINERS
Mr. Frederic Nabki, Thesis Supervisor
Department of Electrical Engineering at École de technologie supérieure
Mr. Dominic Deslandes, Thesis Co-supervisor
Department of Electrical Engineering at École de technologie supérieure
Mr. Ricardo Izquierdo, President of the Board of Examiners
Department of Electrical Engineering at École de technologie supérieure
Mr. Georges Kaddoum, Member of the jury
Department of Electrical Engineering at École de technologie supérieure
THIS THESIS WAS PRESENTED AND DEFENDED
IN THE PRESENCE OF A BOARD OF EXAMINERS AND PUBLIC ON MAI 1ST, 2019
ACKNOWLEDGMENT
First, I would like to thank my advisors Prof. Frederic Nabki and Prof. Dominic Deslandes for their support, guidance, time, and ideas throughout all the period of the program. Both advisors empowered me to push the limits of my knowledge and helped me to shape my ideas.
Special thanks to my parents and two brothers for their advices, constant support, patience and encouragement over the years. I would also like to take this opportunity to thank all my big family members and friends for their amazing support throughout my studies.
Finally, I wish to thank each member of the committee for agreeing to devote time to examining this work and for their helpful comments and suggestions.
Méthodologie pour la conception et le déploiement de réseaux de capteurs sans fil fiables et de faible puissance
Oussama BRINI
RÉSUMÉ
Les applications innovantes de l’internet des objets (Internet of Things, IoT) avec des exigences strictes en termes de performances et de consommation d'énergie et pour lesquelles la collecte agile de données est primordiale sont stimulantes. Les réseaux de capteurs sans fil (Wireless Sensor Networks, WSN) représentent une solution prometteuse car ils peuvent être facilement déployés pour détecter, traiter et transmettre des données. Le grand nombre de nœuds de capteurs (Sensor node, SN) composant un réseau de capteurs sans fil devrait être autonome, la durée de vie d'un nœud étant dictée par la taille de la batterie. La taille du nœud étant essentiel dans divers cas d'utilisation tels que l'automatisation de bâtiments et d’industries, il est prioritaire de réduire la consommation d'énergie tout en garantissant la disponibilité du réseau. De plus, les techniques de récupération d'énergie (Energy Harvesting, EH) sont de plus en plus considérées comme une solution prometteuse pour construire un nœud entièrement autonome et prolonger sa durée de vie. Dans le processus de construction d'un nœud et en l'absence d'une méthodologie claire et complète, le concepteur peut facilement prendre des décisions non fondées sur les bons composants matériels, leur configuration et les techniques de communication de données fiables telles que la requête automatique de répétition (Automatic Repeat Request, ARQ) et correction d'erreur directe (Forward Error
Correction, FEC). Dans cette thèse, une méthodologie pour mieux optimiser la conception, la
configuration et le déploiement de WSN fiables à très basse consommation est proposée. Des modèles complets et réalistes d'énergie et d’affaiblissement de propagation (Path Loss PL) du nœud de capteur sont également établis. À l'aide d'estimations et de mesures, il est montré que, conformément à la méthodologie proposée, le concepteur peut explorer en profondeur l'espace de conception, sélectionner et configurer de manière plus optimale les composants commerciaux (Commercial Off-The-Shelf, COTS) disponibles sur le marché et déployer efficacement un réseau de capteurs sans fil.
Mots clés: réseaux de capteurs sans fil, méthodologie de conception, modèle énergétique,
affaiblissement de propagation, faible consommation, conception système, couche de liaison, requête automatique de répétition, correction d'erreur directe.
A System-Level Methodology for the Design and Deployment of Reliable Low-Power Wireless Sensor Networks
Oussama BRINI
ABSTRACT
Innovative Internet of Things (IoT) applications with strict performance and energy consumption requirements and where the agile collection of data is paramount are rousing. Wireless sensor networks (WSN) represent a promising solution as they can be easily deployed to sense, process, and forward data. The large number of Sensor Nodes (SNs) composing a WSN are expected to be autonomous, with a node's lifetime dictated by the battery's size. As the form factor of the SN is critical in various use cases such as industrial and building automation, minimizing energy consumption while ensuring availability becomes a priority. Moreover, energy harvesting techniques are increasingly considered as a viable solution for building an entirely green SN and prolonging its lifetime. In the process of building a SN and in the absence of a clear and well-rounded methodology, the designer can easily make unfounded decisions about the right hardware components, their configuration and data reliable data communication techniques such as automatic repeat request (ARQ) and forward error correction (FEC). In this thesis, a methodology to better optimize the design, configuration and deployment of reliable ultra-low power WSNs is proposed. Comprehensive and realistic energy and path-loss (PL) models of the sensor node are also established. Through estimations and measurements, it is shown that following the proposed methodology, the designer can thoroughly explore the design space and make most favorable decisions when choosing commercial off-the-shelf (COTS) components, configuring the node, and deploying a reliable and energy-efficient WSN.
Keywords: wireless sensor networks, design methodology, energy model, path-loss, link
layer, low-power, system-level design, automatic repeat request, forward error correction.
TABLE OF CONTENTS
Page
CHAPTER 1 INTRODUCTION ...1
1.1 Applications of Wireless Sensor Networks and Their impact ...1
1.1.1 Wireless Sensor Networks Uses Cases in Smart Cities ... 2
1.1.2 Economic and Social impact ... 4
1.2 Motivation ...5
1.3 Main Contributions ...5
1.4 Thesis Outline ...6
CHAPTER 2 THEORETICAL BACKGROUND ...7
2.1 Design Challenges ...7
2.1.1 Energy Consumption and Network Lifetime Maximization ... 8
2.1.2 Meeting quality of service (QoS) requirements ... 9
2.2 Bit and Packet Error Mitigation Techniques ...11
2.2.1 Packet Retransmission Techniques ... 11
2.2.1.1 Blind retransmissions (BR) ... 11
2.2.1.2 ARQ-Based Retransmissions ... 12
2.2.2 Forward Error Correction (FEC) ... 14
2.3 Popular Low-Power Wireless Communication Standards ...15
2.3.1 Bluetooth ... 15
2.3.2 IEEE 802.15.4 ... 17
CHAPTER 3 LITERATURE REVIEW ...21
3.1 Energy Consumption Modeling and Estimation in WSN ...21
3.2 Path Loss Modeling ...23
3.3 Energy cost versus QoS trade-off ...25
CHAPTER 4 SYSTEM-LEVEL DESIGN METHODOLOGY ...29
4.1 Sensor Node Energy Model ...29
4.1.1 Modeling Framework... 30
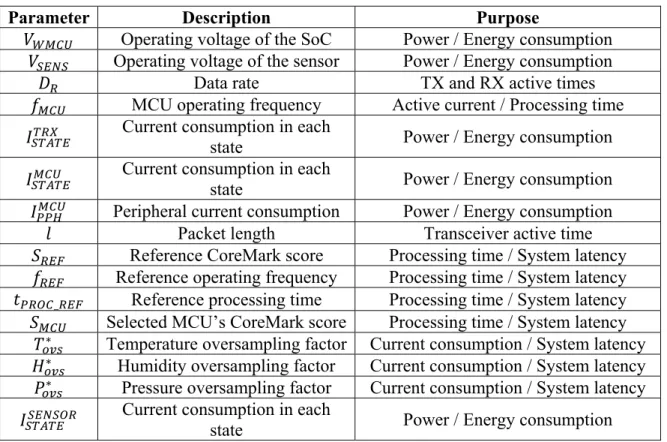
4.1.2 Energy Model Parameters ... 31
4.1.3 Analytical Energy Model ... 32
4.1.3.1 Micro-Controller Unit (MCU) ... 33
4.1.3.2 Wireless Transceiver and Sensor ... 39
4.1.4 Sensor Node Energy per Measurement... 42
4.2 Outdoor Measurements and Wireless Link Characterization ...44
4.2.1 Ambient Noise Density Measurements ... 46
4.2.2 Communication Range Outdoor Measurements ... 49
4.2.2.1 Suburban Area ... 49
4.2.2.2 Urban Area ... 50
4.2.2.3 Experimental Results ... 51
4.3 Data Rate Maximization ...54
4.4 Energy-Reliability-Latency Trade-Off ...55
4.4.1 Current Consumption Profile of Different Data Transfer Schemes ... 56
4.4.2 Packet Success Probability ... 57
4.4.2.1 Convolutional FEC ... 58
4.4.2.2 Blind Retransmissions (BR) ... 60
4.4.2.3 ARQ Retransmissions ... 62
4.5 Resulting Design Methodology and Case Studies ...65
4.5.1 Design Flow and Methodology ... 65
4.5.2 Case Studies ... 66
4.5.2.1 99% Reliability Target ... 67
4.5.2.2 99.999% Reliability Target ... 70
4.6 Conclusion and Discussion ...72
CHAPTER 5 CONCLUSION AND FUTURE WORK ...73
5.1 Conclusion ...73
5.2 Future Work ...75
ANNEX I PUBLISHED CONFERENCE PAPER ...77
ANNEX II C CODE: BME280 SENSOR DATA COMMUNICATION ...83
ANNEX III SENSOR NODE MODEL USING STATEFLOW ...87
ANNEX IV NOISE DENSITY MEASUREMENT PROCEDURE ...89
LIST OF TABLES
Page
Table 2.1 Latency requirement of WSN applications ...9
Table 2.2 Reliability requirement of smart grid applications ...10
Table 4.1 Energy model parameters ...32
Table 4.2 Current consumption of two different MCUs at 26MHz ...33
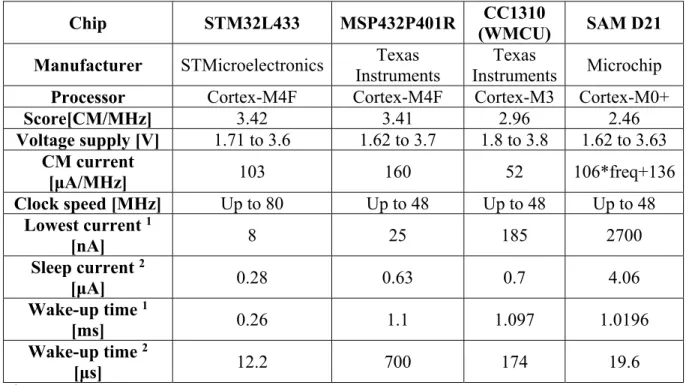
Table 4.3 A survey on low-power COTS microcontrollers ...34
Table 4.4 Accurate current consumption estimation using CM ...34
Table 4.5 A survey on low-power COTS Sub-1 GHz transceivers ...40
LIST OF FIGURES
Page
Figure 1.1 WSN applications in smart cities ...2
Figure 1.2 WSN connection to data base and cloud platforms ...3
Figure 2.1 WSN protocol stack ...7
Figure 2.2 Packet stream example of the BR operation ...12
Figure 2.3 Packet stream example of the SAW-ARQ operation ...12
Figure 2.4 Packet stream example of the L-REP-ACK ...13
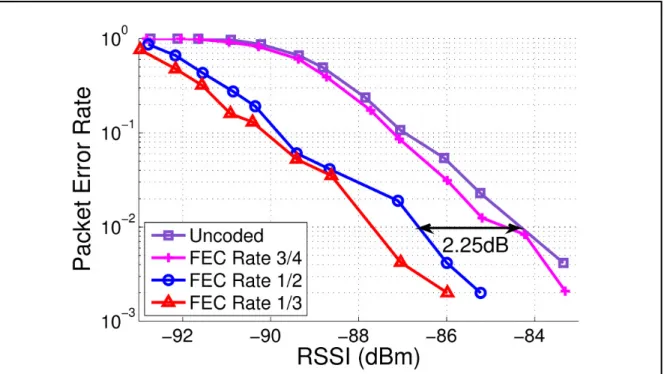
Figure 2.5 Measured packet error rate (PER) curves for a convolutional (FEC) code of rate=3/4, 1/2 and 1/3 compared with uncoded packets’ transmission ...15
Figure 4.1 The three main modeled components of an SN ...29
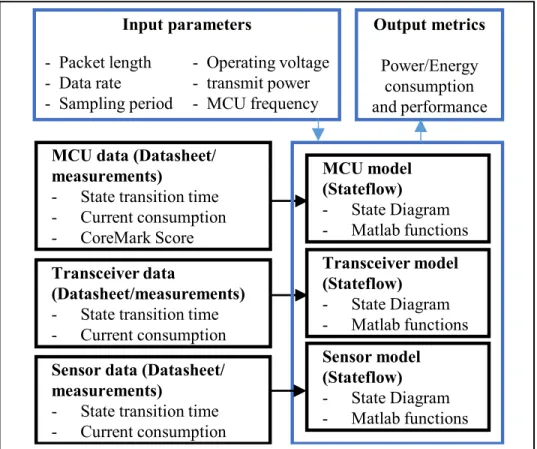
Figure 4.2 A Power/Energy consumption assessment framework based on Stateflow/Simulink ...30
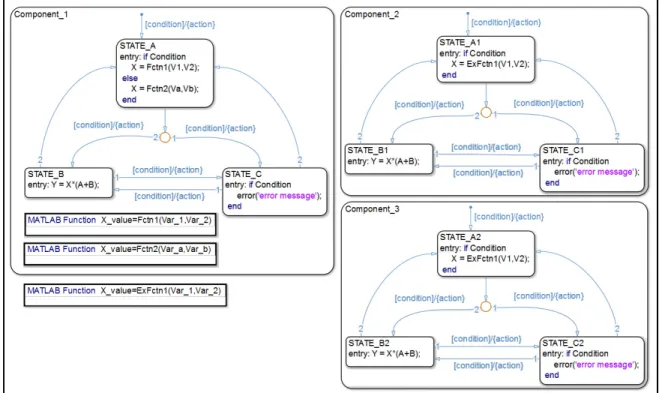
Figure 4.3 A general sensor node energy model using Stateflow charts ...31
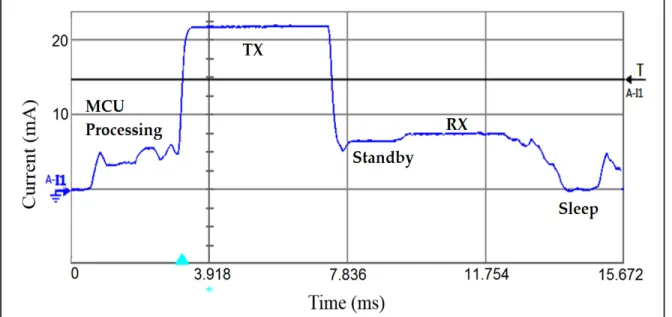
Figure 4.4 Current consumption measurement setup of the CC1310 wireless MCU while performing a point-to-point communication of an internal temperature sensor data and running the TI 15.4 network stack ...35
Figure 4.5 Clear representation of the connections ...35
Figure 4.6 Current consumption profile of the CC1310 wireless MCU on the transmitter’s side ...36
Figure 4.7 Processing-time estimation using the CM/MHz figure (a) when the FPU is disabled and (b) when it is enabled ...38
Figure 4.8 Measurement setup for transceiver and sensor current measurement ...39
Figure 4.9 Current consumption breakdown of the sensor, transmitter, and receiver during one measurement ...41
Figure 4.11 Energy consumption per measurement at 50 kbps ...43 Figure 4.12 Energy consumption per measurement at 500 kbps ...44 Figure 4.13 Communication range measurement setup ...44 Figure 4.14 Background noise samples measured in three distribution environments.
(a) Power grid distribution substation. (b) Low-voltage transformer. (c) Distribution lines in a residential area ...46 Figure 4.15 Relative frequency distributions of the background noise strengths
measured in three distribution environments. (a) Power grid distribution substation (b) Low-voltage transformer. (c) Distribution lines in a
residential area ...47 Figure 4.16 Measurement setup of the ambient noise ...48 Figure 4.17 Packet format used in outdoor measurements ...49 Figure 4.18 Google satellite image of the field measurement setup in the suburban
area ...50 Figure 4.19 Google satellite image of the field measurement setup in the urban area .50 Figure 4.20 BER, PER, and RSSI field measurements in (a) the urban and (b) the
suburban areas ...51 Figure 4.21 The measured path-loss versus the free-space and estimated ones in the
(a) urban and (b) suburban areas ...53 Figure 4.22 BER performance of GFSK ...55 Figure 4.23 Current consumption profile of the transmitter and the receiver when
using different data transfer schemes: (a) simple transmissions, (b) FEC, (c) two BR, and (d) a SAW-ARQ protocol (also referred to as 1-Rep-ACK in this work) ...56 Figure 4.24 MCU energy consumption per measurement for different data transfer
schemes ...57 Figure 4.25 Impact of the free distance on the packet success probability ...58 Figure 4.26 Impact of the parameter on the packet success probability ...60 Figure 4.27 Impact of the number of blind transmission attempts on the packet
XVII
Figure 4.28 Impact of the number of 1-Rep-ACK transmission attempts on the packet success probability ...63 Figure 4.29 Packet success probability at the ℎ packet ...64 Figure 4.30 SN design flow graph...65 Figure 4.31 Meeting 99% reliability target by using FEC, BR, and 2-Rep-ACK
retransmissions (L = 2) ...68 Figure 4.32 Meeting 99% reliability target by using FEC, BR, and 1-Rep-ACK
retransmissions (L = 1) ...68 Figure 4.33 (a) Energy consumption per measurement and (b) system latency for
99% reliability target ...69 Figure 4.34 Meeting 99.999% reliability target by using BR and 4-Rep-ACK
retransmissions ...70 Figure 4.35 Meeting 99.999% reliability target by using BR and 3-Rep-ACK
retransmissions ...71 Figure 4.36 (a) Energy consumption per measurement and (b) system latency for
LIST OF ABREVIATIONS
IoT Internet of Things
WSN Wireless Sensor Network
SN Sensor Node
ARQ Automatic Repeat Request
SAW-ARQ Stop-And-Wait Automatic Repeat Request FEC Forward Error Correction
CM CoreMark
EEMBC Embedded Microprocessor Benchmark Consortium
PL Path Loss
QoS Quality of Service
RTOS Real Time Operating System MAC Medium Access Control LOS Line-Of-Sight NLOS Non-Line-Of-Sight COTS Commercial Off-The-Shelf
MCU Micro-Controller Unit
CPU Central Processing Unit
I2C Inter-Integrated Circuit
RF Radio Frequency
CRC Cyclic Redundancy Check DUT Device under Test
FPU Floating Point Unit BLE Bluetooth Low Energy
WMCU Wireless Micro-Controller Unit BER Bit Error Rate
PER Packet Error Rate
RSSI Received Signal Strength
SINR Signal-to-Interference-plus-Noise Ratio GFSK Gaussian Frequency Shift Keying BSC Binary Symmetric Channel ACK Acknowledgement NACK Non-Acknowledgement
SC Smart City
E2E End-to-End
LL Link Layer
UAV Unmanned Aerial Vehicle
TRPL Two-Ray Path Loss
URLLC ultra-reliable and low-latency communication ISM Industrial, Scientific and Medical
LIST OF SYMBOLS
V Wireless MCU operating voltage V Sensor operating voltage
D Data rate
f MCU operating frequency
I Transceiver current consumption in each state I MCU current consumption in each state I MCU peripheral current consumption l Packet length
S Reference CM score
f Reference operating frequency t _ Reference processing time
S MCU CM score
T Temperature oversampling factor H Humidity oversampling factor P Pressure oversampling factor
I Sensor current consumption in each state
t MCU processing time
E MCU energy consumption per measurement I MCU current consumption when running CM E Transceiver energy consumption
I Sensor current consumption E Sensor energy consumption t Transceiver active time
I Transmitter active current consumption I Receiver active current consumption
t Sensor active time
I Temperature measurement current consumption I Pressure measurement current consumption
I Humidity measurement current consumption Np Total number of packets
Np Corrupted packets
N Number of payload bits
RSSI Received signal strength indicator
RSSI Average received signal strength indicator
i Packet index
N Ambient noise
k Boltzmann constant
T Ambient temperature
ΔN Noise density due to interfering emissions in the same frequency band
Hz Hertz
dB/Hz Decibel per hertz
B Bandwidth
P Noise power
log Decimal logarithm % Percentage A Ampere CM/MHz CoreMark per Mega Hertz
GHz Giga Hertz
s Second Kbps Kilobit per second dB Decibel J Joule PL Path-loss PL Measured path-loss d Distance λ Wave length π Pi h Transmitter height
XXIII
h Receiver height l Fitting coefficient
P Transmitter output power
P Received power
N System’s noise power density N Ambient noise density
N Noise figure of the receiver E Energy per bit
P Packet success probability P Bit error probability
N Payload length
n Encoded payload length
k Original payload length before coding K constraint length
d Free distance
r Code rate
G Coding gain
β The total number of non-zero information bits of all paths with a weight of d P Bit error probability when using FEC
P Packet success probability when using FEC
t Active transceiver time when using coded packets l Packet length when using FEC
E Transceiver energy consumption when using FEC
R Transmission times
h Successful packet transmissions
S Random variable
ℕ Set of natural numbers f Probability mass function
t Active transceiver time when using blind retransmissions
E Transceiver energy consumption when using blind retransmissions I Idle mode current
t Time spent in idle mode
P Bit error probability of the feedback channel P SAW-ARQ packet success probability
P SAW-ARQ outage probability j Transmission attempt index
P Packet success probability of ACK/NACK packets N ACK/NACK packets payload length
P SAW-ARQ packet success probability at the j transmission attempt t Active transceiver time when using SAW-ARQ retransmissions
E Transceiver energy consumption when using SAW-ARQ retransmissions I Standby mode current
t Time spent in standby mode
t System’s latency
CHAPTER 1 INTRODUCTION
1.1 Applications of Wireless Sensor Networks and Their impact
Innovative internet of things (IoT) applications with strict performance and energy consumption requirements and where the agile collection of data is paramount are arising. Wireless sensor networks (WSN) represent a promising solution as they can be easily deployed to collect, process, and forward data at a sampling rate required by the application (i.e. every 500 ms). As WSN are low cost and composed of easy to deploy battery-operated devices, they are increasingly being deployed in a broad range of applications such as smart cities (SC) (G. Daniel Costa, 2019; A. Adonay Veiga, 2019), home automation (Oscar Blanco-Novoa, 2018; C. Leech, 2017), industrial automation (F. Dobslaw, 2016; P. Kong, 2017; L. P. I. Ledwaba, 2018; P. Sommer, 2018; W. Sun, 2018; L. D. Xu, 2014), and precision agriculture (M. Bacco, 2018; C. Konstantopoulos, 2016; M. Srbinovska, 2017). This study focuses on the SC use case where WSN are deployed in order to generate data and supply information that is useful for an optimal management of assets and resources in both urban and suburban areas. Therefore, the methodology presented in this thesis can be applied to design wireless sensor nodes which are intended to operate in a duty-cycled manner where the main components would switch between active and sleep states in order to save energy.
In 2014, the administration of the City of Montreal has expressed its desire that Montreal become a leader among other smart cities such as Oslo, Barcelona, and Singapore. To this end, the City of Montreal has decided to develop the "Montréal, Smart City and Digital 2017" strategy and created the Office of the Smart and Digital City. Moreover, as envisioned in (Zoya Sodhi, 2018), smart cities can and should be built through the collaboration of the civil society, academics, the private sector, and public officials. This work is a step towards achieving that goal.
1.1.1 Wireless Sensor Networks Uses Cases in Smart Cities
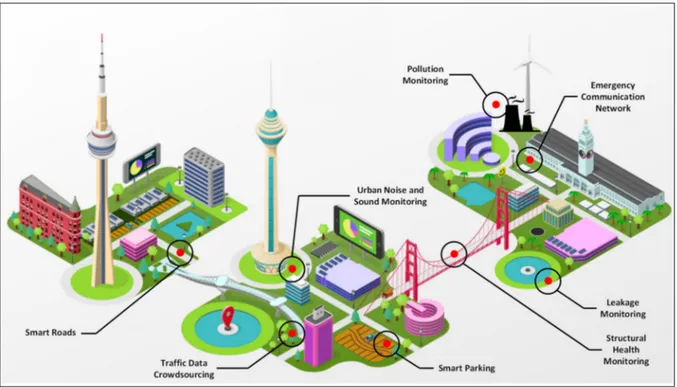
In 2014, the Office of the Smart and Digital City of Montreal started holding civic chats in order to hear different points of views about feasible applications and where integrated and networked intelligent systems can be deployed and create value. Figure 1.1 illustrates the smart city concept and where WSN can be deployed.
Figure 1.1 WSN applications in smart cities Adapted from József Balázs-Hegedűs (2019)
The (http://villeintelligente.montreal.ca) website contains a long list of the suggested ideas and use cases of the aforementioned systems including, but not limited to:
- Establishment of an autonomous and reliable emergency communications network: In emergency situations, information should be accessible to citizens in the shortest possible time.
- Crowdsourcing data on the habits of public transport in order to enhance transportation fluidity.
3
- Sending real time pollution and smog alerts to residents in a specific area through text messages or visual indicators.
- Smart road: displaying real time warning messages for drivers according to climate and road conditions.
- Structural health monitoring of buildings, bridges, historical monuments, etc. - Water or gas leakage monitoring.
- Real time urban noise and sound monitoring.
Clearly, WSN play a key role in achieving all of these goals. They are being increasingly deployed in a broad range of smart urban and suburban applications (G. Daniel Costa, 2019). This is due to the fact that WSNs are low cost and composed of easy to deploy battery-operated devices allowing the collection and forwarding of data in a reliable manner. In a next step, software and big data analytics have the potential to provide finer-grained, wider-scale, real-time understanding and control of urban and suburban environments (Rob Kitchin, 2014).
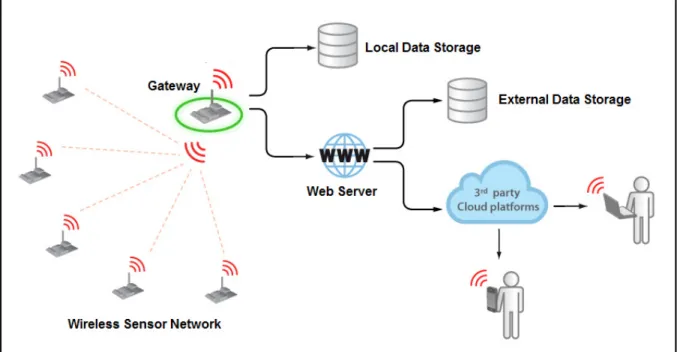
Figure 1.2 WSN connection to data base and cloud platforms Adapted from Libelium (2012)
Figure 1.2 demonstrates how WSN can be connected to data bases and the cloud. A central node called gateway collects the sensor data from the wireless network and forwards them to a cloud application or a data storage device. A cloud platform service provider supports the cloud application services for cloud connectivity and visualization of the sensor node data.
1.1.2 Economic and Social impact
During the last two decades, and mainly due to substantial technological advancements, socio-economic requirements, and the arising of new environmental challenges, metropolitan city-regions are increasingly devoting efforts and resources to develop information and communication technology systems to find better solutions (Rob Kitchin, 2014). The smart city concept has the potential, once implemented, to foster sustainability, social inclusion, and the efficient use of natural resources and infrastructure (A. Adonay Veiga, 2019). Moreover, from a quality of life point of view, citizens and local communities can become more satisfied by the governance of their city when its development is in line with their needs.
Montreal city is a large metropolitan area and is Canada’s second-most populous city. Moreover, the great majority of the civil society of Montreal is immersed in technology. Furthermore, the city is bursting with a wealth of useful data that can, once made available publicly and used to their full potential, simplify the daily life of citizens. Moreover, the city is well-known for its vibrant digital technology sector as it houses many recognized IT companies and local start-ups which can propose more effective ground-breaking solutions and services by exploiting the data generated by WSN and bring those solutions to the global market. Therefore, the city can greatly benefit from data driven and networked intelligent systems both economically and socially. In fact, cities that have introduced digitization, IoT, and SC solutions were able to benefit from an increment of gross domestic product (GDP) by reducing the final operational cost (OPEX) of previous less intelligent systems (Will Serrano, 2018).
5
1.2 Motivation
The motivation of this work comes from the observation that different COTS (e.g. transceivers and MCUs) can be used to design WSN for IoT applications. Moreover, an exhaustive literature survey has shown that a hands-on, fast, and well-rounded system-level design methodology of low-power, real-time, and reliable WSN was still missing. In the process of building a WSN, the designer needs to optimally select the main components out of a myriad of COTS products and account for all the software and hardware solutions concurrently. Moreover, high-level decisions need to be taken early in the design process while bearing in mind the key factors that are not directly comparable (e.g. energy per measurement and distance between nodes) and explore the limitations of the chosen hardware, configuration, and techniques.
1.3 Main Contributions
The main contribution of this thesis is the development of a clear and well-rounded methodology for the design and deployment of reliable low-power wireless sensor networks. To the best of the author’s knowledge, a similar step-by-step and cross-layer design methodology has not been covered in the literature. The design steps that are introduced and explained in this thesis to form the final and well-established methodology are:
• A high level of abstraction energy modeling framework using Simulink/Stateflow is introduced. It allows the creation of energy consumption models of configurable COTS components based on finite state machines and ensures a high degree of modeling flexibility;
• A valid analytical energy model of the sensor node is proposed. It gives a good estimation of the overall and component-level energy consumption;
• Outdoor measurements are carried out in both urban and suburban areas in the city of Montreal in order to characterize the wireless link. Moreover, an empirical path loss model is proposed;
• The quality of service performance and energy efficiency of difference error mitigation techniques, namely forward error correction (FEC), blind retransmissions (BR), and the feedback-based automatic repeat request (ARQ) protocol, and a modified version of the latter are modeled and compared.
1.4 Thesis Outline
The remainder of this thesis is organized into 4 chapters. In chapter 2, a theoretical analysis as well as the design challenges are introduced. Firstly, the requirements in terms of energy efficiency and QoS are explained. Secondly, the theoretical background of three error mitigation techniques, namely FEC, BR, and ARQ is covered. Lastly, two popular wireless communication standards are studied.
Chapter 3 summarizes the literature review and the recent developments of reliable and low-power WSN design methodologies. Different models and frameworks will be presented and their advantages and drawbacks will be discussed.
Chapter 4 is based on a submitted manuscript for publication in a peer reviewed journal. It includes all of the aforementioned thesis contributions. Firstly, the modeling framework is introduced and the analytical energy models are presented. Secondly, the outdoor measurements are showcased and discussed and an empirical path loss model is proposed. Thirdly, the error correcting capability of the previously mentioned techniques is investigated and modeled. Finally, the resulting design methodology is summarized and supported by case studies.
Chapter 5 concludes this thesis and includes recommendations about future research, investigations, and enhancements.
CHAPTER 2
THEORETICAL BACKGROUND 2.1 Design Challenges
WSNs represent a promising solution for monitoring and closed loop control applications as they can be easily deployed to sense, process, and forward data in a flexible and cost-effective way. The large number of Sensor Nodes (SNs) composing a WSN are expected to be autonomous, with a node's lifetime dictated by the battery's capacity.
Figure 2.1 WSN protocol stack
As the form factor of the SN is critical in various use cases, minimizing energy consumption while ensuring reliability and latency requirements becomes a priority. Moreover, energy harvesting techniques are increasingly considered as a viable solution for building an entirely green SN and prolonging its lifetime. Furthermore, since a SN is intended to operate as part of a big network of other SNs, the energy consumption is considerably affected by the wireless channel condition and the distance between the nodes when strict QoS requirements, namely, reliability and latency need to be met. In the process of building a SN and in the absence of a clear and well-rounded methodology, the designer can easily make unfounded and suboptimal decisions about the right hardware components, their configuration and reliable data communication techniques, such as ARQ and FEC.
Application Layer
Transport Layer
Network Layer
Data Link Layer
As a result, all of the aforementioned challenges are most adequately addressed if the communication layers presented if Figure 2.1 are optimized concurrently. In this work, both the physical and data link layers are addressed. This technique is referred to as cross-layer optimization in the literature (S. Biswas, 2018; F. Dobslaw, 2016; N. Michelusi, 2015; F. Rosas, 2016; Batoul Sarvi, 2017; X. Zhao, 2015) where two or more protocol layers are designed while taking into account the interrelated parameters. As the WSN becomes denser, the used medium access and multi-hop routing protocols and the broadcast nature of WSN make the design problem of guaranteed reliability under strict latency and energy consumption requirements multidimensional and hard to solve. In this work, a point-to-point communication link is considered.
2.1.1 Energy Consumption and Network Lifetime Maximization
Minimizing the energy consumption of WSN while meeting strict performance demands is one of the most challenging goals to achieve. A communication that requires very low latency and high reliability is called ultra-reliable and low-latency communication (URLLC) (K. Lee, 2018; G. Pocovi, 2018). Moreover, as a small form factor is also an important requirement, the use of small batteries hinders the operation of WSN for several years without replacing or recharging them. Accordingly, various energy harvesting (EH) techniques are considered a viable green solution for powering a SN (Abdul Hafiz Alameh, 2018; Sebastian Bader, 2014; Y. K. Tan, 2011; Ljubomir Vračar, 2016; Fan Wu, 2017). In this case, rechargeable energy buffers (e.g. supercapacitors) are used for energy storage (R. Chai, 2015; R. G. Cid-Fuentes, 2014). Renewable energy sources, such as vibration, light or heat, can be considered for powering a SN when several harvesters are used and a proper dimensioning of the energy buffer is carried-out.
Therefore, the research community’s first goal has always been to find both hardware (Sadok Bdiri, 2018; Bdiri Sadok, 2018; D. Selvakumar, 2015) and software (Morin É, 2017; Alexander W. Min, 2012; Xavier Vilajosana, 2014) solutions to decrease the depletion rate of the aforementioned limited energy sources. Furthermore, the actual energy consumption and the
9
node’s lifetime need to be estimated early in the design process in order to choose the right components and node configuration.
2.1.2 Meeting quality of service (QoS) requirements
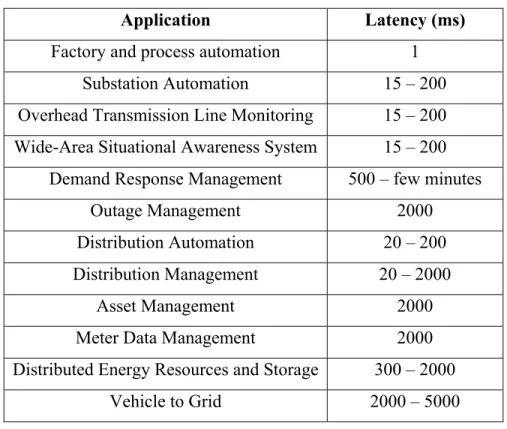
Meeting low latency requirements and high data transfer reliability targets are emerging as an important issue in URLLC IoT applications (R. Abreu, 2018; K. Lee, 2018). This is because the two metrics are tightly interrelated and have a considerable impact on energy consumption. Table 2.1 lists the required end-to-end (E2E) latency requirements of different WSN applications.
For example, in an automated factory, a machine misbehaviour or malfunction needs to be detected quickly so that a controller would be able to take action in time and prevent a serious
Table 2.1 Latency requirement of WSN applications Taken from V. C. Gungor (2013); K. Lee (2018)
Application Latency (ms)
Factory and process automation 1 Substation Automation 15 – 200 Overhead Transmission Line Monitoring 15 – 200 Wide-Area Situational Awareness System 15 – 200
Demand Response Management 500 – few minutes
Outage Management 2000
Distribution Automation 20 – 200 Distribution Management 20 – 2000
Asset Management 2000
Meter Data Management 2000
Distributed Energy Resources and Storage 300 – 2000
damage. The required system latency is generally less than 1 ms. However, in case of the vehicle-to-grid communication application (X. Hu, 2018), if the vehicle is informed of the charging and discharging times with a delay of a few seconds, the received information would still be useful and acceptable.
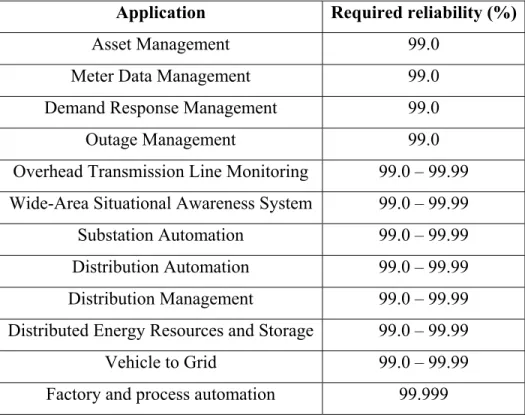
In this work, and as in (Saeed R Khosravirad, 2017), the data transfer reliability is directly linked to the packet success probability. As presented in Table 2.2, the required reliability target varies from one WSN application to another. It mainly depends on the type of data that is being transferred.
By taking into account the factors that can affect the signal of interest such as path loss, noise, data rate, and transmit power, the bit error rate (BER) can be estimated for a given modulation scheme and the packet success probability can be mathematically calculated. The required
Table 2.2 Reliability requirement of smart grid applications Taken from V. C. Gungor (2013); K. Lee (2018)
Application Required reliability (%)
Asset Management 99.0
Meter Data Management 99.0
Demand Response Management 99.0
Outage Management 99.0
Overhead Transmission Line Monitoring 99.0 – 99.99 Wide-Area Situational Awareness System 99.0 – 99.99 Substation Automation 99.0 – 99.99 Distribution Automation 99.0 – 99.99 Distribution Management 99.0 – 99.99 Distributed Energy Resources and Storage 99.0 – 99.99
Vehicle to Grid 99.0 – 99.99
11
reliability target is usually met using techniques such as FEC, blind or ARQ-based retransmissions which will be thoroughly investigated in this thesis.
2.2 Bit and Packet Error Mitigation Techniques
To ensure reliable data communication, both open and closed loop retransmission protocols (R. Abreu, 2018; Saeed R Khosravirad, 2017; M. Zorzi, 1997) and coding techniques (Mohammad Rakibul Islam, 2010; D. Wang, 2017), or a combination of both (J. C. Fricke, 2009; F. Rosas, 2016; M. C. Vuran, 2009) are mostly used. Since both techniques share the same goal of improving data reliability, a question arises as to which combination of these two strategies is optimal from an error recovery and energy efficiency perspective.
2.2.1 Packet Retransmission Techniques
The current and future WSN applications envision reliable communication with efficient use of the limited channel and SN resources. To this end, both open-loop and closed-loop prominent retransmission protocols were adopted. Practically, an open-loop retransmission protocol is where the transmitter blindly repeats each packet R times (R. Abreu, 2018). However, in closed-loop protocols such as the widely-known ARQ protocol (Teerawat Issariyakul, 2006), a feedback channel is used to provide the transmitter with acknowledgement (ACK) or negative acknowledgement (NACK) messages. At the receiver’s side, the decision is made by using a cyclic redundancy check (CRC) code to detect errors. If the transmitted sequence is completely error-free, an ACK packet is transmitted to the data sender. Otherwise, a NACK packet is transmitted.
2.2.1.1 Blind retransmissions (BR)
The BR scheme is an attempt to avoid possible packet errors, delays and complexity caused by feedback ACK / NACK frames. Therefore, the transmitter would blindly send a data packet a predefined number of times without waiting for a feedback as illustrated in Figure 2.2.
Figure 2.2 Packet stream example of the BR operation Adapted from Saeed R Khosravirad (2017)
Blind retransmissions are mostly interesting when the feedback channel is very unreliable which makes feedback-based retransmissions unable to meet high reliability targets. The downside of this scheme’s simplicity is the fact that it hinders SN as well as channel resources since that statistically, the biggest portion of successful packet transmissions are observed in the first and second retransmission attempts (Saeed R Khosravirad, 2017). The authors in (R. Abreu, 2018) propose a scheme that allows to limit the channel capacity drawback by dynamically granting shared channel resources. However, the latency and energy consumption disadvantages are still unresolved.
2.2.1.2 ARQ-Based Retransmissions
Different varieties of closed-loop retransmission protocols are used in today’s wireless systems (worldwide interoperability for microwave access (WiMAX), long term evolution (LTE), Bluetooth, etc.) to reduce packet loss (Saeed R Khosravirad, 2017; M. Zorzi, 1997). In stop-and-wait (SAW) ARQ (Saeed R Khosravirad, 2017), if a data packet is corrupted or lost, it is retransmitted until it is without any bit errors by the receiver as depicted in Figure 2.3.
Figure 2.3 Packet stream example of the SAW-ARQ operation Adapted from Saeed R Khosravirad (2017)
13
Generally speaking, feedback-based retransmissions can achieve a better wireless channel and resources utilization than BR as the number of the required retransmissions can differ from a data packet to another depending on channel conditions. This is achieved by limiting the number of repetitions to only when the previous attempt has failed. But, it is important to mention that, in addition to the data channel, the reliability of ARQ protocols also depends on the feedback channel’s state (Z. Ahmad, 2018; Derya Malak, 2018; H. Shariatmadari, 2017) as a packet is dropped when a NACK packet is falsely perceived as an ACK for example. This makes ARQ-based protocols unable to meet ultra-reliable data communication requirements when the feedback channel also suffers from bit errors. A simple and straightforward solution to increase feedback channel reliability would be to retransmit ACK / NACK packets. This technique is referred to as L-Rep-ACK approach in (Saeed R Khosravirad, 2017) where L > 1 is the number of ACK / NACK packet transmissions as depicted in Figure 2.4. Therefore, a packet is declared as delivered only if all L observances of feedback are ACKs.
Figure 2.4 Packet stream example of the L-REP-ACK Operation for L = 3
Taken from Saeed R Khosravirad (2017)
Consequently, energy and latency overheads are incurred. This approach is further studied in this work and compared to other delivery error mitigation techniques. Moreover, the authors in (Saeed R Khosravirad, 2017) propose a novel and more complicated packet delivery acknowledging method that is able to further decrease the energy and latency overheads while considering an unreliable feedback channel. The proposed scheme relies on the collaboration between transmitter and receiver nodes to provide ultra-reliable communication of packets even in poor feedback channel conditions.
2.2.2 Forward Error Correction (FEC)
FEC is a technique that makes possible the recovery of a limited number of lost bits in a data packet. This is achieved by adding redundancy bits from the transmitter’s side using an encoder and according to certain rules. At the receiver’s side, when the same rules are known, errors in the transmitted sequence can be detected and corrected with a given upper bound limit. Consequently, FEC codes incur energy and latency overheads which are the downside of the achieved coding gain. In general, two types of FEC codes can be used: linear block codes (such as BCH, Reed-Solomon, etc) and convolutional codes (Robin Hoel, 2007).
In this work, only convolutional codes are of interest. Fundamentally, a convolutional encoder ( , , ) is implemented by adding − redundant bits to the actual bits of data. The number of bits upon which the encoder’s output depend is called the constraint length or depth of the code. Usually, decoding is performed by the Viterbi algorithm (Robin Hoel, 2007; B. Sansoda, 2013). The latter compares the received sequence to all of the possible encoded ones and keeps comparing the hamming distance. The sequence presenting the minimum hamming distance is made available at the output of the decoder.
Convolutional FEC can achieve the highest possible coding gain when the flipped bits are evenly spaced throughout the received sequence (Robin Hoel, 2007). However, in a real world wireless application, bursts of errors (i.e. a group of consecutive erroneous bits) are usually observed (Derya Malak, 2018). To tackle this issue, a technique called interleaving (Y. Cai, 2019; Robin Hoel, 2007; R. Swaminathan, 2016) can be performed at the transmitter’s side after encoding the input sequence and, prior to decoding, de-interleaving is performed at the receiver’s side. This technique ensures that bursts of errors in the received sequence are truncated and spread out in the sequence. Therefore, the decoder would be more capable of correcting bit errors (Robin Hoel, 2007).
15
Figure 2.5 Measured packet error rate (PER) curves for a convolutional FEC code of rate=3/4, 1/2 and 1/3 compared with uncoded packets’ transmission
Taken from G. Angelopoulos (2013)
Yet, it should be noted that FEC cannot ensure a very high level of reliability (e.g. 99.999%). This will be demonstrated and explained in chapter 4. Figure 2.5 shows the achievable coding gain at 1% PER when using different FEC rates. For a ½ rate convolutional FEC code and a constraint length = 4, a coding gain of 2.25 dB can be achieved.
2.3 Popular Low-Power Wireless Communication Standards 2.3.1 Bluetooth
Bluetooth (Bluetooth Special Interest Group, 2016) was primarily designed to fill the need for a wireless alternative to RS-232 data cables. It is managed by the Bluetooth Special Interest Group (SIG) and it has evolved considerably since it was first initiated to eventually become the most widely used wireless technology for short range communications. Bluetooth 1.1 was adopted by the Institute of Electrical and Electronics Engineers (IEEE) 802.15 working group in 2002 to define the specification of the IEEE 802.15.1 open standard. Subsequent versions
were released to overcome several performance and coexistence issues and the standard was updated accordingly. Most importantly, special attention was given to higher data transfer speeds, security and lower power consumption levels.
Bluetooth operates in the 2.4 GHz of the industrial, scientific and medical (ISM) band. In order to make it prone to interference and signal fading phenomena, the Frequency Hopping Spread Spectrum (FHSS) technique is adopted. Ranging from 2.402 to 2.480 GHz, Bluetooth uses 79 channels with a hop rate of 1600 hops per second. This technique also assures a more secure wireless communication and makes it difficult for intruders to intercept the link. Three possible output power classes are supported by Bluetooth (i.e. 100 mW (20 dBm), 2.5 mW (4 dBm), and 1 mW (0 dBm)) (Luiz Oliveira, 2019) in order to be able to achieve different communication ranges which are in this case 100 m, 10 m, and 10 cm respectively.
As mentioned earlier, higher data rates have been achieved in the subsequent versions. While Versions 1.1 and 1.2 allowed a maximum of 1 Mbps data rate, Versions 2.0 and 2.1 were able to achieve 2 Mbps and 3 Mbps data rates. Bluetooth supports point and point-to-multipoint communications and a Bluetooth pico-networks can support up to seven active slaves at a time. By combining various pico-networks, a scatter-network can be formed where each pico-network uses a different hope sequence. In order to be within the power budget of applications with very limited energy resources such as embedded low-power wireless sensor networks, the Bluetooth Low Energy (BLE) protocol was introduced. It coexists with the classic Bluetooth technology, enables devices to operate in sleep mode and allows accessing the medium and transmitting data within at least 3ms with data packet lengths of 10 to 47 bytes. BLE also differs from classic Bluetooth in that it supports a subset of 40 channels and a higher operating range. BLE-compliant platforms were made available by several manufacturers during the last few years. In addition, a Gaussian frequency shift keying (GFSK) with a modulation index between 0.45 and 0.55 is used. Data rates of 1Mbps and 2Mbps can be achieved with BLE 4.2 and BLE 5, respectively. Furthermore, the maximum output power for BLE 4.0, BLE 4.1, and BLE 4.2 is 10 mW.
17
In order to cope with packet errors, BLE optionally uses FEC, the ARQ scheme, or both. However, the header is always protected by a 1/3 rate FEC as it contains critical link information (Bluetooth Special Interest Group, 2016). In BLE, for example, coding can be performed in two stages; convolutional FEC using a non-systematic, non-recursive rate 1/2 code with constraint length K = 4 for example, and spreading by using a pattern mapper (Bluetooth Special Interest Group, 2016).
A Link Layer (LL) packet uses a 24-bit CRC to detect bit errors in the payload. If the CRC verification detects the presence of one or more bit errors in the packet payload, the packet is not acknowledged by the receiver and retransmitted by the sender using a go-back-n repeat mechanism. It is possible to modify this scheme in order to meet the requirements of time-critical applications. For example, the maximum number of retransmissions can be modified. When that number is reached without succeeding to deliver the packet, the link is disconnected.
Moreover, in Bluetooth, broadcast links are possible between one source device and zero or more receivers and where the traffic is unidirectional. Data can be sent at any time through this type of links without any feedback nor prior connection. To ensure an acceptable data reliability, a packet is blindly (i.e. without feedback) retransmitted on a configurable number of occasions.
2.3.2 IEEE 802.15.4
IEEE 802.15.4 (IEEE STANDARDS ASSOCIATION, 2015) was first introduced in 2003 and subsequently revised in 2006, 2011 and 2015. It specifies and standardizes the physical layer and the MAC sub-layer of networking devices used in Low-Rate Wireless Personal Area Networks (LR-WPANs). Since it enables very low-cost and low-power communications, IEEE 802.15.4 witnessed a great success and was adopted by several wireless sensor networking technologies such as ZigBee in 2006. Several frequency bands can be used, namely the sub-1 GHz and the 2.38 – 2.45 GHz bands. The 2.4 GHz band suffers from interferers such
as Wi-Fi and Bluetooth and a low communication range. However, the sub-1 GHz band can ensure a longer range and a better link robustness.
The IEEE 802.15.4 standard defines two different types of devices in a LR-WPAN. The first type is Full Function Device (FFD). An FFD device can act as a coordinator or a router and thus can be responsible for managing the network or just expanding it by finding routes and forwarding data packets. FFD devices would therefore embed more memory and CPU power resources, sleep for relatively short times or continuously listen to the channel and consume more energy. The second type is Reduced Function Device (RFD). An RFD device, on the other hand, burns less power since it only transfers application packets with no routing capabilities and can remain in a low power mode for relatively long times.
From 2003 until 2015, several physical and data link layers' specifications were adopted by the IEEE 802.15.4 standard such as the IEEE 802.15.4e and IEEE 802.15.4g amendments in 2012. The latter defines an alternate physical layer specification for outdoor low rate wireless smart metering utility network. Moreover, as the needs for more performance in dense networks and IoT applications increase, contention-based Medium Access Control (MAC) protocols no longer present a viable solution, the IEEE 802.15.4e improves the MAC layer by adopting new mechanisms such as the Time-Slotted Channel Hopping (TSCH) scheme (Glenn Daneels, 2018). TSCH was designed for applications with stringent reliability and power consumption constraints and where measurement and data transmission are performed periodically and quickly became the de facto MAC scheme for reliable and ultra-low power Industrial Internet of Things. It is important to note that TSCH does not bring any changes to the physical layer specified in the IEEE 802.15.4 standard, meaning that it can be implemented using a standard-compliant radio. Networks implementing TSCH as their MAC protocol have their nodes synchronized according to a continuously repeating frame which is divided in time to form a given number of time slots. A time slot's minimum length is actually the time needed for the longest transmission period and its acknowledgement which would be in this case around 15ms. Each slot is assigned a channel-offset that changes from a super-frame to another. This
19
channel hopping technique can reduce the impact of external interference and multipath fading phenomena especially in the unlicensed 2.4-GHz band, shared with Wi-Fi, Bluetooth, etc.
In the IEEE 802.15.4, a 1/2 rate convolutional FEC code with constraint length K = 4 is optionally. Moreover, interleaving of code-bits can be applied only when FEC is used in order to improve the code’s error correction capability by breaking the correlation of consecutive bits.
In order to detect errors, a 16-bit or 32-bit CRC is used. The transmitter optionally requests a feedback from the receiver. If requested, the transmitter waits for the reception of the corresponding ACK frame. When the latter is received within the expected period of time, the transmission is a success. Otherwise, if the feedback is negative, the transmission attempt is a failure. The transmitter would thus repeat the process of transmitting the frame and waiting for the acknowledgment up to a configurable maximum number of times. If no acknowledgment is received after by when that number is reached, the MAC sublayer assumes that the transmission has failed. Moreover, when a device encounters a transmission failure in a shared link (i.e. no ACK reception), is initializes the back-off exponent and wait for a random period of time before attempting a retransmission. However, on a dedicated link, a retransmission can take place at any time. For each failure, the device increases the exponent until a maximum value is reached and the transmission attempt is permanently considered as a fail. Upon a transmission success and ACK reception, the exponent is reset to its minimum value.
CHAPTER 3 LITERATURE REVIEW
In this chapter, a thorough literature review will cover different energy modeling and optimization frameworks as well as different techniques ensuring stringent QoS requirements in modern WSN. Moreover, the key strengths and limitations and drawbacks of the proposed solutions will be highlighted.
3.1 Energy Consumption Modeling and Estimation in WSN
A significant amount of research work has been undertaken in order to estimate the power energy consumption of WSNs at an early stage of the design process.
For instance, a power and energy estimator is presented in (Nicolas Ferry, 2011) to predict a WSN’s autonomy in order to evaluate the economic benefits of replacing an existing wired network with a wireless one. The hardware power consumption models are determined using the functional level power analysis (FLPA) methodology (Johann Laurent, 2004). In addition, multiple energy harvesting systems are considered (i.e., solar, wind, and thermal). Dynamic Power Management (DPM) is performed according to a finite state machine (FSM) where the transitions are dictated by the energy saving levels and weather forecasts. However, the energy model parameters are not clearly showcased and thoroughly studied. Therefore, an accurate energy consumption estimation was not achieved nor compared to measurements. Moreover, the modeling framework is based on LabVIEW and does not allow the designer to quickly make a flexible energy model.
Also, the authors in (K. Virk, 2005) present an abstract modelling framework for both sensor-network-level and sensor-node-level modelling, and apply a hardware / software co-design approach. The framework is based on SystemC, and is neat to be used to model almost all of the aspects from sensors' modes of operation to radio signal propagation. Moreover, at the sensor-node-level, the model is split into two different but tightly dependent and related
sections (i.e., software and hardware section). The hardware section helps the estimation of the sensor node's overall power consumption by monitoring the significant parameters of the model, while the software section, on the other hand, comprises tasks models such as processing, I/O tasks, services and schedule of a real time operating system (RTOS) model. It helps simulating the functional side such as the behavior of contention-based medium access control (MAC) protocols (Paulo Bartolomeu, 2016). At the sensor-network-level, the authors model the physical phenomenon of the environment where the sensor node's hardware model will be integrated. It should be noted that in this case, the energy consumption estimation is very time consuming and relatively complicated for the accuracy that can be achieved.
Another contribution is the Powersim C++ class library presented in (Simone Orcioni, 2016). It monitors the C++ operators during the simulation of a high-level of abstraction model developed using SystemC in order to estimate a given hardware's power consumption when provided with an energy model. An energy model represents a set of simulated or hardware power consumption measurements of different operators, and it is possible for the designer to choose the modules and operators to be monitored by adding a configuration file. The energy model contains a list of energy granularities of each arithmetic and logic operation supported by a given MCU. This way, Powersim can calculate the overall energy consumption of the algorithm. The same code was then ported to an MCU and measurements showed that the simulation results with Powersim present an error of 15.8%. Again, this approach is extremely costly in terms of time and complexity. For each hardware platform, the designer needs to develop a SystemC model that will be used to estimate the energy.
In addition, work presented in (A. K. Anwar, 2010) uses the Stateflow graphical modeling environment (Mathworks, 1997–2018) which is a component of Simulink, to develop a model-based design framework of an energy-optimized protocol stack for WSNs. It allows the simulation and code generation of WSN applications intended for a variety of implementation platforms. The framework can also be used in very flexible way to build energy models while omitting the code generation capability.
23
In (Glenn Daneels, 2018), the authors present an energy consumption model for devices running IEEE 802.15.4e TSCH protocol. The results report an accurate energy consumption prediction as all network-related CPU and radio state periods and transitions are well modeled. They are also validated by comparing the estimated values with hardware measurements where a 3% error margin is observed. Another similar model is presented in (X. Vilajosana, 2014). It should be noted that the two models are specific to the TSCH protocol and cannot be easily adjusted and used to estimate the energy consumption of other protocols.
3.2 Path Loss Modeling
Before designing a sensor node and deploying the network of nodes, the deployment site needs to be characterized and studied. Given that a SN is intended to operate within a large group of other SNs, having a realistic model for path loss (PL) in order to estimate the operating range is of interest. This step needs to be taken early in the design process as it has a great impact on the system’s performance and optimal configuration.
Extensive research has been conducted in order to estimate the received signal strength and characterize the effects of signal attenuation while it propagates in a given environment and under known circumstances. Basically, PL models attempt to capture the effect of signal attenuation in line-of-site (LOS) or non-line-of-site (NLOS) communication links (C. Phillips, 2013). Moreover, signal propagation models can be classified based on whether they are meant to capture the effects of large-scale path loss or small-scale fading (W. Sun, 2018). Small-scale fading takes place when rapid fluctuations over very short travel distances (i.e. a few wavelengths) or durations (i.e. a few seconds) are observed. As in the case of WSN applications the large-scale path loss phenomenon is dominant (W. Sun, 2018), small-scale fading is omitted in this survey.
The authors in (M. Bacco, 2018) model the signal PL between a sensor node deployed in a smart farming application and an unmanned aerial vehicle (UAV) such as a drone. The two-ray path loss (TRPL) allows to make good estimation of signal attenuation between two
endpoints acting in an open space such as a rural field in general by taking into account the line-of-sight (LOS) component and the reflected signal due to the ground. The TRPL is expressed as follows:
= 20 log 4 − 20 log 2 sin 2 ℎ ℎ (3.1)
where is the distance between the two nodes, is the wavelength, and ℎ and ℎ are the distances that separate the transmitter and the receiver from the ground respectively.
In (Hicham Klaina, 2018), using the received signal strength indicator (RSSI) data generated by commercial SNs, a three-slope log-normal PL model was proposed in order to model a narrowband radio channel in rural scenarios where the radios operate under near-ground conditions such as the case for smart agriculture applications. Tests were carried out in three different environments, namely in short and tall grass fields and when there is no grass.
Moreover, a survey of LOS and NLOS wireless PL models is presented in (C. Phillips, 2013). For LOS links, a fitting factor is added to the free-space PL in an attempt to avoid underestimations. It is given by:
= log(50 ) (3.2)
where is a fitting coefficient.
In this thesis, a LOS communication link is considered for WSN applications and an empirical PL model is proposed. It is an attempt to use the proposed models in the literature and come up with an adjustable one that can be used to estimate the received power from a transmitter deployed in different types of environments.
25
3.3 Energy cost versus QoS trade-off
In recent past, research on limiting energy consumption while meeting stringent QoS requirements has taken a considerable leap and steadily been growing especially in industrial automation applications (F. Dobslaw, 2016; H. Shariatmadari, 2017; W. Sun, 2018).
The authors in (D. Singh, 2018) investigate the adaptive data rate (ADR) algorithm implemented in Long Range Wide Area Network (LoRaWAN) and its theoretical bounds of link and network capacity. They explain how the data rate is dynamically adjusted such that a node close to the gateway would use a small spreading factor in order to increase the raw data rate and be able to decrease latency and radio output power. Therefore, the closest node to the gateway transmits with the maximum data date and lowest output power. In LoRaWAN compliant devices, the adaptive rate-power allocation is based on RSSI and signal-to-noise (SNR) readings of the last received packets of static devices. As it will be demonstrated in this work, the studied power/data rate allocation technique used in LoRaWAN can drastically optimize the wireless link performance and energy efficiency.
In (B. Makki, 2014), the authors investigate the effect of an error-prone feedback channel on the performance of ARQ protocols and study the impact of using adaptive rate and power allocation. Therefore, the throughput, the outage probability, and the feedback load of different ARQ protocols are considered. They demonstrate that optimal power and rate allocation is crucial for ensuring a good performance of noisy ARQ schemes in terms of reliability and latency with respect to the open-loop communication setup (i.e. blind retransmissions) and especially when the number of retransmissions or SNR increase. The missing part in this work is the lack of measurements and real-world case studies in order to realistically showcase the benefits.
In (K. Hedayati, 2010), in addition to optimizing transmissions scheduling in multi-access communication links, the authors propose a mathematical programming model and algorithm to perform simultaneous adaptive allocation of physical layer parameters, namely transmit
power levels and data rates across active links, while meeting required Signal-to-Interference plus-Noise Ratio (SINR) levels at intended receivers. Therefore, an energy efficient rate-power combination is achieved. The algorithm is based on the construction of a Power Controlled Rate adaptation Interference Graph yielding a 20% better throughput performance than prior algorithms using fixed transmit power and fixed rate link scheduling. However, in this case, the energy consumption and QoS requirements are not of paramount importance.
While admitting that in harsh industrial application scenarios, factors such as transmission power level, communication range, and random ambient noise affect radio link quality, a network-level reliability model for estimating and optimizing the reliability performance and deployment parameters of industrial WSN is presented in (W. Sun, 2018). They suggest a new approach where nodes measure and estimate link parameters such as the packet reception ratio (PRR) and received signal strength (RSS) and then optimize the lower-bound reliability value. To this end, an alpha-stable distribution to accurately model the background noise and a modified log-normal path loss model to estimate the RSS are introduced. A mapping function between PRR, background noise, and RSS is then proposed. Through a case study, the authors demonstrate the feasibility of their solution and optimize the reliability by computing the maximum deployment distance between sensor nodes. Yet, the energy consumption cost in not quantitatively evaluated and optimized as the authors mention that the nodes are energy-limited devices. Moreover, the latency is not clearly addressed in this study.
After optimizing the wireless link parameters, bit and packet errors can still occur. Therefore, as previously mentioned, FEC, ARQ schemes, or both are used. As FEC has a limited ability to correct errors, the authors in (M. Patil, 2017) propose a dynamic error control scheme based on link parameters such as BER and ambient noise in WSN. Through simulations, it is reported that throughput and retransmission probability are improved. An energy model that showcases the efficiency of the proposed technique is actually missing in this study.
As ARQ-based protocols suffer from feedback error, the authors in (Saeed R Khosravirad, 2017) study different approaches allowing to increase feedback channel time diversity and
27
attain different reliability regions with respect to feedback channel error rate such as the L-REP-ACK scheme. Then, they propose a new method of acknowledging packet delivery for retransmission protocols which is based on backwards composite acknowledgment from multiple packets while relying on collaboration between transmitter and receiver nodes. Therefore, depending on channel quality, the scheduler of the wireless channel would be able to configure ultra-reliable communication when needed. The proposed solution does not require increasing the time diversity order of the feedback channel and thus does not incur energy consumption and latency overheads. Moreover, they investigate the advantages and disadvantages of BR and show that in extremely unreliable feedback channel conditions, an open-loop solution is viable in terms of reliability while noting the energy consumption downside. However, in none of the studied solutions do the authors clearly and quantitatively evaluate the energy consumption nor the latency overheads. As in most cases a good compromise between reliability, latency, and energy consumption need to be found, the evaluation of the three metrics needs to be carried out in a simultaneous way.
In addition to adjusting link parameters and applying bit and packet error mitigation techniques, the authors in (P. Kong, 2016) present an intelligent starting point for network planning for an optimal sensor and sink nodes deployment. Using an analytical model, they determine the minimum concentrator nodes (i.e. sink nodes) density and locations that are required to support a given smart grid application QoS requirements in terms of packet delay, packet error probability, and outage probability. A network of sensors and smart meters deployed in a neighborhood area in a densely populated urban area and based on the IEEE 802.15.4g standard is considered. It is reported that less than ten concentrators per km2 are needed to support a density of 500 sensor nodes, an end-to-end latency of less than 1s, a packet error probability below 0.005, and an outage probability below 0.01. Similarly, the authors in (F. Dobslaw, 2016) propose a framework capable of finding valid cross-layer solutions and optimizations to meet stringent end-to-end QoS requirements of industrial WSN applications. Also, an algorithm that identifies the required number of sink nodes in order to meet the requirements is introduced. For example, they report that a network of 50 sensor nodes requires an average of 8.1 sinks when four channels are used and an end-to-end reliability demand
99.999% is needed. However, both studies completely omit the impact of the proposed solutions on energy consumption which is considered to be one of the main design challenges in WSN. The placement of the sink nodes will directly affect link parameters such as the data rate, the transmission power level, and the choice of bit errors mitigation techniques.
In (R. Abreu, 2018), the authors study the possibility of achieving a 0.99999 packet success probability within a 1ms latency while bearing in mind the capacity of the network. To this end, they avoid the reliance on imperfect and error-prone feedback channels and propose a novel scheme based on blind retransmissions and coupled with successive interference cancellation to receive the remaining non-decoded data with a low latency penalty when compared with the feedback-based retransmission schemes. Finally, it is reported that depending on the number of users sharing the resources, the novel scheme can be more resource efficient than a conservative single shot transmission. However, the authors assume fast processing and transmitting/receiving times, both from the transmitter and receiver side. This assumption can also lead to reducing the communication range in a drastic way when using high data rates.
Contrarily to the reviewed works and studies in this chapter, the methodology presented in this thesis covers the three major design challenges (i.e. energy efficiency, reliability, and latency) in a simultaneous way in order to achieve a good trade-off. The next chapter includes the theory behind the methodology, the measurements and discussions, as well as the case studies.
CHAPTER 4
SYSTEM-LEVEL DESIGN METHODOLOGY
This chapter is based on a submitted manuscript for publication in a peer reviewed journal. Here, the proposed energy and path loss models are presented. The novel contribution of the proposed energy model is the accurate estimation of MCU current consumption and execution time. Moreover, a detailed study of different error control techniques in terms of reliability, energy consumption, and latency is included. Furthermore, it covers all the measurements and tests which were conducted in order to validate the proposed models. The measurement setups, tools, and methodologies are also explained. This chapter will be closed with case studies highlighting the possible design improvements in terms on energy consumption, reliability, and latency when the proposed methodology is applied. In addition, the limitations of the models and experiment as well as the viable solutions and improvements which can be used to mitigate these issues are discussed.
4.1 Sensor Node Energy Model
Figure 4.1 The three main modeled components of an SN
In this section, the analytical energy estimation models and the modeling framework of a functional sensor node are introduced. The main components of a SN that are modeled in this work using a high-level of abstraction framework are depicted in Figure 4.1. The considered sensor allows measuring temperature, pressure, and humidity with a given sampling rate depending on the application (i.e. every 500 ms). At the end of the section, a comparison between the estimated and the measured energy per measurement is included.