HAL Id: hal-01266423
https://hal.archives-ouvertes.fr/hal-01266423
Submitted on 2 Feb 2016
HAL is a multi-disciplinary open access
archive for the deposit and dissemination of
sci-entific research documents, whether they are
pub-lished or not. The documents may come from
teaching and research institutions in France or
abroad, or from public or private research centers.
L’archive ouverte pluridisciplinaire HAL, est
destinée au dépôt et à la diffusion de documents
scientifiques de niveau recherche, publiés ou non,
émanant des établissements d’enseignement et de
recherche français ou étrangers, des laboratoires
publics ou privés.
Comparison between access selection algorithms in
multi-operator wireless networks
Soha Farhat, Samhat Abed Ellatif, Samer Lahoud, Bernard Cousin
To cite this version:
Soha Farhat, Samhat Abed Ellatif, Samer Lahoud, Bernard Cousin. Comparison between access
se-lection algorithms in multi-operator wireless networks. International Conference on Applied Research
in Computer Science & Engineering (ARCSE-ICAR’15), Oct 2015, Beyrouth, Lebanon. pp.1 - 8,
�10.1109/ARCSE.2015.7338132�. �hal-01266423�
Comparison between Access Selection Algorithms in
Multi-operator Wireless Networks
Soha FARHAT
CRSI, Lebanese University Campus Rafic Hariri
Hadath-Lebanon
soha.farhat@ul.edu.lb
Abed Ellatif SAMHAT
CRSI, Lebanese University Campus Rafic Hariri
Hadath-LEBANON
samhat@ul.edu.lb
Samer LAHOUD
IRISA, Rennes1 University Campus Beaulieu Rennes-FRANCE
samer.lahoud@irisa.fr
Bernard COUSIN
IRISA, Rennes1 University Campus Beaulieu Rennes-FRANCE
bcousin@irisa.fr
ABSTRACT
In fifth generation mobile network, Radio Access Network sharing is an attractive solution for operators to counter the traffic growth and build cost-effective networks in order to improve coverage and capacity at reasonable investments and operational costs. It consists of sharing radio access resources between two or more operators. In such multi-operator environment access selection decision is an important issue for the mobile user and his home operator which the user has contract with. In literature, the majority of access selection algorithms are based on game theory which is very complex for implementation and the decision is slower in comparison with Multiple Attributes Decision Making (MADM) methods. In this paper, we use Simple Additive Weighting (SAW) methods and Nearest Performance Handover (NPH) algorithm for the access selection in a multi-operator environment. These algorithms based on MADM were initially conceived for the selection decision in a single operator environment. In addition, we compare the performance of these algorithms with our previously proposed cost function for the access selection in a multi-operator sharing network. Performance analyses are made in terms of user blocking percentages and global achieved profit. Simulation results showed that our decision algorithm guarantee the lowest blocking probability for all operators, it prevents overloading operator’s with high numbers of guest users which affect own clients acceptance. In addition, it improves global achieved profits for all cooperating operators. However, SAW methods showed better performance than NPH concerning users blocking percentages, but NPH guarantees higher profits than SAW methods for the operators with limited capacity.
Categories and Subject Descriptors
C.2.1 [Computer –Communication Networks]: Wireless Communication.
General Terms
Algorithms, Management, Performance.
Keywords
Multi-operator networks; access Selection algorithms; cost function.
1. INTRODUCTION
Fifth generation mobile networks must address new challenges that appeared with the explosive growth of the mobile traffic broadband, the increasing number of mobile connected devices and the evolution of mobile user expectations. In fact, global mobile data traffic grew 69% in 2014, and it is expected to increase nearly tenfold between 2014 and 2019 [1]. Besides, the growth of data consumption over voice usage deteriorates operator’s revenues. Furthermore, mobile users are more aware of the QoS and are evaluating increasingly the connectivity, especially for the services with high quality of experience (QoE) expectations. The need of high-speed connectivity for anything, anywhere and anytime is growing, and operators are facing the challenge to upgrade their network in order to expand capacity, support higher data rates and enhance QoS in terms of end-to-end (E2E) latency, with energy and cost efficiency. Some 5G enablers consist of the exploitation of new spectrum by using millimeter waves, the usage massive MIMO, the adoption of efficient inter-cell interference management and network densification and Cloud Radio Access Networks (C-RAN) deployment [2].
Since the growth of traffic and revenues are decoupled, operators are seeking for new sources of revenues and new cost reduction solutions. RAN sharing is a rational approach that can help reduce costs, maximize efficiency and competitiveness, as well as enhancing customer satisfaction. It is introduced as a cost effective solution de expand coverage and increase capacity in [3][4][5]. It involves active sharing of RAN between two or more operators as a mean of mutually offering access to each other’s resources. This inter-operator arrangement brings a lot of benefits for operators as CAPEX and OPEX savings, new revenues achievements and energy consumption reduction. Besides, it promotes innovation since the competition between operators, in such environment, is based on offered services and features. In fact, current 3rd Generation Partnership Project
(3GPP) standards fully support network sharing between operators under different sharing scenarios as Multi-Operator Core Network (MOCN) and Gateway Core Network (GWCN) [16].
In this paper, we consider a multi-operator sharing environment, where multiple operators share their radio access to ensure service availability for mobile end users. In such
environment, when an operator is unable to ensure user’s satisfaction constraints, access to the service is granted through the network of another operator, thus avoiding his rejection. The main contribution of this work is the use of Simple Additive Weighting (SAW) methods [13] and Nearest Performance Handover (NPH) algorithm [14] for the access selection in a multi-operator environment. These algorithms were initially conceived for the selection decision in a single operator environment. In addition, a performance comparison is made between these algorithms and our previously proposed cost function for the access selection in a multi-operator sharing network [4]. Performance analyses are made in terms of user blocking percentages and global achieved profit using these three algorithms. Simulation results showed that our decision algorithm guarantee the lowest blocking probability for all operators, it prevents overloading operator’s with high numbers of guest users which affect own clients acceptance. In addition, it improves global achieved profits for all cooperating operators. However, SAW methods showed better performance than NPH concerning users blocking percentages, but NPH guarantees higher profits than SAW methods for the operators with limited capacity.
The remainder of the paper is organized as follow: section 2 presents some existing works related to access selection algorithms. Section 3 describes the investigated selection decision algorithms. In Section 4 we present our simulation environment. And results are analyzed in section 5. Finally, section 6 concludes the paper.
2. BACKGROUND & RELATED WORKS
In a multi-operator heterogeneous network, a new “flex service” paradigm is introduced in [6]. It allows a mobile user to dynamically access base stations BSs of different providers based on various criteria, such as profile, network conditions and offered prices. “Flex users” can select the appropriate provider and BS on a per-session basis. Authors present two modeling framework for the access markets at both microscopic and macroscopic levels. At a macroscopic level, users are considered as a homogeneous population with respect to preferences and decision-making mechanism. The behavior of users is described by a population game in order to determine how the entire user population reacts to the decision of providers. At a microscopic level, a flex user accesses dynamically base station of different providers based on various criteria, such as profile, network conditions and offered prices. In fact most of the existing works, in multi-operator environment, use game theory for the access selection and the joint service pricing. In [7], authors applied a non-cooperative game that makes use of Leader–follower model (Stackelberg game) in order to study the competition between two ISPs. With a simple QoS model a Nash equilibrium point was found from which the two ISPs would not move without cooperation. In [8], game theory is used for Dynamic Spectrum Access algorithm with cellular operators. Authors have defined a utility function, for the operators, considering user’s bit rate, the blocking probability and the spectrum price. Moreover, they have presented a penalty function to control the blocking probability. In cognitive radio networks [9], where mobile users may switch in real time to the provider (or providers) offering the best tradeoffs in terms of QoS and paid price, Nash equilibrium concept is used to find the optimal price in a Stackelberg game
between primary and secondary operators and Wardrop equilibrium is determined for the network selection game. Authors reveal the advantage for the primary operator to play before the secondary operator, particularly in a high-traffic regime. Furthermore, a two-stage multi-leader-follower game is used to model the interaction of a number of wireless providers and a group of atomic users in [10]. The providers announce the wireless resource prices in a first stage and the users announce their demand for the resource in the second stage. The user’s choice is based on provider’s prices and its channel conditions. Authors showed that the provider competition leads to a unique socially optimal resource allocation for a broad class of utility functions and a generic channel model. In [11], we modeled the interaction between wireless operators, in a multi-operator sharing network, as a multi-leader-follower (Stackelberg) game. Cooperating service operators announce their transaction cost in the first stage and the home operator of the transferred user performs the selection decision in the second stage. The transaction cost price is set following six different predefined pricing schemes. The game solution is found using Nash equilibrium concept, and the best response is determine for every pairs of leaders. However, the comparison of game theory techniques with MADM methods shows that game theory is more complex for implementation and the decision speed is slower than with other techniques [12]. Therefore, we intend to exploit the advantages of MADM techniques [13] and especially the simplicity of SAW and NPH [14], for the selection decision in a multi-operator network environment. Additionally, we introduce our previously proposed cost function for the selection decision in the multi-operator context [4], and name it by the Nearest Performance and Best Profit Access Selection Algorithm (NP-BPA).
3. SELECTION DECISION ALGORITHMS
3.1 Simple Additive Weighting (SAW)
The access selection decision takes into account a number of parameters that affect user’s application satisfaction. Generally, these parameters are collected from the available access networks, the application requirements, and the end user. With SAW, for each available access network, the collected parameters are normalized, combined with the user application sensitivity weights and then added to form the access network score [13]. The access network having the highest score will be selected for the user service. In this work we consider four QoS parameters: the mean jitter JM,the mean end-to-end delay DM,
the remaining bandwidthBWR and the mean loss rateBERM. In
our multi-operator environment the access network is presented by its operator, therefore, the score of the ith service operator is calculated as follow:
SiSAW= wJ *JMi + wD *DMi + wBW *BWRi + wBER*BERMi, (1)
where wJ, wD, wBW and wBER are the user application sensitivity
weights for the jitter, the end-to-end delay, the bandwidth and the BER, respectively.
3.2 Hybrid Simple Additive Weighting
(SAWp)
For a hybrid decision the home operator satisfaction must be taken into account during the selection. We propose to add the transaction profit to the service operator score. The considered profit is the difference between the user payment p and the
transaction cost Cs set by the new service operator. Consequently, the score of the ith service operator is calculated as follow:
SiSAWp= Wu*(wJ *JM i+ wD *DMi + wBW *BWRi + wBER*BERMi) -
Wop*(p-Csi), (2)
where, Wu is the weight determining the degree of importance for
the home operator to satisfy the user and Wop is the weight
determining the degree of importance to improve its profits.
3.3 Nearest Performance Handover (NPH)
NPH approach, introduced in [14], consists of defining the SAW score for the ideal solution, calculates the SAW score for every candidate, and then computes the distances of each candidate score to the ideal solution score. Finally, the access network with the closest score to the ideal one is selected for the service. The ideal solution score is the user’s SAW score considering the QoS parameters required by the user’s application [14]. Hence, the score of the user, Su, is computed as follows:
Su=η* (wJreq*Jreq + wDreq*Dreq + wBWreq*BWreq + wBERreq * BERreq )
+μ*p , (3) where, Jreq , Dreq , BWreq and BERreq are the required jitter, delay,
bandwidth and BER respectively, for user’s application. These parameters are determined from the application QoS class, normalized and associated to their corresponding weights wJreq,
wDreq,wBWreq andwBERreq respectively. In addition, η and μ are the
preference coefficients of the user for the QoS and the paid price, respectively.
Symmetrically, the new score for the ith service operator is
S’iSAW calculated as follow:
S’iSAW = η* (wJ *JMi + wD *DMi + wBW *BWRi + wBER*BERMi )
+ μ*pi, (4)
where, pi is the service price of the ith operator set for its clients.
This approach is initially proposed in a single operator context and can be used in our multi-operator environment, where each operator manages a single access network.
Consequently, the score of the ith service operator is calculated as follow:
SiNPH=│Su-S’iSAW│ (5)
NPH approach intends to choose the operator delivering enough QoS parameters for user’s application requirements, thus having the lowest SiNPH.
3.4 Nearest Performance and Best Profit
Access Selection Algorithm (NP-BPA)
In our proposed algorithm, in order to assure the home operator happiness during the selection decision, we add the transaction profit [4]. Hence, the score of the ith operator is calculated as follow:
SiNP-BPA=Wu*│Su - S’iSAW│-Wop*(p-Csi), (6)
The selected operator offering the nearest performance parameters to the user requirements, thus having the closest score to Su, and setting the lowest transaction cost Cs, thus
guaranteeing the best profit for the home operator is the selected one for service. Therefore, the selected operator is the one having the lowest SiNP-BPA.
4. SIMULATION ENVIRONMENT
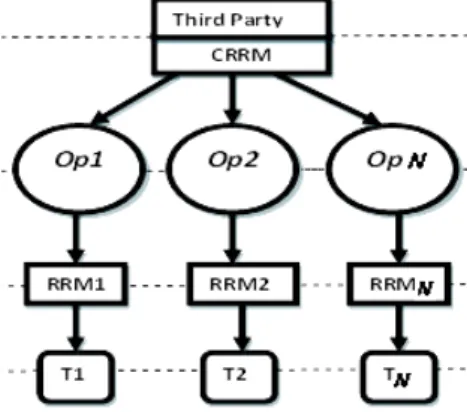
For illustration, we adopt the system model presented in Fig.1 and we consider three cooperating operators: Op1, Op2 and
Op3, each managing a single radio access network. After they
arrive, mobiles are uniformly associated with a user profile, determining the service type and the price p to pay to his home operator. We consider two possible service types: Conversational and Interactive, the QoS weights corresponding to the bandwidth, the jitter, the delay and the loss rate are determined by applying Analytic Hierarchy Process (AHP) [14-15], and are given by the following vectors: [0.05, 0.45, 0.45, 0.05] and [0.16, 0.04, 0.16, 0.64], respectively. Without loss of generality, we simulate our scenario using the conditions of the networks shown in Table 1 [15]. For the service price p, we use the following values: 0.9, 0.1 and 0.2 unit/kBytes for Op1, Op2 and Op3, respectively. The requirements for real-time and non-real-time services are determined in Table 2. We perform simulation for different values of 1/λ= 2.5, 2.78, 3.33, 5. For the mean service time we consider a typical value of 1/μ=4 min [15]. At the end of the connection, the user will leave the system thus, improving the available bandwidth of the serving operator. The simulation is implemented in MATLAB for duration of 1200 sec and repeated for 20 experiments.
5. SIMULATION RESULTS
In this section we present the performance results in terms of blocking rates and global achieved profits. We suppose that operators do not set any priority for their own clients, and the service cost Csi is set equal to pi.
5.1 Global Blocking Percentages
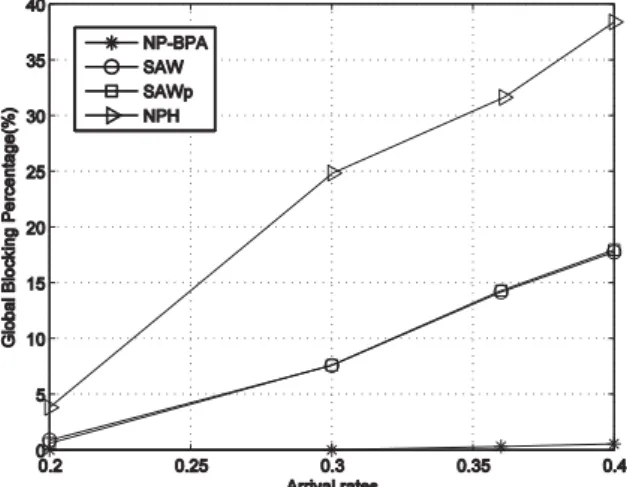
Figure 2 shows results for the global blocking percentages of the system formed by Op1, Op2 and Op3 in function of the arrival rates. Its calculated as the ratio of the total number of rejected user and the total number of arrived users in the system. Each curve represent the blocking percentages achieved using one of the investigated selection algorithm, NP-BPA, SAW, SAWp and NPH. These blocking percentages increase with the arrival rate. With NPH, blocking percentages increase fast and achieve very high values from 25 to 38%. These percentages are lower with SAW and SAWp but they reach 18 % at high arrival rates. With NP-BPA, global blocking percentages are limited between 0 and 1%. Our decision algorithm reduced extremely the global blocking percentages, it prevent overloading service operators with limited to moderate. Table 3 presents the selection results
for all arrival rates, it show the percentage of users transferred from one operator to another adopting different selection algorithm. It is clear that with NPH all transferred users are served by Op1 or Op3 having limited and moderate capacity, respectively. However, with SAW and SAWp, the transferred users are served by Op2 and Op1 with high and limited capacity. And, with NP-BPA the selected service operators are Op2 and Op3 with high and moderate capacity, thus the efficiency of our selection algorithm.
5.2 Operators’ Network Performance
Figures 3a, 3b and 3c show the blocking rates in function of the arrival rates, for Op1, Op2 and Op3 respectively, using NP-BPA, SAW, SAWp and NPH. Simulation results show that, for all operators, our proposed cost function NP-BPA guarantee the lowest blocking rates, for all arrival rates. SAW and SAWp present the same performance, the achieved blocking rates are very close and are low for Op2 which has already a high capacity, which means that SAW and SAWp have the same performance as NP-BPA for the operator having the highest capacity. However, for Op1 and Op2 the performance of SAW and SAWp degrades and high blocking rates are achieved using these algorithms, they reach 34% for Op1 and 16% for Op3. NPH presents the worst performance; blocking rates increase fast and they reach very high values 36% for Op1, 21% for Op2 and 35% for Op3. NP-BPA proves the efficiency of load balancing between service operators, in order to prevent overloading situation and affect user acceptance.
5.3 Global Achieved Profits
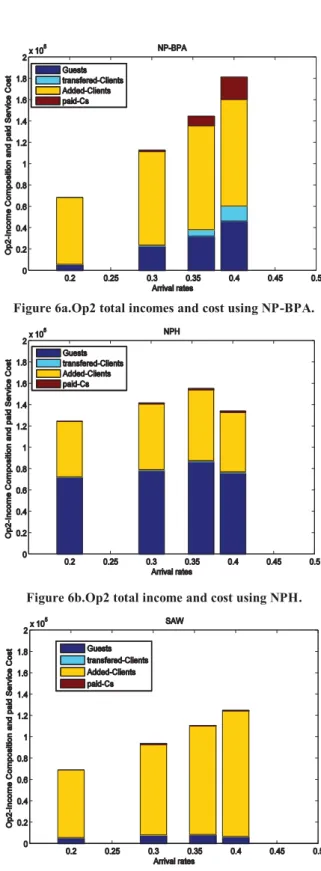
Figure 4a, 4b and 4c show the global achieved profit for Op1, Op2 and Op3, respectively, using NP-BPA, SAW, SAWp and NPH. The global profit of an operator depends on the amount of income from serving clients, revenue from transferred clients, revenue from served guest users coming from another operator and the amount of transaction cost charged when transferring clients. With NP-BPA Op1 and Op3 achieve the highest profits which increase with the arrival rate. While, Op2 maximizes its profits using NPH and NP-BPA comes in the second place. Although, Op2’s profit degrades at high arrival rates, with NPH, and is monotonic with NP-BPA, SAW and SAWp. Notice that SAW and SAWp have a very close performance concerning the
Figure 2. Global blocking percentages achieved using NP-BPA, SAW, SAWp and NPH.
Figure 3a. Blocking rates achieved by Op1's network with NP-BPA, SAW, SAWp and NPH.
Figure 3b. Blocking rates achieved by Op2's network with NP-BPA, SAW, SAWp and NPH.
Figure 3c. Blocking rates achieved by Op3's network with NP-BPA, SAW, SAWp and NPH.
global achieved profits, and when they differ, SAWp achieves higher profits than SAW, which is clear for Op3. In fact for this operator, SAW and SAWp achieve high levels of profits and come in the second place.
For Op1, since NP-BPA reduced a lot the client rejection, more revenues are available from added clients (users served by their home operator) and from transferred clients (users served by another service operator). In addition, NP-BPA guarantee the selection of the service operator with lowest Cs, which reduces the total Cs paid when transferring clients. Figures 5a, 5b and 5c show the total income and cost for Op1 using NP-BPA, NPH and SAW, respectively. One can see that with NP-BPA more clients are served ( added or transferred) and a small amount of guest users is served (coming from other operators) and the paid transaction cost Cs is minimized. With SAW high blocking rates are scored and Op1 lost additive incomes.
It is the same case with Op3, Figure 7a, 7b and 7c, adding to that SAW and SAWp guarantee more profits than NPH, because with SAW and SAWp more clients are served and Op3 is not penalized by the service of guest users.
For Op2, the profits gained using NPH overcome profits from other methods. However, NPH did not improve user rejection, and profit gains are from the high number of guest users that were transferred to Op2 as shows Figure 7b. At high arrival rates, Op2 is unable to transfer its users with NPH to another service operator because lack of resource, nether serve new guest users, thus profits degrade.
6. CONCLUSION
In this paper, we have used Simple Additive Weighting (SAW) methods, Nearest Performance Handover (NPH) algorithm and our previously proposed algorithm for the Nearest Performance and Best Profit Access (NP-BPA) for the access selection in a multi-operator environment. We have investigated the performance of these algorithms in a system formed of three operators. Performance analyses have been made in terms of user blocking percentages and global achieved profit. Simulation results showed that our decision algorithm guarantee the lowest blocking probability for all operators, it prevents overloading operator’s with high numbers of guest users which affect own clients acceptance. In addition, it improves global achieved profits for all cooperating operators. However, SAW methods showed better performance than NPH concerning users blocking percentages, but NPH guarantees higher profits than SAW methods for the operators with limited capacity.
Future work will investigate the performance of our decision algorithm in a hybrid access mode, where operators decide to reserve a part of their resource only for their own clients.
Table 1. Operators Network Parameters Operator QoS parameters BW (Kb/s) Mean Jitter (ms) Mean End-to-end Delay (ms) BER (dB) Op1 1700 6 19 10-3 Op2 11000 10 30 10-5 Op3 5500 12 45 10-5
Figure 4a. Op1's global achieved profit using NP-BPA, SAW, SAWp and NPH.
Figure 4b. Op2's global achieved profit using NP-BPA, SAW, SAWp and NPH.
Figure 4c. Op3's global achieved profit using NP-BPA, SAW, SAWp and NPH.
Figure 5a.Op1 total income and cost using NP-BPA.
Figure 5b.Op1 total income and cost using NPH.
Figure 5c.Op1 total income and cost using SAW.
Figure 6a.Op2 total incomes and cost using NP-BPA.
Figure 6b.Op2 total income and cost using NPH.
Table 2. Operators Network Parameters Application type Application Requirements Jitter (ms) Mean End-to-end Delay (ms) BER (dB) Real-Time 10 100 10-3 Non Real-Time 20 150 10 -5
7. REFERENCES
[1] Cisco Visual Networking Index: Global Mobile Data Traffic Forecast Update 2014–2019. White Paper c11-520862. Available on
http://www.cisco.com/c/en/us/solutions/collateral/service- provider/visual-networking-index-vni/white_paper_c11-520862.html.
[2] Checko, A., Christiansen, H. L., Yan, Y., Scolaris, L., Kardaras, G., Berger, M. S., and Dittman, L. 2014. Cloud RAN for mobile networks-a technology overview. IEEE Communicnetworks-ations surveys &networks-amp; tutorinetworks-als,
vol. PP, No. 99, September 2014.
[3] Johansson, K. 2007 Cost Effective Deployment Strategies for
Heterogenous Wireless Networks. Doctoral Thesis. KTH University,
Stockholm.
[4] Farhat, S., Samhat, A., and Lahoud, S. 2014. Hybrid Decision Algorithm for Access Selection in Multi-operator Networks. In
Proceeding of the IEEE WCNC’14 (Istanbul, Turkey, April 2014).
[5] RAN Sharing: NEC’s approach towards active radio access network sharing. White Paper 2013. Available on
http://www.nec.com/en/global/solutions/nsp/lte_sc/doc/wp2013-3.pdf.
[6] G. Fortetsanakis, M. Papadopouli, G. Karlsson, M.Dramitinos, E.A. Yavuz, “To subscribe, or not to subscribe: Modeling and analysis of service paradigms in cellular markets”, in Proc. IEEE DYSPAN’12, Bellvue, USA, October 2012.
[7] X.Cao, H. Shen, R. Miloto and P. Wirth, “Internet Pricing with Game Theoretical Approach: Concepts and Examples”, IEEE/ ACM Transactions on Networking, Vol. 10, April 2002.
[8] H. Kamal, M. Coupechoux and P. Godlewski, “Inter-operator spectrum sharing for cellular networks using game theory,” in Proc. IEEE PIMRC’09, Tokyo, Japan, September 2009.
[9] Elias, J., Martignon, F., Chen, L., and Altman, E. 2013. Joint Operator Pricing and Network Selection Game in Cognitive Radio Networks: Equilibrium, System Dynamics and Price of Anarchy. IEEE
Transaction on Vehicular Technology, vol. 62, No. 9 (November
2013).
[10] Gajié, V., Huang, J., and Rimoldi, B. 2013. Competition of Wireless Providers for Atomic Users. IEEE/ACM Transactions on Networking
,2013.
[11] Farhat, S., Samhat, A., Lahoud, S. and Cousin, B. 2015. Access Selection and Joint Pricing in Multi-Operator Wireless Networks: A Stackelberg Game. In proceedings of DICTAP’15( Beirut, Lebanon,
April-May 2015).
[12] L. Wang and G.S. Kuo, “Mathematical Modeling for Network Selection in Heterogenuous Wireless Networks-A Tutorial”, IEEE Communications serveys& tutorials 2011.
[13] E. Stevens-Navarro and V. Wong, “Comparison between vertical handoff decision algorithms for heterogenous wireless networks,” in Proc. IEEE VTC, May 2006.
[14] F.W. Karam, and T. Jensen, “A QoS based Decision Algorithm in next generation networks,” in Proc. IEEE ICCM’12, Seoul, Korea, April 2012.
[15] Q. Song and A. Jamalipour, “A network selection mechanism for next generation networks,” in Proc. IEEE ICC’05, Seoul, Korea, May 2005.
[16] 3rd Generation Partnership Project, Technical Specification Group Radio Access Networks; TR 22.951 v11.0.0, Service aspects and requirements for network sharing (Release 11), October 2012. Figure 7a.op3 total income and cost using NP-BPA.
Figure 7b.Op3 total income and cost using NP-BPA.
Table 3. Service operator selection percentages (%)
NP-BPA SAW SAWp NPH
To
from Op1 Op2 Op3 Op1 Op2 Op3 Op1 Op2 Op3 Op1 Op2 Op3
Op1 - 99,5 0.5 - 100 0 - 100 0 - 0 100
Op2 0 - 100 0 - 0 0 - 0 0 - 0