June 12th -15th, 2016, Portorož, Slovenia © 2016 Elsevier B.V. All rights reserved. http://dx.doi.org/10.1016/B978-0-444-63428-3.50304-0
Design and Evaluation of a High-Density Energy
Storage Route with CO
2Re-Use, Water Electrolysis
and Methanol Synthesis
Grégoire Léonard,a* Davide Giulini,a Diego Villarreal-Singerb
a
University of Liège, Process, Environment and Products (PEPs), Allée de la Chimie B6a, Liège 4000, Belgium
b
Columbia University, Lenfest Center for Sustainable Energy, Department of Earth and Environmental Engineering, 938 Mudd, 500 W120st., New York City 10025, NY, USA
Abstract
The energy transition corresponding to more electricity generation from variable and decentralized renewable energy sources requires the development of electricity storage technologies ranging from seconds to seasons. The power-to-fuel process provides a way to store electricity as a liquid energy vector, leading to high energy density and cheap long-term storage at ambient conditions. In the present work, we study the power-to-methanol process combining CO2 capture, water/CO2 co-electrolysis and methanol
synthesis. An Aspen Plus model focussing on the electrolysis and methanol synthesis sub-processes is presented. The energy conversion efficiency is improved from 40.1 to 53.0 % thanks to heat integration using the pinch method. Further works include the experimental demonstration of this technology as well as the development of control strategies for its regulation.
Keywords: Power-to-fuel, energy storage, process modelling, heat integration.
1. Introduction
In the context of climate change, the European Commission has set goals to cut CO2
emissions by 80-95 % in 2050 compared to 1990 levels and up to 96-99 % in the electricity sector (European Commission, 2012). In consequence, challenges appear due to the higher share of variable renewables in the electricity grid which conflicts with the low flexibility of most conventional generators. Besides demand-response and better grid interconnections, a third solution to match demand and supply at any time consists in developing efficient means to store and release electrical energy. In a previous work (Léonard et al., 2015a), we showed that seasonal patterns appear in the storage level when electricity is produced from variable renewables only. Thus, storage technologies playing on time-scales varying from seconds to seasons are required. In the present paper, we study a power-to-fuel process in which electricity (presumably from renewable sources) is co-electrolysing water and CO2 (presumably from flue gas
capture) to produce syngas that is then reacted into methanol as liquid energy vector. Liquid fuels like methanol have a high energy density, both gravimetric and volumetric (22.4 MJ/kg for methanol vs. less than 1 MJ/kg for batteries or pumped hydro storage; 17.8 MJ/L vs. 0.01 and 0.03 MJ/L for H2 or CH4 respectively). This high energy density
and the stability of methanol at ambient conditions make its long-term storage and transport easy and very cheap. Moreover, methanol can be converted back to electricity
(via fuel cell or combustion) or used as a fuel substitute for transportation thanks to its interesting properties compared to gasoline. Finally, if produced with renewable energies and captured CO2, methanol may also be considered as a decarbonized energy
carrier, opening the way to the “Methanol Economy” discussed by Olah (2005). Although all sub-processes of the power-to-methanol technology have been extensively studied, very few modelling works of the whole process were found. A preliminary evaluation of the combined process (Sayah et al., 2010) evidenced the price of water electrolysis as limiting factor for the technology economic viability. However, no simulation was performed in this theoretical study and no interaction between the three sub-processes was considered. Galindo Cifre and Badr (2007) performed a cost evaluation of different methanol synthesis routes, stating that using syngas from biomass gasification leads to lower methanol cost than using syngas from electrolysis and CO2 capture. Again, no process modelling was performed in this study. More
recently, a study has investigated the flexibility of methanol synthesis at varying hydrogen flow rates resulting from intermittent energy sources (Fournel and Wagner, 2013). This study was performed in the framework of the French project VItESSE², and it led to an optimized design of the methanol synthesis reactor. However, the CO2
capture and water electrolysis were not modelled in details, so that there is still a knowledge gap about the process integration that may be achievable. Moreover, the main drawback of the power-to-fuel process is the low conversion efficiency, reaching about 50 % (LHV) in industrial conditions (Lübbehüsen and Becker, 2014). Thus, the present work proposes a model of the power-to-methanol process with focus on improving the integration of the water/CO2 co-electrolysis and methanol synthesis
sub-processes. The main modelling assumptions are discussed and the results of a heat integration using the pinch method are presented in the next sections.
2. Model description
The modelling study is performed using Aspen Plus. Three sub-processes are described in the followings: CO2 capture, water/CO2 co-electrolysis and methanol synthesis. The
model has been designed to produce 1.12 tonnes of methanol per hour.
2.1. CO2 capture
The CO2 capture model for the present study was previously presented (Léonard et al.,
2014 and 2015b). Process improvements and optimized flowsheet configurations led to a heat requirement of 2.92 GJ/tCO2 (electricity consumption of the process utilities can
be neglected in first approach). However, the CO2 capture sub-process is not included in
the heat integration described in the present work, but the value mentioned above is used for the calculation of the global power-to-fuel efficiency.
2.2. Water/CO2 co-electrolysis
The water/CO2 co-electrolysis is performed in a solid oxide electrolysis cell operating at
850°C and atmospheric pressure. The thermodynamic model is RK-Aspen, based on the Redlich-Kwong-Soave equation of state. Besides CO2 and water, some hydrogen is also
present at the system inlet as reducing agent to avoid coke formation on the electrodes. The cell operates at thermoneutral point, meaning that no heat needs to be supplied or removed and that the energy necessary for the reactions is supplied as electrical energy.
The electrolysis sub-process is modelled in three stages (Redissi and Bouallou, 2013). The first and third stages consist in reactors bringing all components to equilibrium according to the reverse water-gas shift reaction before and after the cell respectively. The second stage performs the actual water and CO2 splitting reactions. Between the
second and third steps, a separator block separates the produced syngas from the pure oxygen stream that is released at the anode. The electrolysis reactions are modelled assuming fixed conversion rates of 70% for CO2 and H2O, similarly to experimental
results from the literature (Sun et al., 2012). This model was validated under similar conditions (H2O/CO2/H2 ratio of 45/45/10) to those described by Sun et al. (2012),
leading to similar results as presented in Table 1. Then, the composition of the feed was adapted to the current system (H2O/CO2/H2 ratio of 100/45/10) to obtain a higher H/C
ratio at the inlet of the methanol synthesis reactor, necessary for methanol synthesis.
Table 1. Comparison of the present electrolysis model with literature results. Component mol-% in
electrolysis outlet gas
This work Sun et al. (2012) Relative error (%)
H2O 15.2 15.0 1.33
H2 39.7 40.0 0.75
CO 33.2 32.0 3.75
CO2 11.7 12.0 2.50
2.3. Methanol synthesis
Regarding the methanol synthesis, the process we modelled is based on the experimental work of Bos and Brilman (2014) that described a small-scale methanol reactor with internal condensation. Indeed, setting a temperature gradient within the reactor allows to condensate the produced methanol and thus to shift the equilibrium in the gas phase towards very high conversion rates. As a result, the conversion of the reactants into methanol reaches very high values in the range of 99.5 % at 250 °C and 50 bar. The experimentally observed methanol selectivity is also higher than 99.5%, so the methanol reactor is modelled as an equilibrium reactor with no side reactions, the only reactions taking place being the synthesis of methanol from CO2 and the reverse
water-gas shift reaction. The internal condensation reactor’s model includes a recycling loop from which methanol is condensed out at 25 °C and 50 bar. A purge stream of 2% of the recycling loop is set to avoid the accumulation of inert compounds, although these have not been modelled in first approach. As a consequence of the high selectivity of the methanol synthesis, the only required purification step is the removal of the water by-product from the final methanol product, which is done by distillation (11 theoretical stages, atmospheric pressure). The same thermodynamic model as for the electrolysis is used at the exception of the methanol distillation column that employs the NRTL model due to the presence of a polar mixture in liquid phase. Similarly to the results presented by Bos and Brilman (2014), the model results in conversion rates larger than 99.5 %.
2.4. Global flowsheet
The flowsheet of the resulting process including water/CO2 co-electrolysis, syngas
Figure 1. Flowsheet of the power-to-fuel process (CO2 capture is not represented)
3. Results
We first briefly describe the main results of the pinch analysis, and then we compare the conversion efficiencies obtained before and after heat integration.
3.1. Heat integration
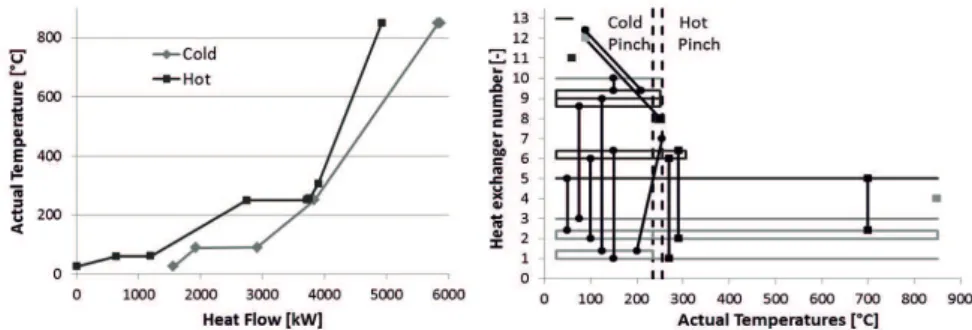
A systematic heat integration was performed using the pinch method as described by Douglas (1988). We assume a minimum temperature difference of 20 K in the heat exchangers. As shown in Figure 2 (left) by the composite curves (relative heat duties versus temperatures levels), the pinch point is identified at 245.2 °C. The overlap between the hot and cold composite curves represents the maximum heat recovery possible within the process, i.e. 3362 kW heat exchange between hot and cold streams. The maximal heat recovery can be reached if an optimal heat exchangers network is implemented, composed of 12 heat exchangers represented by the matches between hot (black) and cold (light grey) streams in Figure 2 (right). The main contributions to the heat recovery are (1) 1116 kW heat flowing from the hot syngas (at the electrolyser outlet) to the water feed heating (before the electrolyser), (2) 962 kW heat as a part of the heat generated by the methanol synthesis recovered in the reboiler of the methanol distillation column and (3) 506 kW recovered inside the internal condensation reactor, this last contribution coupling the heat recovered when cooling the product gas for methanol to condensate with the heat provided to the unreacted syngas after methanol condensation to bring it up back to the reaction temperature. These three heat exchangers alone already represent 77 % of the maximum heat recovery achievable in a perfect heat exchanger network with 12 heat exchangers.
In addition to the 12 heat exchangers, 6 cold and 9 hot utilities are required in the process to remove/supply the minimum amount of external cooling/heating. The overshoot at the bottom of the hot composite curve represents the minimum amount of external cooling required in the optimised process (1563 kW vs. 4925 kW cold utility needed in case of no heat integration), while the overshoot at the top of the cold curve represents the minimum amount of external heating (936 kW vs. 4298 kW in case of no heat integration). This optimal network thus reduces the energy requirement (both cold and hot) by 73%, from 9223 kW down to 2499 kW.
Figure 2. Results of the pinch analysis. Left: Composite curves. Right: Heat exchanger network 3.2. Efficiency calculation
The efficiency of the power-to-methanol process can be calculated following Eq. (1).
(1) İ is the conversion efficiency of power-to-methanol (-), LHVMet and LHVH2 are the
lower heating values of the methanol product and hydrogen feed (to prevent coking on the electrodes), respectively 19.93 and 119.96 MJ/kg. Their flowrates MMet,out and MH2,in
respectively equal 1118.5 and 20.16 kg/h in the present model. Pin and Qin are the power
and heat inputs (cold utilities are neglected in first approximation), represented in Table 2 with and without heat exchanger network. Qin includes 1.606 MW heat necessary for
the capture of 1980 kg/h CO2, although this part was not considered in the pinch
analysis. Table 2 shows that the heat integration improves the conversion efficiency by 32 %, from 40.1 to 53.0 %. The final conversion is similar to the value of 50 % claimed by Lübbehüsen and Becker (2014) for their power-to-liquid process, although the relevance of the comparison is limited: they consider Fischer-Tropsch fuels instead of methanol, and they do not account for heat in the efficiency calculation, but only power. The present work thus provides for the first time, to the best of our knowledge, a conversion efficiency for the power-to-methanol process that is based on detailed modelling and that also includes heat integration of the electrolysis and fuel synthesis.
Table 2. Improvement of the conversion efficiency thanks to heat integration
Parameter MMet,out.LHVmet
MW MH2,in.LHVH2 MW Pin MW Qin MW İ % No heat integration 6.192 0.672 7.873 5.904 40.1
With heat integration 6.192 0.672 7.873 2.542 53.0
4. Conclusions and perspectives
The power-to-methanol process is a promising technology for storing electricity from variable renewable sources under the form of a high-density liquid energy carrier, stable at ambient conditions and offering cheap long-term storage. However, although CO2
been largely studied, the efficiency of the whole process is still very low and only a few studies so far have considered the power-to-fuel process as a whole.
In the present work, we propose a process model including water-CO2 co-electrolysis
and methanol synthesis. We then perform a heat integration following the pinch method to improve the process performances, leading to a 32 %-improvement of the process efficiency, from 40.1 to 53.0 % (LHV basis). As far as we know, the present work thus provides for the first time a conversion efficiency of the power-to-fuel technology that is based on detailed process modelling and that includes at least partial heat integration of the different sub-processes. Further improvements may be reached if the CO2 capture
part is included in the heat integration. Moreover, the effect of pressure on the process performances should be studied as experimental results show some interest for that (Sun et al., 2012). In the future, further work may also include experimental demonstration of the process and study of control strategies to adapt the process to the variable availability of renewable electricity sources.
References
M.J. Bos and D.W.F. Brilman, 2015, A novel condensation reactor for efficient CO2 to methanol conversion for storage of renewable electric energy, Chem. Eng. J., 278, 527-532
J.M. Douglas, 1988, Conceptual design of chemical processes, International edition, McGraw-Hill Book Company, 978-0070177628
European Commission, 2012, Energy roadmap 2050, Publication Office of the European Union, Luxembourg, doi:10.2833/10759
S. Fournel and M. Wagner, 2013, Synthèse du méthanol par réduction du CO2 pur par de l’H2 électrolytique à débit variable, Récents Progrès en Génie des Procédés, 104
P. Galindo Cifre and O. Badr, 2007, Renewable hydrogen utilisation for the production of methanol, Energy Conversion and Management, 48, 519-527
G. Léonard, D. Toye, G. Heyen, 2014, Assessment of solvent degradation within a global process model of post-combustion CO2 capture. Computer Aided Chemical Engineering 33, 13-18 G. Léonard, V. François-Lavet, D. Ernst, C.J. Meinrenken, K.S. Lackner, 2015, Electricity
storage with liquid fuels in a zone powered by 100% variable renewables, Proceedings of the IEEE European Energy Market conference, 978-1-4673-6692-2
G. Léonard, C. Crosset, D. Toye, G. Heyen, 2015b, Influence of process operating conditions on solvent thermal and oxidative degradation in post-combustion CO2 capture, Computers & Chemical Engineering Journal 83, 121-130.
G. Olah, 2005, Beyond oil and gas: the methanol economy, Angewandte Chemie International Edition, 44, 2636-2639
Y. Redissi and C. Bouallou, 2013, Valorization of carbon dioxide by co-electrolysis of CO2/H2O at high temperature for syngas production, Energy Procedia, 37, 6667-6678
K. Sayah, S. Hosseinabadi, M. Farazar, 2010, CO2 Abatement by methanol production from flue-gas in methanol plant, Engineering and Technology, 45, 90-93
X. Sun, M. Chen, S. H. Jensen, S.D. Ebbesen, C. Graves, M. Mogensen, 2012, Thermodynamic analysis of synthetic hydrocarbon fuel production in pressurized solid oxide electrolysis cells, International journal of hydrogen energy, 37, 22, 17101-17110
S. Lübbehüsen and S. Becker, 2014, Power-to-liquids: Fuels from solar energy, CO2 and water, Bilfinger industrial technologies, www.sunfire.de, accessed in October 2015.