Definition of a modern breeding goal in Belgian Blue cattle
Frank Coopman1, Alain Krafft2 and Nicolas Gengler31Animal Genetics, Breeding and Ethology Unit
Veterinary Faculty, University of Ghent, B- 9820 Merelbeke, Belgium
2
Centre d’Economie Rurale, Div. Information et Promotion, B-6900 Marloie, Belgium
3Animal Science Unit, Gembloux Agricultural University, B-5030 Gembloux, Belgium
Abstract
Objective of this study was to define and derive a modern breeding goal for Belgian Blue cattle. This breed is well known for its hyper-muscularity and current selection is based on this trait. Also considered in the current recording schemes are several other traits with early growth, up to one year of age and linear type traits being the most important. But the correct economic weightings of these traits and eventual other more functional, but not necessarily yet recorded traits, as calving ease, fertility and legs and feet, are still unclear. Therefore profit functions and bio-economical models were defined based on biological and economic data from the field. They were used to derive economic weights for already recorded and some new traits covering especially functional traits. An overall breeding goal was defined differentiating between different macro-economic and herd-specific situations and between breeding goal traits not necessarily recorded or difficult to record, and traits in the information vector.
1. Introduction
Cattle from the Belgian Blue Breed (BBB) present extreme muscularity. The current breeding objective is basically this trait. Genetic evaluations are assessed by single trait BLUP sire model that uses relationships among sires. The BLUP evaluations for the value/kg live weight and the weight at 13 months are combined to the official economic index («EC-IN»). But economic circumstances are changing. For this reason, a modern breeding goal including also functional traits has to be defined. The objective of this study was to do this using a bio-economical model.
2. Material and Methods
as well on the myostatine gene (Georges et al., 1990) created a well muscled animal, famous for his high yield of meat. After 1965, selection on muscularity increased, traditional double-goal animals were replaced and a new breed was established. It is now known as the «Belgian Blue Breed» (BBB).
Despite some efforts to direct selection towards growth and stature, most breeders are still focusing on muscularity. A consequence of this development was the systematic use of the caesarean section which incidence is nearly 100%.
2.2. Economical and Biological Data Production circumstances on BBB beef farms are very variable, therefore in
whenever they were in heat between 13 and 15 months. Cows were inseminated again 60 to 80 days after calving (100% caesarean). After two unsuccessful inseminations they were bred to the bull of the farm. Five months after calving, they were separated from the bull. When back in heat or when pregnancy was not confirmed by rectal examination (within two months after retreating), cows were fattened and sold. With this management, the breeding interval was around 385 days. Male calves were fattened to a weight of around 650 kg to 750 kg live weight, corresponding to about 19 to 22 months at slaughter. Table 1 gives current feeding costs at the reference farm used for the bio-economic model. No variation in feeding costs was considered. Total feed cost for different groups and sexes was equal to price per kg multiplied by the amount of food given to this group of animals. Feeding costs were assumed to be about 60% of all costs (including e.g. labour, housing and veterinary costs). Therefore, total cost were computed as 1.4 times the feeding costs.
2.3. Model
The methods were similar to Bekman and Van Arendonk (1993), but the partial differentiation of the extremely complicated profit equation was avoided and replaced by a numeric approximation. Tables 2 and 3 give information about management decisions and other biological parameters used in the model. Prices in Table 2 were those reported for 15/10/1999 in different markets in Belgium. The average weight of first calving cow (first calvers) was considered
to be 450 kg on the age of 24 months, average weight of later calvers was considered to be 700 kg. Live weight of the females was changed slightly considering a phenotypic correlation of 0.25 between female and male growth between 13 months and slaughter age. Profit per female animal was calculated by multiplying adjusted live weight (-4 %) by the price per kg live weight, minus total cost. The slaughter weight of the bulls was the weight at 13 months plus weight gain between 13 months and slaughter age. Weight gain depended of growth between 13 months and slaughter age. Adjusted slaughter weight (-4 %) multiplied by price per kg live weight was total income for a fattened bull. Income minus total costs equalled profit. Overall income on the farm was expressed as profit per fattened bull. This takes into account financial (short-term) incomes or losses in all segments of the farm and the financial income when selling female calves. It did not take into account the possible financial upgrading of animals due to increased genetic merits.
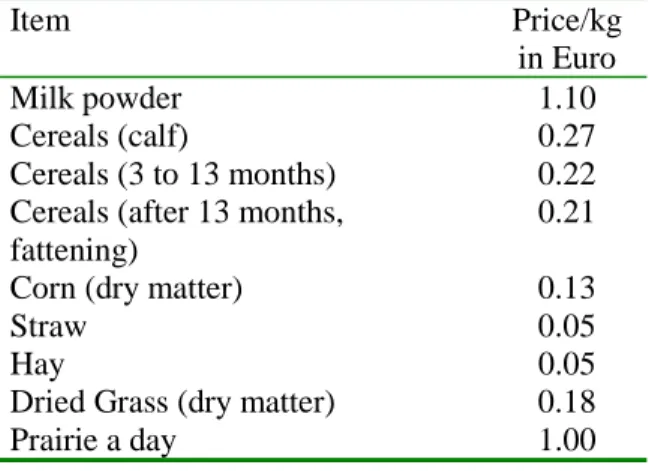
Table 1. Reference feeding costs
Item Price/kg
in Euro
Milk powder 1.10
Cereals (calf) 0.27
Cereals (3 to 13 months) 0.22 Cereals (after 13 months,
fattening)
0.21
Corn (dry matter) 0.13
Straw 0.05
Hay 0.05
Dried Grass (dry matter) 0.18
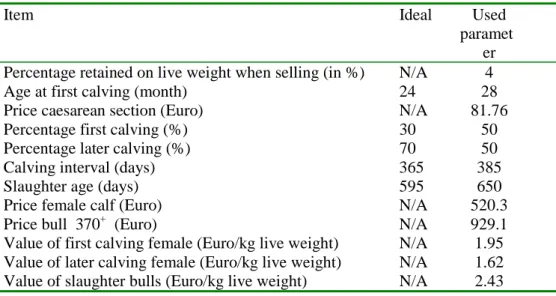
Table 2. Management decisions and market influences (15/10/1999)
Item Ideal Used
paramet er Percentage retained on live weight when selling (in %) N/A 4
Age at first calving (month) 24 28
Price caesarean section (Euro) N/A 81.76
Percentage first calving (%) 30 50
Percentage later calving (%) 70 50
Calving interval (days) 365 385
Slaughter age (days) 595 650
Price female calf (Euro) N/A 520.3
Price bull 370+ (Euro) N/A 929.1
Value of first calving female (Euro/kg live weight) N/A 1.95 Value of later calving female (Euro/kg live weight) N/A 1.62 Value of slaughter bulls (Euro/kg live weight) N/A 2.43
Table 3. Biological variables
Traits Average
value Birth weight male calves (kg) 51.4 Weight of males at 13 months (kg) 396.8 Average daily growth (13 months
to slaughter, kg/day)
1.295 Survival rate (birth to 6 month, %) 90 Percentage caesarean (%) 100
The typical situation for southern Belgium is that young bulls are sold at an age of 11 to 13 months (Model 2). In Model 1 however, fattening of these bulls was on the same farm. The income for the bulls depended also on its conformation. The merchandiser pays a global price to the farmer. Total costs raising the bulls were lower.
Within each model influences of the variations of the different variables on the profit a fattened bull (Model 1) or young bull (around 10-13 month) (Model 2) were examined in an independent way. Changes
in the bio-economic model. Including these traits would be an important improvement. Functional conformation is recorded in BBB using linear type scores (Hanset et al., 1996), and predicted breeding values could be made available for selection.
2.4. Definition of breeding goal and computation of economic weights
Those traits showing the highest relative importance relative per genetic SD were chosen as breeding goal traits. Traits in the information vector index were those that are or could be easily recorded. (Co)variances were extracted from the literature (Everett and Magee, 1965; Hanset et al., 1987; Gengler et al., 1995; Pâquet, 1997; Molina et al., 1999). Economic weights for the information index traits (x) were computed using the genetic correlations among all traits and the genetic standard deviations. The
where C represents the involved genetic (co)variance matrices. If weights are expressed relative to a genetic standard deviation the genetic (co)variance matrices become correlation matrices. The vector of economic weights for the breeding goal traits is not equal to the vector of marginal changes in the profit function. It corresponds to the vector of economic weights obtained taking into account genetic (co)variances among those traits. Therefore wbgcan be obtained as:
σ ∂ ∂ = − 2 t , g 1 bg bg t f C w where σ ∂ ∂ 2 t , g t f is a diagonal matrix of marginal profits times its genetic variance for every trait t.
3. Results and Discussion
3.1. Model
Having heifers bred from 13 months can have considerable influence on profit (Table 4). Keeping old cows instead of replacing them by young females is worthwhile to be considered. Old cows give a calf every year. Young females remain on the farm for at least two years before having their first offspring. Female calves out of dams with low production, fertility or other disappointing traits should not remain on the farm. Reducing calving interval has a positive effect due to decreasing costs. Reducing slaughter age makes one has lesser live weight what is influencing total income a bull.
Increasing birth weight has no effect on profit on by itself (Table 5). One can expect that the lower the birth weight, the higher the survival rate and the lesser caesareans. Weight at 13 months affects profit, because it influences the final weight of the slaughter bull. The more
growth between 13 months and slaughter, the heavier the bulls and the more total income the farmer has.
Table 4. Changes in the profit function due
to management decisions (Model 1 and 2)
Item Change Profit
(Euro) First calving age -1 month +71.7 Ratio first/later calvers 49/51 +34.9 Calving interval minus 1 day - 1 day +2.8 Slaughter age minus 1 day -1 day -0.7
Better survival rate influences profit too as the lost of a calf means loosing all profit attached to it. Having a better price/kg live weight influences profit. Higher prices can due to market changes or because of better conformation. The value per kg weight alive reveals the muscularity of the animal and therefore is a good parameter for conformation (Gengler et al., 1995). The effect of lesser caesareans is small. Only the direct influence (veterinary costs) has been taken in account. Lesser caesareans make old cows last longer on the farm and calving interval to decrease. Having lesser caesareans therefore might have bigger influence than this model can show. But unfortunately there was no data available that might have been used to model these indirect influences. For some traits using Model 2 reduced marginal profits (see Table 6). The result for growth after 13 month was expected, but the fact that the importance of survival rates is reduced may be surprising. It can be explained from a proportional lower profit compared to Model 1 because of the non-consideration of the added value during fattening for an animal more.
Table 5. Marginal changes in the profit function due to changes in biological traits expressed
as function of genetic standard deviations (Model 1 – fattened bulls sold)
Item h2 Genetic SD Profit (Euro)
Birth weight 0.22 3.73 kg +0.0
Weight at 13 months 0.50 34.23 kg +78.7
Average daily gain between 13 months and slaughter 0.32 0.109 kg +126.0
Survival rate 0.10 0.95 % +38.4
Cesarean section incidence 0.10 0.95 % -1.7
Price per kg live weight: first calvers 0.14 0.041 Euro +23.0 Price per kg live weight: later calvers 0.14 0.041 Euro +31.9 Price per kg live weight: fattened bulls 0.14 0.041 Euro +28.6
Table 6. Marginal changes in the profit function due to changes in biological traits expressed
as function of genetic standard deviations (Model 2 – young bulls sold)
Item h2 Genetic SD Profit (Euro)
Average daily gain between 13 months and slaughter 0.32 0.109 kg +61.8
Survival rate 0.10 0.95 % +28.1
3.2. Breeding goal and economic weights Results reported in Tables 5 and 6 suggest that the most important traits seem to be growth then come conformation traits expressed as prices per kg live weight and functional traits. The information vector will obviously be smaller as cesarean section incidence will not be available due to systematic cesareans. Survival rate was formerly reported and could be easily added. Only one conformation score was retained: price of the fattened bull. For model two the
same breeding goal was defined but the marginal profit values for two traits (table 6.) changed.
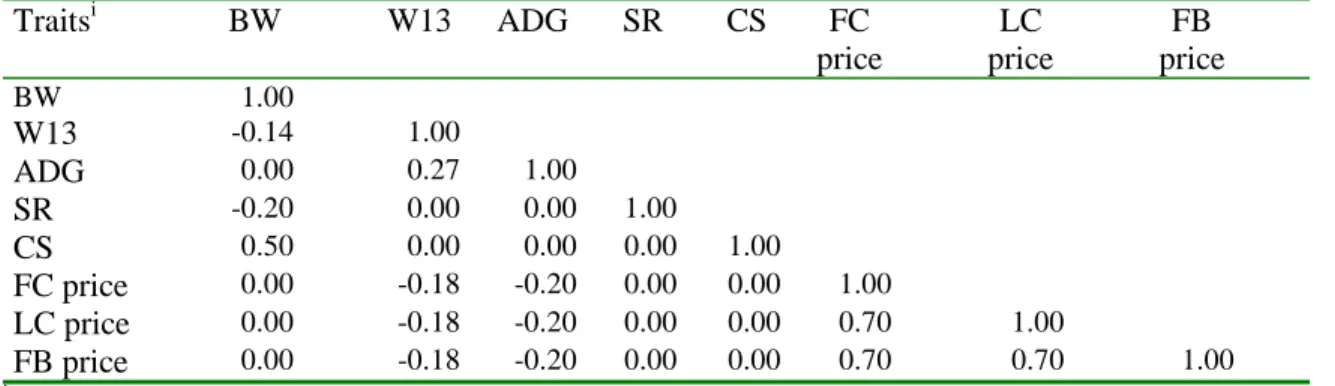
Table 7 tries to give the known/assumed genetic correlations across traits. Unfortunately very few results are known as there has been a lack of research and interest to study these parameters in BBB. Therefore the results obtained should be considered preliminary, improved knowledge of the results in Table 7 might change them considerably.
Table 7. Genetic correlation matrix among some important traits
Traitsi BW W13 ADG SR CS FC price LC price FB price BW 1.00 W13 -0.14 1.00 ADG 0.00 0.27 1.00
Table 8. Economic weights relative to a genetic SD, and expressed in percentage of
importance in overall index (Model 1 – fattened bulls sold)
Item Economic weight
(Euro)
Economic weight (%)
Birth weight 16.7 5
Weight at 13 months 59.4 20
Average daily gain between 13 months and slaughter
122.7 40
Survival rate 41.7 14
Price per kg live weight: fattened bulls 63.8 21
Table 9. Economic weights relative to a genetic SD, and expressed in percentage of
importance in overall index (Model 2 – young bulls sold)
Item Economic weight
(Euro)
Economic weight (%)
Birth weight 17.0 7
Weight at 13 months 76.6 33
Average daily gain between 13 months and slaughter
51.7 23
Survival rate 31.5 14
Price per kg live weight: fattened bulls 52.7 23
Results in Tables 8 and 9 show that selling young or fattened bulls does not change the economic values fundamentally. Conformation expressed as price per kg live weight of the fattened bulls was always dominant with around 20% of relative importance in the overall index. This value is close to the 20% that were reported by Pâquet (1997). If the economic objective is to produce a young bull the economic weight given to growth is going down from 60% to 56%. Inside growth traits we noticed the expected shifting of emphasis to earlier growth if young bulls are sold. If we consider birth weight and survival as functional traits the relative importance of these traits are around 20%.
4. Conclusions
This study shows how a bio-economic model can be used to define a modern breeding goal in BBB cattle. Developing a more detailed and precise bio-economical model requests more sophisticated accounting and a better data collection in all types of production circumstances. Also additional research is need to get better estimates of variances and covariances.
Economic values developed showed an approximate separation of relative economic weights of 20/60/20 for conformation/growth/functional traits. These results unfortunately are only preliminary as a lot of black spots remain. A lot of additional research is needed. Also some important traits as fertility and functional conformation were yet not used.
References
Everett, R.W., Magee, W.T., 1965. Maternal ability and genetic ability of birth weight and gestation length. J. Dairy Sci. 48, 957-961.
Bekman, H., and Van Arendonk, J.A.M., 1993. Derivation of economic values for veal, beef and milk production traits using profit equations. Livest. Prod. Sci. 34, 35-56.
Gengler, N., Seutin, C., Boonen, F., Van Vleck, L.D., 1995. Estimation of genetic parameters for growth, feed consumption and conformation traits for double-muscled Belgian Blue Bulls performance-tested in Belgium. J. Anim. Sci. 73, 3269-3273.
Georges, M., M. Lathrop, P. Hilbert, A. Marcotte, A. Schwers, S. Swillens, J. Roupain, Y. Bouquet, G. Vassart, and R. Hanset. 1990. Etude du gène «mh» (muscular hypertrophy) bovin par
génétique inverse. Nouvelles de la Science et des Technologies 8, 47-51. Hanset, R., Michaux, G., Stasse, A., 1987.
Relationships between growth rate, carcass composition, feed intake, feed conversion ratio and income in four biological types of cattle. Genet. Sel. Evol. 19, 225-248.
Hanset R., Farnir F., Michaux C., Leroy P., 1996. Linear scoring in the Belgian Blue Cattle Breed: a genetic analysis. Proceeding of the 47th Annual Meeting of the European Association of Animal Production; Norway, August 1996. Molina, A., Rodero, A., Rodero, E.,
Jimenez, J.M., 1999. Repeatibility of growth in retinto beef cattle. J. Anim. Breed. Genet., 116, 61-73.
Pâquet, A. 1997. Modélisation et évaluation des paramètres de croissance en ferme sur taurillons de race BBB pendant la phase d'engraisement.. Travail de Fin d'Etudes (M. Sc. Thesis), Gembloux Agricultural University, Belgium, 75p.