UNIVERSITÉ DE SHERBROOKE
Faculté des lettres et sciences humaines
Département de géomatique appliquée
Identification and characterization of natural
aerosols over the Arctic
Keyvan Ranjbar
Thesis submitted in partial fulfilment of the requirements for the
degree of Doctor of Philosophy (Ph.D.) in Remote Sensing
i
JURY
Supervisor: Prof. Norman T. O’Neill
Internal Member: Prof. Alain Royer
Internal Member: Prof. Yannick Huot
External Member: Prof. Carlos Toledano
i
Abstract
Global warming is one of the most serious challenges that we face today. The Arctic is particularly vulnerable to its effects. Aerosols play a key role in terms of their radiative forcing effects (both directly and indirectly in terms of their influence on clouds). They are, accordingly, one of the greatest uncertainty sources in climate modelling inasmuch as their microphysical, chemical and optical characteristics are not well understood.
Arctic aerosols can be categorized into anthropogenic and natural aerosols. Natural aerosols include black and brown carbon (BC and BrC), dust, sea-salt, volcanic sulphates and ash as well as level Ib polar stratospheric clouds (PSCs). The ultimate goal of the research project was to characterize the optical and microphysical properties of natural aerosols within the constraints of being able to capture specific events of opportunity. While we investigated numerous natural aerosol events over the Arctic, we eventually focussed on two extraordinary events.
In Paper 1, we employed ground-based sunphotometry, ground-based FTIR (Fourier Transform IR) retrievals, lidar profiles, satellite remote sensing and aerosol modelling to analyze an extreme, August-2017 smoke event over Eureka that was driven by pyrocb (extreme convection) fires near Prince George, BC. This paper was, we believe, an innovative and original contribution on various levels: first and foremost, in terms of the event as well as the instrumental infrastructure and expertise that we developed and brought to bear over many years at Eureka. It was also original in terms of the production of a 10-year 𝜏𝑓 (fine mode optical depth) smoke climatology that excluded confounding events such as the 2008 and 2009 Kasatochi and Sarychev stratospheric intrusions of fine mode sulphates. An original constraint on the labelling of 𝜏𝑓 events as smoke events was the correlation between 𝜏𝑓 and FTIR-retrieved CO abundance (CO being a classical smoke product). To demonstrate the extreme nature of the event we employed a "peak over threshold" (POT) analysis of individual 𝜏𝑓 peaks during our 10-year sampling period.
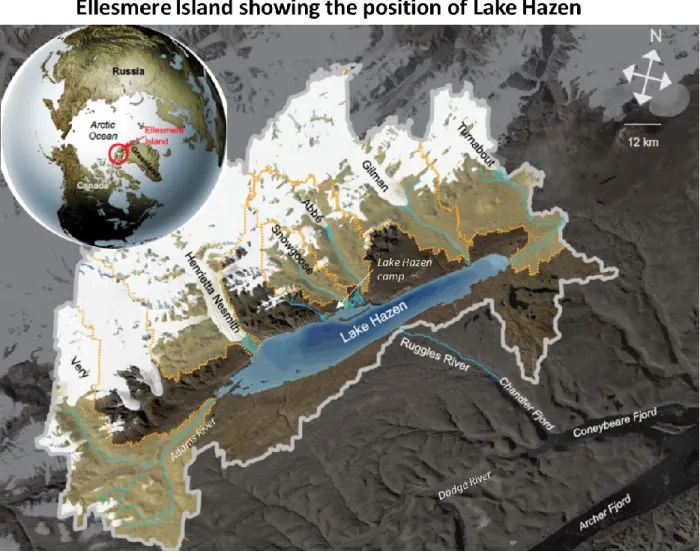
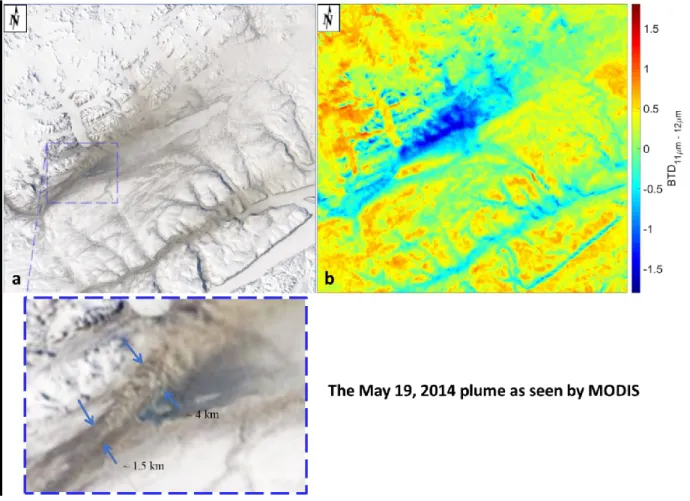
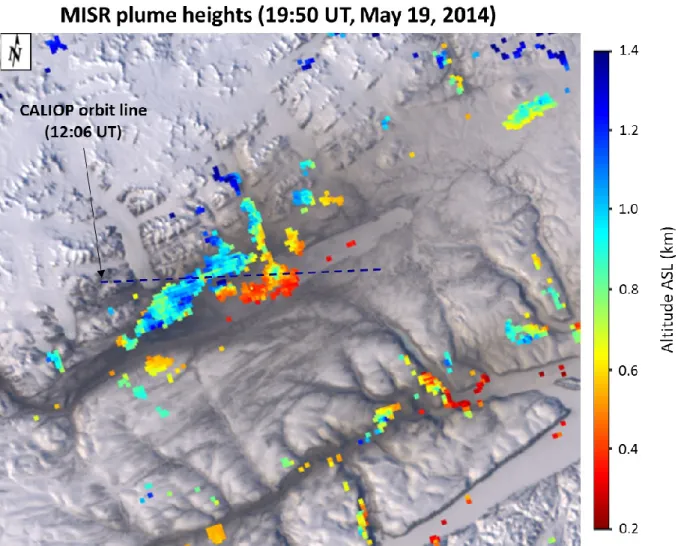
Paper 2 was arguably the most significant and original contribution. It involved the successful application of remote sensing techniques to detect a low-altitude, high-Arctic (81 N) dust plume over Lake Hazen (Ellesmere Island) using a diverse array of passive and active, satellite-based remote sensing techniques. We are not aware of any published remote sensing investigations of
ii
local Arctic dust carried out over the complex surface of snow, ice and dust that was encountered in the Lake Hazen case. We exploited multi-angle and multi-spectral imaging capabilities (MISR and MODIS imagery) as well as the particle size dependant profiling capabilities of active sensors (the CALIOP lidar and the CloudSat radar) to identify and characterize the key physical and optical properties of the dust plume. This was accomplished in spite of the fact that the remote sensing algorithms of all these sensors were not adapted to Arctic conditions. We succeeded in characterizing the upper plume thickness (the region of highest signal-to-noise) in terms of 532 nm optical depth (~ 0.7) and the effective radius of the plume particles (between 18 and 25 m in radius; what the dust community characterize as “giant” dust particles).
iii
Résumé
Le réchauffement climatique est l'un des défis les plus graves auxquels nous sommes confrontés aujourd'hui. L'Arctique est particulièrement vulnérable à ses effets. Les aérosols jouent un rôle clé en termes d'effets de forçage radiatif (à la fois directement et indirectement en termes d'influence sur les nuages). Par conséquent, ils sont l'une des plus grandes sources d'incertitude dans la modélisation du climat dans la mesure où leurs caractéristiques microphysiques, chimiques et optiques ne sont pas bien comprises.
Les aérosols arctiques peuvent être classés selon deux catégories: les aérosols anthropiques et les aérosols naturels. Les aérosols naturels comprennent le carbone noir et le carbone brun (BC et BrC), la poussière, le sel de mer, les sulfates volcaniques et les cendres ainsi que les nuages stratosphériques polaires de niveau Ib (PSC). Le but ultime du projet de recherche était de caractériser les propriétés optiques et microphysiques des aérosols naturels dans les contraintes de pouvoir capturer des événements d'opportunité spécifiques. Bien que nous ayons enquêté sur de nombreux événements d'aérosols naturels dans l'Arctique, nous nous sommes finalement concentrés sur deux événements extraordinaires.
Dans le premier article, nous avons utilisé la photométrie solaire au sol, les récupérations au sol FTIR (Fourier Transform IR), les profils lidar, la télédétection par satellite et la modélisation des aérosols pour analyser un événement de fumée extrême en août 2017 sur Eureka, entraîné par le incendies pyrocb (convection extrême) près de Prince George, en Colombie-Britannique. Selon nous, cet article a été une contribution innovante et originale à divers égards: d'abord en termes d'événements d’aérosols ainsi que l'infrastructure instrumentale et l'expertise que nous avons développées et apportées au fil des années sur Eureka. L’article était également original en termes de production d'une climatologie des fumées 𝜏𝑓 (profondeur optique en mode fin) sur 10 ans qui excluait les événements confondants tels que les intrusions stratosphériques de sulfates en mode fin de Kasatochi et Sarychev de 2008 et 2009. Une contrainte originale sur l'étiquetage des événements 𝜏𝑓 en tant qu'événements de fumée était la corrélation entre 𝜏𝑓 et l'abondance de CO récupérée par FTIR (le CO étant un produit de fumée classique). Pour démontrer la nature extrême de l'événement, nous avons utilisé une analyse ‘‘pic au-dessus du seuil’’ (Peak Over Threshold, POT) des pics 𝜏𝑓 individuels au cours de notre période d'échantillonnage de 10 ans.
iv
Le deuxième article était sans doute la contribution la plus importante et la plus originale de ce projet. Elle impliquait la réussite de l’application de techniques de télédétection pour détecter un panache de poussière à basse altitude et dans l'Extrême-Arctique (81 N) au-dessus du lac Hazen (Ellesmere Island) en utilisant plusieurs techniques de télédétection passives et actives par satellite. Nous n'avons connaissance d'aucune publication traitant de la télédétection de la poussière locale de l'Arctique effectuée sur la surface complexe de neige, de glace et de poussière telle que présente au lac Hazen. Nous avons exploité les capacités d'imagerie multiangles et multispectrales (imagerie MISR et MODIS) ainsi que les capacités de profilage dépendantes de la taille des particules des capteurs actifs (le CALIOP lidar et le radar CloudSat) pour identifier et caractériser les propriétés physiques et optiques clés du panache de poussière. Cela a été accompli malgré le fait que les algorithmes de télédétection de tous ces capteurs n'étaient pas adaptés aux conditions arctiques. Nous avons réussi à caractériser l'épaisseur du panache supérieur (la région du signal comportant le bruit le plus élevé) en termes d’épaisseur optique à 532 nm (~ 0.7) et le rayon effectif des particules du panache (entre 18 et 25 µm de rayon; ce que les spécialistes du domaine qualifient de particules de poussière ‘‘géantes’’).
v
Acknowledgments
Foremost, I would like to express my sincere gratitude to my supervisor, Professor Norman T. O’Neill for his vast contribution to my thesis, for his motivation, enthusiasm and patience, for granting me his confidence and most importantly, his friendship throughout my PhD. You guided me to have a more scientific thoughts, which I am truly grateful and indebted. I would like to thank you for keeping an open door for me all the time, urging me to perfect my research, as well as filling our collaboration at all levels with pleasure. I could not have had a better supervisor. I am grateful to Professor Alain Royer, Professor Yannick Huot, and Professor Carlos Toledano who kindly agreed to be jury members for my thesis during this tough time (Corona virus pandemic).
I would like to thank my lab mates for the scientific discussions and for all the fun we have had in the last four years.
I would like to say a big thank you to my family and especially to my parents for their unconditional love and support. Last but not least, no words can express my gratitude towards my wife, Arezoo, for her love, support and patience during my study.
vi
To my beloved wife, Arezoo
To my parents
vii
Table of Contents
Abstract ... i
Résumé ... iii
Acknowledgments ... v
Sommaire en français ... 1
1.
Introduction ... 7
1.1.
Project Objective ...13
1.2.
Hypothesis ...13
1.3.
Choice of articles ...14
2.
Paper 1: Extreme smoke event over the high Arctic...15
3.
Paper 2: Remote sensing of a high-Arctic, local dust event over Lake Hazen
(Ellesmere Island, Nunavut, Canada) ...40
4.
Conclusions ...59
5.
Future work ...60
1
Sommaire en français
Le réchauffement climatique est l'un des défis les plus importants auxquels le monde est confronté aujourd'hui. L'Arctique est particulièrement vulnérable aux effets de ce réchauffement et divers indicateurs de durabilité ont rapidement décliné au cours des dernières décennies. Depuis plusieurs années, l’augmentation de la température dans l’Arctique est deux fois plus élevée que pour des latitudes plus basses (IPCC, 2013). La fonte de la glace de mer et la libération de méthane sont ainsi deux des manifestations les plus évidentes de ce changement (Serreze et al., 2007) et peuvent affecter tous les climats dans leur ensemble. Par conséquent, la surveillance et l'étude des facteurs environnementaux dans l'Arctique sont susceptibles de fournir des indicateurs pour une détection précoce des futurs changements climatiques (Stocker, 2013).
Parmi ces facteurs, les aérosols ont ainsi un impact important sur cette région du globe. En effet, les courants d'air mondiaux dominants font de l’Arctique une zone de dépôt privilégiée pour les polluants atmosphériques en provenance des basses latitudes (Stohl, 2006). La concentration des polluants à certains endroits dépasse ainsi les niveaux trouvés dans les zones urbaines densément peuplées (Stocker, 2013).
La définition des aérosols, de leurs propriétés et de leurs interactions atmosphériques telles qu’énoncées dans Hind (1999) sont communément employées dans la littérature. L'auteur définit un aérosol comme “une suspension de particules solides ou liquides dans un gaz” (Hind, 1999). Il note en outre que le rayon de ces particules varie d'une fraction de micron à quelques dizaines de microns. Selon les facteurs d'émission et de transport, leur durée de vie atmosphérique peut varier de quelques secondes à environ un an.
Les aérosols interagissent avec la lumière du soleil via les mécanismes optiques de diffusion et d'absorption. Ils redirigent atténuent l'énergie lumineuse en fonction de la longueur d’onde et du faisceau lumineux donné. Ce concept général mène aux formulations des paramètres microphysiques (taille et forme), des paramètres chimiques et optiques (diffusion, absorption et atténuation / extinction) qui caractérisent tout aérosol ou tout groupement d'aérosols dans l'atmosphère.
Les particules d'aérosol peuvent être caractérisées par leurs propriétés extensives et intensives. Les propriétés extensives se réfèrent à la quantité d'aérosol (comme la densité de nombre de PSD
2
(Particle Size Distribution)) tandis que les propriétés intensives se rapportent aux paramètres par particule (ou aux moyennes des paramètres par particule à travers le PSD). Bien que les effets optiques dominants des aérosols soient associés à des propriétés extensives des aérosols, leurs propriétés intensives peuvent également être importantes.
Le paramètre optique le plus important concernant les effets radiatifs atmosphériques, que ce soit étudié depuis le sol ou par imagerie satellitaire (extensive), est l’épaisseur optique des aérosols (AOD). Il décrit en grande partie l'effet de diffusion des aérosols dans la partie réfléchissante du spectre solaire car la composante d'absorption de l'AOD dans ce régime est généralement faible. L'AOD et les paramètres dérivés de la forme spectrale de l'AOD peuvent par ailleurs être divisés en ses composantes extensives et intensives en mode fin et grossier. Les paramètres extensifs incluent (cf. O'Neill et al., 2003) l’AOD en mode total, fin et grossier, tandis que les paramètres intensifs incluent (générique) l'exposant Angstrom total (une régression linéaire classique du premier ordre sur plusieurs longueurs d'onde), la pente spectrale en mode fin et grossier à une longueur d'onde donnée, un rayon efficace en mode fin et grossier, et une fraction en mode fin (FMF; le rapport entre l'AOD en mode fin et l'AOD totale).
L’énergie fournie par le soleil régit en grande partie les climats de la Terre, mais ne parvient pas en intégralité à sa surface. Les aérosols induisent des effets de rétrodiffusion et d'absorption importants qui ont un impact direct sur le forçage radiatif du système surface-atmosphère (ce qu'on appelle communément l'effet direct; voir par exemple IPCC, 2013). Ces effets dépendent du type d’aérosol, les sulfates et nitrates reflètent ainsi une fraction importante du rayonnement et consécutivement refroidissement l'atmosphère. En revanche, le carbone noir est un absorbeur puissant et entraîne un réchauffement de l'atmosphère. Le deuxième effet majeur de forçage radiatif des aérosols (l'effet indirect) est dû à leur rôle de nucléation dans la formation de particules des nuages (gouttelettes d'eau ou cristaux de glace). Les variations des propriétés extensives et intensives des aérosols peuvent donc avoir des conséquences importantes sur les propriétés microphysiques des nuages, leurs propriétés de forçage radiatif, leur durée de vie, etc. (ibid). Les aérosols sont l'une des plus grandes sources d'incertitude dans la modélisation climatique puisque leurs caractéristiques microphysiques, chimiques et optiques, et donc leurs effets directs et indirects, ne sont pas bien caractérisés (ibid).
3
Les aérosols de l'Arctique peuvent être classés en aérosols anthropiques et naturels (Shaw, 1995). Au-dessus de l'Arctique, les aérosols anthropiques sont largement associés au phénomène de brume arctique. Cet effet culmine à la fin de l'hiver / au début du printemps. Il est le résultat du "bol Arctique", dans lequel les sources de pollution sont étendues plus au sud pendant l'hiver polaire (voir Law & Stohl, 2007 par exemple). Ces types d'aérosols ont des concentrations plus élevées en sulfates, en matière organique (OM) et en carbone noir (BC) par rapport aux aérosols naturels (Quinn et al., 2008).
Les aérosols naturels, qui forment le principal objet de cette thèse, comprennent:
• Les aérosols de carbone noir (BC) et de carbone brun (BrC). La source la plus évidente de ces aérosols dans l'Arctique est la fumée de la combustion de biomasses dans les régions du sud (e.g. O’Neill et al. (2008) et Myhre et al. (2007))
• Les poussière (typiquement supramicronique), généralement dues à l'érosion éolienne sur les déserts chinois et / ou à la poussière africaine (Zwaaftink et al., 2016) mais aussi à l'érosion locale estivale dans l'Arctique (Bullard et al., 2016)
• Le sel marin généré par des vents violents sur les eaux océaniques (Jaeglé et al., 2011). • Les sulfates volcaniques submicroniques (O’Neill et al., 2012) provenant de la
condensation de gaz SO2 émis par des volcans en éruption.
• Les nuages stratosphériques polaires de niveau Ib (PSC) (Pitts et al., 2011). Ces aérosols sont généralement formés de sulfates volcaniques submicroniques qui ont pénétré dans la stratosphère.
La télédétection au sol, appuyée par la télédétection satellitaire, est un moyen essentiel de surveillance des aérosols. La télédétection passive et active au sol peut fournir une complémentarité aussi bien qu'une redondance des informations qui permettent l'extraction de presque tous les paramètres essentiels et robustes des aérosols qui influencent le budget de transfert radiatif local.
Il y a relativement peu d'analyses de télédétection satellitaire dans la région de l'Arctique parce que les recherches d'AOD dans cette région sont en général problématiques (voir article 2). O'Neill et al. (2012) ont utilisé des mesures au sol telles que la sunphotométrie, l’Arctic High Spectral Resolution Lidar (AHSRL) et le CANDAC Rayleigh-Mie-Raman Lidar (CRL), et des images
4
satellitaires telles que CALIOP, MODIS et OMI pour étudier les effets de l'éruption volcanique de Sarychev en 2009 sur l'Arctique. Tomasi et al. (2015) ont utilisé MODIS, MISR et AATSR pour retrouver l'épaisseur optique des aérosols (AOT) sur de grandes parties des régions polaires océaniques durant le printemps et l’été. Di Pierro et al., (2013) ont utilisé CALIOP pour examiner la variabilité verticale, horizontale et temporelle des aérosols troposphériques dans les régions arctiques au cours de la période entre 2006-2012.
Concernant la question spécifique des aérosols naturels, presque tous les articles mentionnés sur la télédétection au sol se concentrent sur l'influence printanière des poussières asiatiques (soit sous la forme d'une diminution significative de l'exposant d'Angstrom, soit d'une augmentation significative de l'AOD en mode grossier). AboEl_Fetouh et al. (2020) ont montré que ces effets optiques pourraient être associés à un petit pic de mode grossier (du PSD) d’un rayon d'environ 1,3 µm. Stone et al. (2014) ont fait état de l'influence probable de l'AOD en mode grossier des aérosols de sel marin à Barrow, en Alaska. Dans le premier article, nous avons utilisé la sunphotométrie au sol, les récupérations au sol FTIR (Fourier Transform IR), les profils lidar, la télédétection satellitaire et la modélisation des aérosols (NAAPS) pour analyser un événement de fumée extrême sur Eureka, provoqué par des incendies de pyrocb (convection extrême) près de Prince George, Colombie-Britannique. Dans le deuxième article, nous avons présenté la détection sans précédent d'un panache de poussière local (basé uniquement sur des recherches par satellite) induit par le flux de drainage le long des bassins fluviaux glaciaires. Ce flux est produit par la dynamique de l'air froid des glaciers de haute altitude entourant le lac Hazen (situé dans le nord d'Ellesmere Île de l'Extrême-Arctique).
L'identification et l'étude des aérosols naturels au-dessus d'Eureka (et d'autres sites d'opportunité) tels que les aérosols de fumée, les aérosols volcaniques, la poussière, le sel de mer et les PSCs de niveau Ib formaient l’objectif initial de cette recherche. Le but ultime était de caractériser les propriétés optiques et microphysiques des échantillonnages représentatifs d'aérosols naturels à partir des événements spécifiques au cours des dernières années.
L'hypothèse générale d'origine était que les données de télédétection au sol, appuyées par des informations auxiliaires telles que les données de télédétection par satellite, les données sur les aérosols de surface et les simulations de modèles, pouvaient être utilisées pour caractériser
5
adéquatement et comprendre correctement les propriétés des différents aérosols naturels dans l’Arctique. Par "caractériser adéquatement", nous entendons que l'analyse par télédétection démontrerait un niveau acceptable de précision et de robustesse (sans limitation par les incertitudes des données) et qu'elle présenterait une redondance et une corrélation physiquement défendables avec d'autres sources indépendantes d’information.
Alors que nous avons considéré de nombreux événements d'aérosols naturels au-dessus de l'Arctique, nous nous sommes finalement concentré sur deux événements extraordinaires qui étaient d'un intérêt plus général.
L’article 1 est un article original, et selon nous innovant, publié dans Atmospheric Environment. Il traite d'un événement de fumée extrême observé sur Eureka en août 2017. Son originalité provient de l’importance de l’événement étudié (la plus grande épaisseur optique jamais mesurée sur Eureka) et de l’infrastructure instrumentale et de l'expertise que nous avons développée depuis de nombreuses années sur la zone d’étude Eureka. L'article était également original en termes de la production d'une climatologie de 𝜏𝑓 (épaisseur optique en mode fin) associée à la fumée sur 10 ans (basée sur les données AEROCAN / AERONET collectées sur nos deux sites à Eureka) qui excluait des événements tels que les Kasatochi de 2008 et 2009 et l’intrusion stratosphérique de sulfates en mode fin de Sarychev. Une contrainte supplémentaire et originale sur l'étiquetage des événements 𝜏𝑓 en tant qu'événements de fumée était la corrélation entre 𝜏𝑓 et l'abondance de CO mesurée (une forte corrélation étant une indication de fumée étant donné que le CO est un produit classique des feux de biomasse). Le niveau de corrélation observée est, à notre connaissance, sans précédent. Particulièrement en présence de fortes variations de la profondeur optique des nuages, il témoigne ainsi de la fiabilité de la méthode de récupération (la récupération SDA d'AERONET). Pour démontrer la nature extrême de l'événement, nous avons utilisé une analyse ‘‘pic au-dessus du seuil’’ (POT) des pics 𝜏𝑓 individuels au cours de notre période d'échantillonnage de 10 ans. Ce processus impliquait une analyse minutieuse de tous les événements de fumée importants au cours de cette période et la conversion de cette analyse manuelle en une routine automatique d'extraction de tous les événements de fumée au-dessus d'un certain seuil 𝜏𝑓. Cette routine a ainsi généré une distribution des événements de fumée extrêmes à partir laquelle l'inférence statistique d'un extrême significatif a pu être tirée. Même si l’événement d'août 2017 ne s'est pas avéré être un événement
6
extrême en termes de moyenne mensuelle simple, cette observation confirme l'idée que des statistiques sur les événements extrêmes sont nécessaires pour démontrer leur caractère unique. Nous avons également utilisé des profils historiques (2005-2010) AHSRL pour estimer une hauteur de panache de fumée optiquement moyenne de ~ 3 à 3 ½ km au printemps et en été. L’article 2 est sans doute la contribution la plus importante et la plus originale. Elle implique l'application, avec succès, de techniques de télédétection passive et active par satellite pour détecter un panache de poussière à basse altitude au-dessus du lac Hazen dans l'Extrême-Arctique. Nous n'avons pas connaissance d'études de télédétection publiées sur la poussière locale de l'Arctique: la télédétection d’un panache de poussière au-dessus d’une surface complexe de neige, de glace et de poussière déposée sur cette surface est au mieux difficile. Nous avons exploité les capacités d'imagerie multi-angles (MISR) et multispectrales (visible aux infrarouges thermiques) (MODIS) ainsi que les capacités de profilage de capteurs actifs (le lidar CALIOP et le radar CloudSat) pour identifier, localiser et caractériser les principales propriétés physiques et optiques du panache de poussière. Ce processus a été accompli malgré le fait que les produits de télédétection de ces capteurs n'étaient pas adaptés aux conditions de l'Arctique (aucun de ces produits n'indiquait la nature des poussières du panache). Finalement, nous avons réussi à caractériser l'épaisseur du panache supérieur (la région du signal au bruit le plus élevé) en termes d’épaisseur optique de 532 nm (~ 0,7) et le rayon effectif des particules du panache (entre 18 et 25 µm de rayon; ce que les spécialistes du domaine qualifie de particules de poussière ‘‘géantes’’). Ces événements de poussières locales, considérés comme des phénomènes réguliers de fin d’été et de début d’automne au-dessus de l'Arctique, ont été reconnus comme d'importants contributeurs à la dynamique des aérosols à l'échelle de l'Arctique et aux effets de forçage radiatifs associés. Pour ce dernier cas, nous avons produit des images dérivées de MODIS sur le lac Hazen et l'île d'Ellesmere qui ont mis en évidence les effets d’assombrissement (réduction de l'albédo) probablement dus à ces évènements. L'impact de l'absorption sur la fonte de neige et de glace aux hautes latitudes a été reconnu comme un effet de rétroaction positive potentiellement important (Bullard et al.2016).
7
1. Introduction
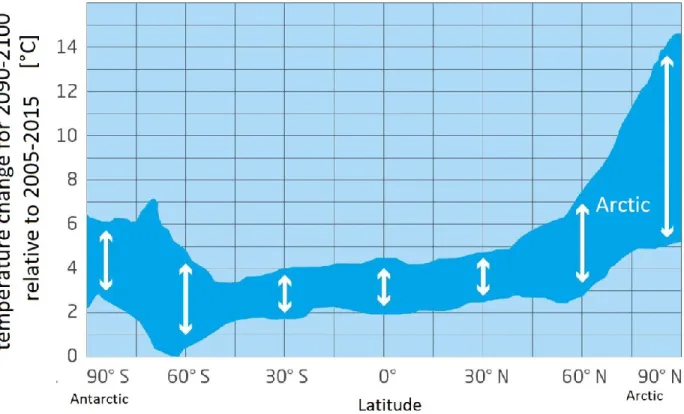
Global warming is one of the most serious challenges that the world is facing today. The Arctic is particularly vulnerable to its effects and various sustainability indicators have been found to be declining rapidly in the last few decades. In recent years, the average Arctic temperature increase was reported to be double that found at more southerly latitudes (IPCC, 2013). Figure 1 shows both the “Arctic amplification” of average temperature increase as well as an increase in the uncertainty of that increase with increasing latitude (ibid). In fact, because different processes in the Arctic climate system are not sufficiently understood, they are poorly represented in climate models. Our understanding of Arctic climate processes is limited by a scarcity of observations in the Arctic region, especially during the polar winter (when 24-hour darkness or dusk conditions are predominant for a period that is a function of time and Arctic latitude).
Figure 1 Projected warming by the end of the century as a function of the latitude. The envelope of uncertainty represents the range or projections for a variety of different models (Graphic: The mission of MOSAiC, https://mosaic-expedition.org/science/mission/).
8
Maybe the most spectacular results are the sea ice loss and Arctic methane release (Serreze et al., 2007). These changes can significantly affect the whole planet through their impacts on global climate. Therefore, the monitoring and study of environmental factors in the Arctic are likely to provide indicators for early detection of future climate changes (IPCC, 2013).
Aerosols (defined immediately below) are the overwhelming source of Arctic pollution. The dominant global air currents make the Arctic area the fallout region for long-range transport of air pollutants from low latitudes (Stohl, 2006). As a consequence, the pollutant concentration in some Arctic regions exceeds the levels found in densely polluted urban areas (IPCC, 2013). Anthropogenic emissions from northern Eurasia (the predominant source of the Arctic haze discussed below) have been identified by model simulations, surface, airborne and remote sensing measurements as the principal source for the seasonal aerosol variations observed in the Arctic background (Warneke et al., 2010). Shindell et Faluvegi, (2009) found that 1.1˚C of the 1.5˚C Arctic increase that occurred over the past three decades relates to the regional aerosol composition. They also found that improvements in air quality in Europe and the United States caused a decrease in sulfate and black carbon (BC) aerosol, while anthropogenic emissions in Asia increased BC in the Arctic.
A common source for the definition of aerosols, their properties and their atmospheric interaction, (and the general source for the affirmations made in this paragraph) is Hinds (1999). The author defines an aerosol as “A suspension of solid or liquid particles in a gas”. He further notes that these particles vary in radial size from a small fraction of a micron to tens of microns. Depending on emission and transport factors, their atmospheric lifetime may vary from a ~few seconds to ~ year. Aerosols interact with sunlight via the optical mechanisms of scattering and absorbing. They redirect light energy (scattering) and attenuate light (absorption and out-scattering for a given beam of light). This general concept leads to formulations of microphysical parameters (size and shape1), chemical parameters and optical parameters (scattering, absorption and attenuation/extinction) that characterize any aerosol or any grouping of aerosols in the atmosphere. Basic texts on aerosol optical parameters are numerous in the literature. One classic text on spherical, single-particle
1 Particle shape is a 2nd microphysical parameter, but in lieu of particle shape information, spherical particles are the
9
aerosol optical parameters of scattering, absorption and attenuation (cross sections) is Deirmendjian (1969). This author defines the two critical microphysical and optical parameters (respectively particle size and complex refractive index2) determining spherical aerosol optical parameters. A good text that combines per-particle aerosol optical parameters, volumetric aerosol optical parameters (per unit volume optical parameters labelled as coefficients), columnar optical parameters and general atmospheric radiative transfer concepts is Hansen & Travis (1974). The transformation from per-particle optical parameters to volumetric optical parameters is achieved by integrating the former over the particle size distribution (PSD) of aerosols at some point in the atmosphere (where the PSD is effectively a histogram of particle size). These volumetric parameters are then integrated over altitude to yield columnar parameters (the basic entity employed in passive ground- and satellite-based remote sensing)
A working hypotheses that motivates much of our investigations is that the impact of aerosols in the solar reflective part of the spectrum (roughly 0.4 to 4 m) is essentially bimodal: one can divide aerosols into fine (sub-micron or accumulation) and coarse (super-micron) PSDs that largely describe their optical influence (see, for example, O’Neill et al., 2001 and references cited therein). This bi-modality feature is generally a consequence of the primary or secondary formation mechanisms of different species of aerosols (respectively, aerosols formed by atmospheric chemical reactions versus aerosols that are introduced directly into the atmosphere; see Hinds, (1999), for example). The division into fine and coarse mode aerosols is thus strongly linked with formation mechanism (for example, secondary aerosols are generally fine mode while primary aerosols can be both coarse or fine mode in nature).
Aerosol particles can be characterized by their extensive and intensive properties. Extensive properties refer to aerosol amount (the fundamental microphysical example being PSD number density3) while intensive properties relate to per-particle parameters (or averages of per-particle parameters across the PSD). While the dominant optical effects of aerosols are associated with extensive properties of aerosols, their intensive properties can also be important.
2 A function of particle chemistry
10
The single most important aerosol optical parameter from a standpoint of general atmospheric radiative effects and from a standpoint of ground- and satellite-based remote sensing is (extensive) aerosol extinction optical depth or (AOD). It largely describes the out-scattering effect of aerosols in the solar reflective part of the spectrum since the absorption component of the AOD in that regime is typically small. The AOD and parameters derived from the spectral shape of the AOD can be divided into fine and course mode, extensive and intensive components. Extensive parameters include (c.f. O’Neill et al., 2003) total, fine and coarse mode AOD while intensive parameters include total (generic) Angstrom exponent (a classical, first order linear regression over multiple wavelengths), fine and coarse mode (true spectral) derivatives at a specific wavelength, fine and coarse mode effective radius, and fine mode fraction (FMF; the ratio of fine mode AOD to total AOD).
The sun provides the energy that drives earth’s climate: but not all of this energy finds its way to the surface. The mechanisms and effects of climate change are the most studied phenomena of our time. Aerosols induce significant backscatter and absorption effects that directly impact the radiative forcing effects on the surface–atmosphere system (what is commonly known as the direct effect; see for example, IPCC,2013). These effects are species dependant: for instance, sulfates and nitrates reflect a significant fraction of radiation and generally result in cooling of the atmosphere. In contrast, black carbon is a strong absorber and generally result in atmosphere warming. The second major climate forcing effect of aerosols (the indirect effect) is due to their role as nucleation and ice forming nuclei in the formation of cloud particles (water droplets or ice crystals): variations in the extensive and intensive properties of aerosols can have important influences on the microphysical properties of clouds, their radiative forcing properties, their lifetime, etc. (ibid). Aerosols are one of the greatest uncertainty sources in climate modelling (i.e. a significant contribution to the uncertainty seen in Figure 1) inasmuch as their microphysical, chemical and optical characteristics and thus their direct and indirect effects are not well characterized (ibid).
Arctic aerosols can be categorized into anthropogenic and natural aerosols (Shaw, 1995). Anthropogenic aerosols over the Arctic are largely associated with the phenomenon of Arctic haze, an effect which peaks in the late winter / early spring and which is the result of the ‘‘Arctic bowl’’ wherein contributions from pollutions sources are extended further south during the Polar winter
11
(see Law & Stohl, 2007 for example). These types of aerosols have higher concentrations of sulphates, organic matter (OM) and black carbon (BC) with respect to natural aerosols (Quinn et
al., 2008).
Natural Arctic aerosols, the general overall motivation for this thesis, include:
• Black carbon (BC) and brown carbon (BrC) aerosols. The most apparent source of such aerosols in the Arctic is smoke from biomass burning in the southern regions (see for example Tomasi et al., 2007 and Myhre et al., 2007)
• Dust (typically super micron), generated by wind erosion in Chinese and mid-eastern deserts and/or the Saharan desert (Zwaaftink et al., 2016) but also from local, summertime erosion in the Arctic (Bullard et al., 2016)
• Sea-salt generated by high winds over oceanic waters (Jaeglé et al., 2011).
• Volcanic, sub-micron sulphates (see, for example, Hoffman et al., 2010) from the condensation of volcanic-emitted SO2 gas and resulting from explosive eruption mechanisms.
• Level Ib polar stratospheric clouds (PSCs) (see, for example, Pitts et al., 2011). These aerosols are generally formed from sub-micron volcanic sulphates that have made their way into the stratosphere.
Ground-based remote sensing, supported by satellite-based remote sensing is a critical means of monitoring aerosols: it provides a "macro-averaged" characterization of aerosol properties that makes up for, in terms of its more robust (columnar) perspective, what it lacks in detail (as compared to surface sampling approaches, for example). It represents the first order ensemble average that models must agree with before they can hope to be validated using more detailed aerosol characterizations. Passive and active ground-based remote sensing can provide a complementarity as well as redundancy of information that enables the extraction of nearly all essential and robust aerosol parameters that influence the local radiative transfer budget
AboEl-Fetouh et al. (2020) present the most recent overview of ground-based, photometric remote sensing analyses across the Arctic. This overview includes a discussion of the ground-breaking multi-year AOD and Angstrom exponent seasonal climatology of Tomasi et al. (2015) across the
12
American, Canadian, European and Russian Arctic, Stone et al.’s (2014) 10-year AOD and Angstrom exponent climatology over Barrow, Alert (Ellesmere Island) and Ny Alesund (Svalbard), von Hardenberg et al.’s (2012) 6-year climatology that employed AERONET AODs, satellite retrievals and modelling over the Arctic, Breider et al.’s (2014) comparison of AERONET AODs and model-speciated extinction and absorption AODs, Xie et al,’s (2018) multi-year investigation over 8 Arctic sites of FMF and its relation to AOD, and Hesaraki et al.’s (2017) 4-year climatology of fine and coarse mode AODs over 5 stations in the North American Arctic. AboEl-Fetouh et al. (2020) present their own 8- to 17-year climatology of 6 AERONET stations across the North American and European Arctic4 that included the seasonal variation of intensive and extensive parameters (PSD, fine and coarse mode AOD, fine and coarse mode effective radius and FMF).
With respect to the specific question of natural aerosols, nearly all of the papers on ground-based remote sensing discussed above reported on the springtime influence of Asian dust (either as a significant decrease in Angstrom exponent or significant increase in coarse mode AOD). AboEl_Fetouh et al. (2020) showed that the influence could be attributed to a small coarse mode peak at a radius of around 1.3 m. Stone et al. (2014) reported on the likely coarse mode AOD influence (inferred from systematically small values of Angstrom exponent) of sea-salt aerosols at Barrow, Alaska. O’Neill et al., (2012) used sunphotometry, lidar measurements, satellite retrievals and HYSPLIT backtrajectory modelling to investigate stratospheric sulphate intrusions over Eureka due to the 2009 Sarychev volcanic eruption. In Paper 1 we employed ground-based sunphotometry, ground-based FTIR (Fourier Transform IR) retrievals, lidar profiles, satellite remote sensing and aerosol modelling (NAAPS) to analyze an extreme smoke event over Eureka driven by pyrocb (extreme convection) fires near Prince George, BC. In Paper 2 we reported on the unprecedented detection of a local dust plume (based solely on satellite retrievals) induced by drainage-flow along glacial-river basins produced by the cold-air dynamics of high elevation glaciers surrounding Lake Hazen (located in northern Ellesmere Island in the high-Arctic). There are relatively few satellite-based, passive remote sensing analyses of Arctic aerosols over land because AOD retrievals in that region are problematic in general (as briefly described in Paper
13
2). On the other hand, the ultra-violet technique for retrieving the “aerosol index” (AI) can be readily employed over the Arctic because it is more sensitive to high altitude aerosols: Fromm et al. (2010) showed AI returns over high-Arctic landforms due to intense “pyroCB” fires in Alaska. Satellite-based, passive retrievals of AOD over Arctic water are relatively common but subject to the constraints of the short ice-free season. Satellite-based, active (Lidar) remote sensing retrievals over the Arctic are frequently reported in the literature: they are largely based on CALIOP (Cloud-Aerosol Lidar with Orthogonal Polarization) and, more recently, ALADIN (Atmospheric Laser Doppler Instrument) retrievals. Rose et al. (2003) employed MODIS (Moderate Resolution Imaging Spectroradiometer) IR imagery and TOMS AI imagery to study a Polar winter plume emanating from an Icelandic volcanic eruption. O'Neill et al. (2012) used satellite-based imagery (MODIS and OMI) and CALIOP profiles as well as ground-based measurements such as sunphotometer AODs, AHSRL (Arctic High Spectral Resolution Lidar) and CRL (CANDAC Rayleigh-Mie-Raman Lidar) profiles to investigate the effects of the 2009 Sarychev volcanic eruption over the Arctic. Tomasi et al. (2015) analyzed satellite-based MODIS, MISR (Multi-angle Imaging Spectroradiometer), and AATSR (Advanced Along Track Scanning Radiometer) AOD retrievals over large parts of the oceanic Polar Regions during the spring and summer. Di Pierro et al., (2013) used CALIOP to examine the vertical, horizontal and temporal variability of tropospheric aerosols in the Arctic regions during 2006–2012.
1.1.Project Objective
The original overarching objective of this research was to better understand the nature of natural aerosols in the Arctic. The identification and study of natural Arctic (Eureka) aerosols such as smoke, volcanic aerosols, dust, sea-salt and level Ib PSCs was a general objective of the proposed research project at the beginning. The ultimate goal was to characterize the optical and microphysical properties of a cross section of natural aerosols within the constraints of being able to capture specific events of opportunity over the last few years.
1.2.Hypothesis
The original general hyphothesis was that ground-based remote sensing data, supported by auxiliary information such as satellite-based remote sensing data, surface aerosol data, and model
14
simulations could be employed to adequately characterize and understand the properties of different natural aerosols in the high Arctic. By "adequately characterize" we mean’t that the remote sensing retrieval analysis would demonstrate an acceptable level of accuracy and robustness (would not be limited by the uncertainties of the data) and it would exhibit physically defendable redundancy and correlation with other independent sources of information. We believe that we largely attained these goals within the context of Paper 1 and Paper 2 (with the added twist that we had to adapt to no ground-based remote sensing data in the case of Paper 2: the primary source of data was the satellite remote sensing data).
1.3. Choice of articles
While we investigated numerous natural aerosol events over the Arctic (see the Future work section below) we eventually focussed our article selection on two extraordinary events that were of more general interest. These two articles, paper 1 on the identification and characterization of an extreme high-Arctic smoke event over our PEARL (Eureka) observatory on Ellesmere Island and paper 2 on the identification and characterization of a drainage-flow (glacier-induced) dust plume over Lake Hazen (300 northeast of Eureka) are summarized below in the Conclusions section.
15
2. Paper 1: Extreme smoke event over the high Arctic
Keyvan Ranjbara1, Norm T. O’Neilla, Erik Lutschb, Emily M. McCulloughc, Yasmin AboEl-Fetouha, Peng Xiand, Kim Strongb, Vitali E. Fioletove Glen Lesinsc, Ihab Abboude
a Centre d’Applications et de Recherches en Télédétection, Université de Sherbrooke , Sherbrooke, QC, Canada
b Department of Physics, University of Toronto, Toronto, ON, Canada
c Department of Physics and Atmospheric Science, Dalhousie University, Halifax, NS, Canada d Atmospheric Properties and Effects Section, Naval Research Laboratory, Monterey, CA e Environment and Climate Change Canada (ECCC), Toronto, ON, Canada
1 Corresponding author E-mail address: [email protected]
Keywords: Extreme smoke event, high Arctic, aerosol optical depth (AOD), fine mode AOD
16
Abstract
The intense western Canadian fires of August 2017 resulted in extreme, high-Arctic fine mode (FM) smoke AODs (aerosol optical depths) over a 2008 to 2017 (10-year) sampling period. The primary measurements employed to monitor smoke events were FM AODs derived from the measured AOD spectra of two AEROCAN / AERONET (CIMEL) sunphotometers at Eureka, Nunavut, Canada. The FM AOD attribution is argued to be a necessary condition for the presence of smoke. Various supporting information, including the correlation with smoke proxy (CO) retrievals, the high frequency (rapid diurnal variation) and the high amplitude nature of the FM AODs, ground-based backscatter lidar profiles, the redundancy of the double CIMEL retrievals, satellite remote sensing, aerosol modeling and backtrajectories indicated that the peak event was likely due to smoke from extreme pyroCb fires in British Columbia.
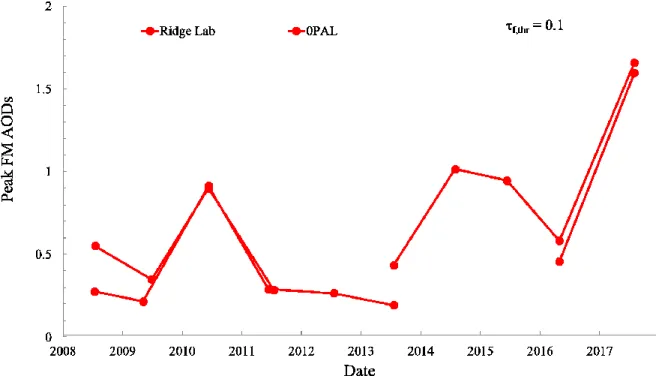
The hypothesis that the FM AOD peak event was an extreme event was tested for a derived ensemble of fine mode events and their peaks over the 10-year sampling period. The results confirmed the hypothesis at the 0.001 level of significance. Important indicators that the 10-year ensemble of FM AOD events did indeed represent smoke were their high frequency and high amplitude FM nature, their occurrence during the Boreal forest fire and agricultural fire seasons in Canada and Asia, and their strong correlation with CO abundances retrieved from FTIR measurements (when sufficient FM AOD and CO statistics were available).
In the process of accumulating climatological-scale, monthly-binned fine mode AOD statistics, we found moderate correlations with forest fire or agricultural fire emissions from the Boreal North American, Boreal Asia or Central Asia regions as well as with CO retrievals at Eureka. We argued that confounding factors constraining the monthly binned fine mode AOD vs emissions correlations were associated with the monthly-binned meteorological dynamics (with notable, event-level, exceptions) while confounding factors constraining fine mode AOD vs CO correlations included the different physio-optical nature of those smoke proxies (solar attenuation by fine mode particle scattering versus solar attenuation by molecular absorption). We also employed historic (2005-2010) AHSRL (Arctic High Spectral Resolution Lidar) profiles to estimate an optically averaged smoke plume height of ~ 3 to 3 ½ km during the spring and summer seasons.
17
1. Introduction
1.1. General considerations
The literature is replete with the observation and analysis of extreme events associated with GHG-driven increases in atmospheric thermal energy (see, for example, IPCC, 2013). A manifestation of extreme events, peculiar to the Boreal forest regions of the world, is the apparent increase in the frequency and strength of Boreal forest fires (see the following section for details). The occurrence of extreme smoke events over the high Arctic would be an important consequence of the extreme forest fire events. In recent years we have witnessed an apparent increase in the occurrence and severity of smoke events at Boreal forest latitudes and quite plausibly in the radiative impacts (both direct and indirect) of those events. Boreal forest smoke frequently finds its way to the high Arctic (see Saha et al., 2010, for example) and so one would expect a parallel increase in extreme smoke events. The precariousness of Arctic climate change makes such a consideration of primary concern as a source of radiative forcing uncertainty in climate models.
A robust indicator of smoke intrusions over a given site is the columnar measurement of fine mode (FM) aerosol optical depth (AOD) at a particular wavelength. This necessary (but not sufficient) evidence for a smoke event, variously supported by lidar backscatter and depolarization profiles, trace-gas measurements of gaseous smoke products (such as CO), satellite-based radiance and AOD imagery, satellite-based fire emissions imagery, back trajectories, and aerosol modelling yields high confidence in predictions of smoke presence (ibid). Over the high Arctic, a (relatively sudden) diurnal increase in FM AOD is, according to our experience, usually associated with smoke intrusions but can also be induced by high-frequency volcanic or pollution (sulphate-dominated) events of southern origin (illustrations are, respectively, the Kasatochi and Sarychev volcanic plume events described below and the early spring and autumn, Asian pollution-layer events reported by Di Pierro et al., 2011).
1.2. Climatological background for smoke reaching the North American high-Arctic
1.2.1. Forest fire emissions that impact the high Arctic
Biomass burning emissions that would significantly affect smoke measurements in the high Arctic are largely limited to the three vast regions defined by the authors of the GFED (Global Fire Emissions Database): these are the Boreal North America (BONA), Boreal Asia (BOAS) and
18
Central Asia (CEAS) regions (van der Werf et al., 2006). The dominant class, in terms of biomass burning emissions in the BONA and BOAS regions is the Boreal forest, while agricultural lands are the dominant class in the CEAS region (ibid).
Soja et al. (2007) observed that positive, burnt-area trends existed for Canada (1920 – 2006), Alaska (1950 – 2006) and Russia (1980 – 2006) “although the statistical relationships are not strong” (R2 values vs time were < 0.18 for all three regions from 1950 to 2005). More generally they make an argument for the greater frequency of severe events with, for example, an affirmation that “5 of the 8 largest fire years transpired in the last 17 yr (1989-2005)” in the case of the Canadian database. van der Werf (2017) presented annual (1997 to 2016) estimates of fire carbon emissions: one concludes (from their Figure 9 results) that there were marginally significant emissions increases for the Boreal forest in the BONA region (correlation coefficient of 0.4) and no discernable trend for the Boreal forest in the BOAS region. Agricultural fires in the CEAS region also showed no discernable trend. What is evident in their BONA and BOAS temporal plots is the intermittent nature of annual emissions with extreme years occurring around every 4-6 years. In contrast to these marginally significant increases in pan-continental emissions, one finds reports of longer fire seasons in Canada and the U.S. (Schoennagel et al., 2017) and claims of significantly greater large-fire frequency and areas burned in Canada (NRCAN, 2016).
1.2.2. Tropospheric flow climatology and its impact on smoke intrusions into the high Arctic
Climatology reveals that the lower tropospheric flow during July and August is favourable for the transport of aerosols from the the BONA region into the Canadian high Arctic: NCEP/NCAR reanalysis averaged from 2007 to 2017 shows a trough axis in the geopotential heights at 700 and 500 hPa extending south from a low near the North Pole into the central portions of the Asian continent (see S1 and S2 of the Supplementary material). This configuration (what we will call the “Asian trough”) allows the geostrophic wind to have a northward component downstream (east) of the trough: that component generally facilitates transport into the Canadian Arctic. The presence of an Alaskan trough may shift this region of transport to the Arctic further to the east.
19 1.2.3. Long term trends in smoke AOD
There are numerous sunphotometry articles on the observation of smoke events over the North American and European Arctic (see, for example, Stohl et al. (2006) on the multi-station AOD analysis of Arctic smoke induced by the 2004 Boreal forest fires, Warneke et al. (2010) on spring-2008 (ARCTAS) smoke events due to agricultural fires in southern Russia, O’Neill et al. (spring-2008) on the observation of weak smoke events over Eureka in 2007, Myhre et al. (2007), Markowicz et al. (2016) on smoke observations over the European Arctic (Svalbard) associated with, respectively, European agricultural fires and western North American Boreal forest fires). A sampling of Arctic-AOD climatologies, for which smoke was an important analysis component, includes the Alaskan studies of Eck et al. (2009) as well as the more Arctic-scale studies of von Hardenberg et al. (2012), Stone et al. (2014), Breider et al. (2014), Hesaraki et al. (2017), and a notable series of climatological-scale papers that culminated in the “historical overview” of Tomasi et al. (2015). While particular severe years in terms of smoke AOD were noted in these studies, none showed a long term tendency of increasing smoke AOD. In fact the most prevelant trend noted was a decrease in [fine mode] AOD that was ascribed to decreases in anthropogenic SO2 emissions from Russia and Europe (Tomasi et al., 2012).
1.2.4. Altitude of smoke events over the Arctic
A commonly accepted paradigm for understanding the dynamics of particle transport into the Arctic is that the Arctic or polar dome forces air parcels of southern origin to be transported to the mid to upper Arctic troposphere along isentropic pathways (see, for example, Stohl et al. (2006) and Law and Stohl (2007)). This principle, combined with the smoke source dynamics of pyro-convection events associated with fire activity (see, for example Damoah et al. (2006)) provide a strong argument for optically significant smoke (often in the form of distinguishable smoke plumes) being largely transported to the mid or upper troposphere. Empirical, event-level evidence for this resides in various studies involving co-located lidar and photometric measurements (see for example, O’Neill et al. (2008) and Saha et al. (2010)) and/or modelling simulations supported by auxilliary data (Stohl et al., 2006).
These qualitative arguments aside, we are not aware of any study in the literature which attempted to characterize average smoke plume height in the high Arctic across climatological-scale time periods. Thus, in order to support our abovementioned climatologies concerning the average
20
tropospheric flow of smoke into the Arctic, we performed our own assessment of average smoke plume height. A multi-year (2005-2010) analysis of the AHSRL lidar data at Eureka indicated an optically averaged smoke plume height ~ 3 ½ km during the summer Boreal forest fire season, ~ 3 km during the spring and 1-2 km during the fall (c.f. O’Neill et al.,2008. for a discussion of the AHSRL in the context of AOD measurements and S3 of the Supplementary material for a graphical illustration of the smoke plume classification approach and a brief discussion of the classification process, as well as the height computation technique). Similar computations were carried out using the results of Tomasi et al. (2015) who analyzed a year’s worth of lidar data over the European high Arctic site of Ny Alesund, Svalbard (1 November 2012 to 31 October 2013): using their backscatter optical depth computations, we derived optically averaged aerosol plume heights of ~ 3 km for all months between April and September (see S4 for the final year to year results for both Eureka and Ny Alesund). Both sets of results are not inconsistent with the 1985-1990, 1996-2004, SAGE II, 1.02 m extinction coefficient profile climatology of Treffeisen et al. (2006) which suggests optically weighted altitude means ~ 3 km between March and September across a latitude band of 60 – 80N (the conditional nature of our affirmation derives from the fact that the SAGE II extinction coefficient profiles were limited to a lower altitude minimum of ~ 2 km) The spring and summer, optically-averaged altitude of ~ 3 km for Eureka and Ny Alesund correspond to a pressure altitude ~ 700 mb (i.e close to the 700 mb standard employed above to characterize average tropospheric flow climatologies).
1.3. Objectives of this paper
In this communication we seek to investigate, using ground-based AOD measurements and supporting data, a very strong smoke event that occurred over the Eureka observatory in August of 2017. This investigation will necessarily look at the high-frequency level (individual AOD retrievals) to characterize the nature of the August 2017 event as well as across a multi-year sampling period (MYSP) from 2008 to 2017 in an attempt to characterize the climatological-scale, event-level statistics of all smoke events. We also investigate monthly-binned statistics across the MYSP in order to achieve a low frequency climatology that contextualizes the higher-frequency results.
21
2. Site, instrumentation and retrieval techniques
Our study focusses on measurements acquired at the high-Arctic, Polar Environment Atmospheric Research Laboratory (PEARL) in Eureka, Nunavut, Canada. PEARL includes two labs separated by a distance of 15 km : the 0PAL (0-altitude PEARL Auxiliary Laboratory) at near sea-level elevation (10 m) and the Ridge Lab5 at 610 m elevation (coordinates 79° 59' 24" N, 85° 56' 20" W, and 80° 03' 14" N, 86° 25' 01" W respectively). The Ridge Lab hosts an AEROCAN / AERONET CIMEL sunphotometer / sky radiometer along with a Bruker IFS 125HR Fourier Transform Infrared (FTIR) spectrometer (see O’Neill et al. (2008) and Viatte et al. (2014) respectively for details on these instruments). The 0PAL lab hosts a 2nd CIMEL instrument co-located with the CANDAC6 Rayleigh-Mie-Raman Lidar (CRL). 0PAL also hosted the abovementioned AHSRL.
AERONET provides two types of data products and retrievals : (i) spectral extinction and sky (almucantar) radiance measurement from which microphysical and optical parameters at a relatively low frequency (once per hour in clear-sky conditions) are retrieved using the Dubovik inversion (Dubovik and King, 2000) and (ii) only spectral extinction measurements from which a more limited set of microphysical and optical parameters are retrieved at a significantly higher frequency (once every 3 minutes in clear-sky conditions) using the SDA algorithm of O’Neill et al. (2003). Both retrieval types provide fine-mode (FM), coarse-mode (CM) and total AOD as a standard output product (the SDA products are labelled 𝜏𝑓, 𝜏𝑐 and 𝜏𝑎 respectively and are taken at a reference wavelength of 500 nm). The 𝜏𝑓 and 𝜏𝑐 division is often a means of segregating different species of aerosols (Hesaraki et al., 2017) and of effectively performing spectral cloud screening by separating fine mode aerosols from coarse mode cloud (see Baibakov et al. (2015) and O’Neill et al. (2016), for example). For the purposes of this paper, we chose to employ the high-frequency SDA retrievals in order to better understand the detailed dynamics of the August
5 We should note that there is a degree of confusion about the label “PEARL” : it is mean’t to represent the
complex of (three) atmospheric labs at Eureka (0PAL, the Ridge Lab and the flux tower at “SAFIRE”) but AERONET uses the label “PEARL” to represent the Ridge Lab CIMEL. In this paper we will refer to the Ridge Lab CIMEL and will employ PEARL in its established multi-lab usage
22
2017 event (supported by the high-frequency CRL profiles) and because the relatively low-frequency retrievals of the Dubovik inversion tend to dampen out high-low-frequency / high amplitude smoke-AOD excursions due to the per-hour sampling limitations. We also chose to employ the Level 1.0, version 3 SDA retrievals to minimize the filtering out of legitimate smoke AODs (Eck et al. (2018) present some examples of this type of omission error).
2.1. 𝝉𝒇 measurements at 0PAL and the Ridge Lab
Variations in 𝜏𝑓 are a well-known signature of smoke aerosols (see, for example, Eck et al., 2009). In general, we have found both FM and CM events to be consistently coherent with synchronous, high-frequency lidar profiles of backscatter coefficient and depolarization ratio (see, for example, O’Neill et al. (2008) for sunphotometry and Baibakov et al. (2015) for starphotometry). The relatively short distance between 0PAL and the Ridge Lab means that 𝜏𝑓 retrievals at the two facilities provide a high degree of optical redundancy which we often exploit to verify the opto-physical fidelity and robustness of measured AOD spectra and the resulting SDA retrievals (see, for example, Hesaraki et al. (2017) for illustrations of this notion of robustness).
2.2. CO measurements at the Ridge Lab and their link to 𝝉𝒇 variation
The FTIR spectrometer at Eureka provides total column measurements of gaseous products known to be tracers of biomass burning (Viatte et al., 2013, 2014, 2015; Lutsch et al., 2016). In the context of 𝜏𝑓 retrievals, a columnar smoke product such as CO (units of mol.-cm-2 1018) provides supporting information that can help confirm the presence of smoke aerosols in the high Arctic (Viatte et al., 2014, 2015). However, its fundamental optical mechanism is absorption while the fundamental optical mechanism of 𝜏𝑓 is scattering by (largely) sulphate and / or organic carbon (OC)7 FM aerosols : the 𝜏
𝑓 and CO retrieval products are themselves influenced by a complex mixture of natural and anthropogenic emission sources and the physical / chemical interactions undergone between the source and the high Arctic. While they both generally correlate with a high-frequency intrusion of smoke they are subject to secondary removal mechanisms (beyond the
7 See, for example, Figure 9 of Breider et al. (2014) for simulations showing seasonal dynamics of total and
absorbing AOD across a number of Arctic stations (where the small amplitude of the latter indicates a dominance of scattering AOD).
23
primary forces of advection) : CO, for example, is removed via OH chemistry driven by the springtime onset of solar radiation. In the end, the covariation (and notably the high frequency covariation) of CO and 𝜏𝑓 represents added support for the identification of a significant smoke event but, by itself, is not a sufficient condition for its identification.
3. The August 2017 event and its multi-year context
3.1.Characterization of the event
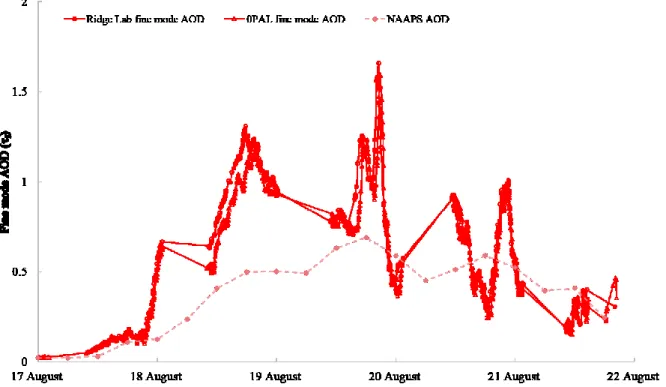
Figure 1 shows the very strong 𝜏𝑓 amplitudes at the Ridge Lab and 0PAL sites during the August 2017 smoke event. The 𝜏𝑓 peak value on 19 August 2017 is nearly two orders of magnitude larger than the “clear-day” value of ~ 0.02 reported in O’Neill et al. (2008). Figure 1 also shows (light pink diamonds) the smoke AOD simulated by the NAAPS8 model (Lynch, et al., 2016) at a temporal resolution of 6 hours (more details on this diagnostic run are reported on the S11 slide of the supplementary material).
Figure 1 : f variation at Ridge Lab and 0PAL during the 5-day duration of the August, 2017 event. The tic
marks above the date labels correspond to 00:00 UTC. The pinkish dashed line represents simulations of
24
the smoke AOD from the NAAPS diagnostic run (6 hour temporal resolution and 1 x 1 spatial resolution ; see the S11 caption for more details on this run)
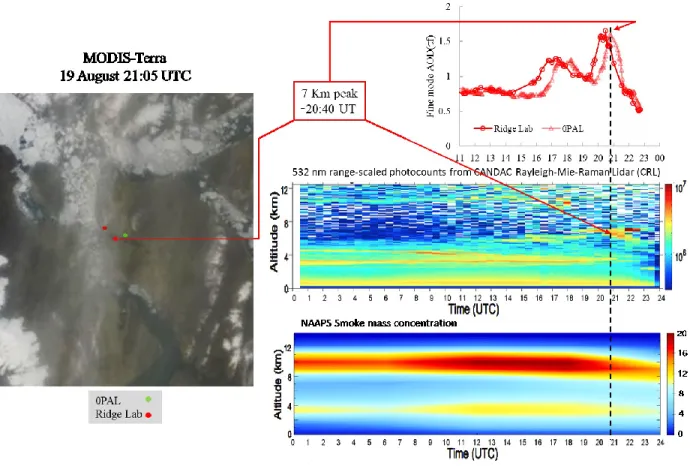
Figure 2 shows a composite of key data employed in the identification and characterization of the 19 August peak (𝜏𝑓 retrievals at 0PAL and the Ridge lab, the CRL backscatter profile, the NAAPS smoke mass concentration profile from the NAAPS diagnostic run and the MODIS-Terra image acquired near the time of the 𝜏𝑓 peak). The supplementary material (S7 to S12) provides supporting graphics and discussion details related to Figure 2 (including a brief discussion of the west to east lag in the 𝜏𝑓 plots of S7 and S8, between the Ridge Lab and 0PAL CIMELs). These details, which also include MISR imagery as well as stereoscopic plume height retrievals and HYSPLIT9 backtrajectories indicate that the 19 August smoke peak (corresponding to a plume around 7 km altitude at the time of the 20:40 UTC 0PAL peak) likely originated from forest fire emissions in western Canada. The HYSPLIT backtrajectories were however, less than conclusive given the type of divergence seen in the plume origins coupled with the complexity of the backtrajectories prior to their leaving the Canadian Arctic mainland (c.f. S10 and its caption).
Forest fire activity was particularly notable in south central British Columbia (BC) (as suggested by the hotspot clustering in S10) where biomass burning emissions near Prince George BC were judged to be so intense that the period from 13 to 15 August produced stratospheric smoke with unprecedentedly strong Aerosol Index (AI) values (Fromm et al., 2018; Peterson et al., 2018). We believe that the origin of the (Figure 2 and S8) 7 km plume was likely the extreme BC fires from mid to upper tropspheric injections of smoke as suggested by the S10 (blue) backtrajectory. At the same time, there was a concentration of fire sources southeast of Great Slave Lake (S10) which probably contributed to the strong (Figure 2 and S8) plumes seen around 4 km on 19 August (rather than the 7 km plume as suggested by the red colored backtrajectory of S10, if one were to assume high altitude emissions for the Great Slave Lake fires). In order to support these hypotheses, we simulated high altitude emissions at Prince George (the NAAPS diagnostic run) and obtained a decreasing altitude plume (~ 10 down to 8½ km) on 19 August (details in the caption of S11). A control run where all emissions were assumed to be near the surface produced the results of S12 : a plume with a mean height ~ 3 km. Putting aside the non negligible differences in detail of the
25
real and simulated higher altitude plumes (which we believe could be improved upon with better vertical profile knowledge of the high altitude Prince George emissions) we then make the argument that the pyroCb emissions of Prince George are the likely source of the extreme 19 August smoke event at Eureka.
Figure 2 : The 19 August 2017 extreme smoke event over Eureka. Clockwise; the MODIS-Terra image at about the time of the fine mode AOD peak over 0PAL, the temporal variation of the Ridge Lab and 0PAL fine mode AODs, the CRL range corrected photon counts and the NAAPS smoke concentration (g/m3)
profile. See the caption of S11 for more details
The month of August 2017 was, in effect, a meteorological departure from the climatological means discussed above. The Alaskan geopotential troughs at 500 and 700 hPa had a larger amplitude compared to the S2 climatology and, to a degree, dominated over the Asian trough (c.f. S15 and S16 of the Supplementary material for the averaged GFED emissions and the averaged meteorology during August 2017). In general this allowed aerosols released by fires in western Canada to be advected nearly directly to the Canadian high Arctic. We should remind the reader that, at the event level, such climatological affirmations are the norm and not the rule : for example,
26
there was apparent advection events from BOAS fires that passed over Eureka on 12 and 13 August (c.f. the NAAPSsmoke-AOD simulations of video1 of the Supplementary material) that were not captured by the Eureka CIMELS on 1210 August but appeared to be captured, as a moderate 𝜏
𝑓 variation, on 13 August.
3.2. FM AOD : multi-year comparisons with emissions
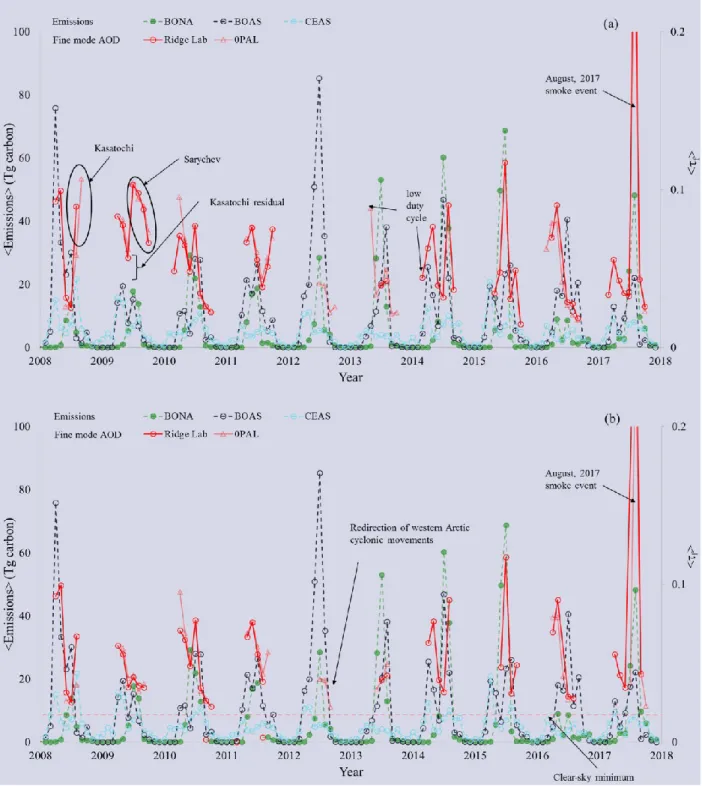
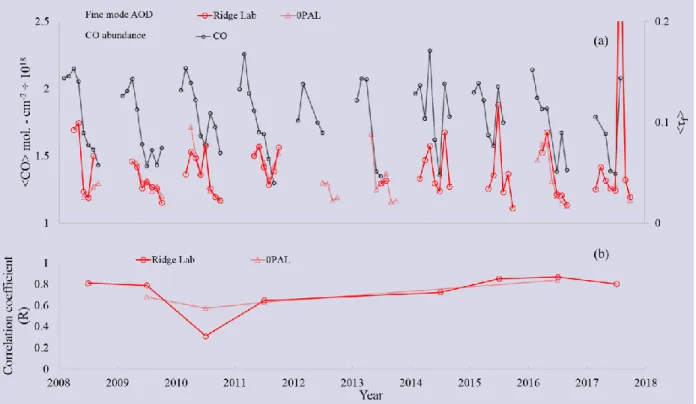
Figure 3a shows the variation of monthly averaged emissions from the BONA, BOAS and CEAS regions superimposed on <𝜏𝑓> (monthly mean) variation. Various features of interest are indicated directly on the graph. The August 2017 event can be seen to the right (the large <𝜏𝑓> peak being cut off to better appreciate the weak, more subtle <𝜏𝑓> variations during the other years). The fine mode stratospheric sulphates of the Kasatochi and Sarychev volcanos of 2008 and 2009 act as confounders of the correlation between emissions and <𝜏𝑓>. The “low duty cycle” label points to examples of <𝜏𝑓> values whose representativeness (relative to emissions that are not, for example, subject to being cutoff by the presence of clouds) is questionable for any given month (a low duty cycle being characterized as the occurrence of 𝜏𝑓 retrievals on 25% or less of the days in a given month).
Figure 3b shows the resulting variations with the removal of the volcanic sulphate contributions and the low duty cycle values. On this graph we have indicated the clear-day minimum from O’Neill et al. (2008) as a baseline at a 𝜏𝑓 value of about 0.02 (which we have renamed “clear-sky minimum”). The removal of the volcanic contributions, using estimates of volcanic <𝜏𝑓> from calculations similar to O’Neill et al. (2012), as well as a residual element of Kasatochi in 2009 as per Sioris et al. (2010), yielded significantly better correlations with the strong BOAS emissions in 2008. There was no significant correlation improvement with the weak emissions of 2009 while there was arguably an amplitude improvement in terms of what appears to be anomalously high <𝜏𝑓> values relative to the stronger emitting years of 2008 and 2010 (an “amplitude improvement” driven by the correction of the “Kasatochi residual” of Figure 3a). The removal of low duty cycle
10 There were simply no measurements acquired on that date: a condition that usually results from the automated disabling of the instruments during thick cloud or precipitation events.
27
points typically had little impact except for a significant improvement relative to BOAS and BONA emissions in 2011.
Figure 3 : (a) Right hand axis : <f> (monthly average) variation at the Ridge Lab and 0PAL. Left hand axis