Université de Farhat Abbas Sétif 1
-THESE
Présentée à la Faculté des Sciences Département d’Informatique Pour l’Obtention du Diplôme de
DOCTORAT EN SCIENCES
Option: Informatique
Thème
Topologies dynamiques pour la communication et
la gestion des réseaux ad hoc
Présentée par
AHLEM DRIF
Soutenu le: Devant le jury composé de:
Pr. KAMEL Nadjet Prof. à l’UFA-Setif-1 Présidente
Pr. BOUKERRAM Abdellah Prof.à l’Univ-Béjaïa Rapporteur
Dr. REFOUFI Allaoua MC-A. à l’UFA-Setif-1 Examinateur
Pr. TARI Abdelkamel Prof. à l’Univ-Béjaïa Examinateur
La problématique de l’exploitation d’un haut niveau d’abstraction des utilisateurs mobiles pour optimiser les applications sans fil est l’un des défis les plus prometteurs dans les do-maines des sciences sociales computationnelles et les réseaux de communication. Notre travail de thèse propose trois contributions principales: Dans la première contribution, nous proposons une stratégie d’auto-organisation des dispositifs mobiles basées sur des topologies distribuées et efficaces en investissant l’interêt commun des utilisateurs et leurs aspects sociaux. Notre deuxième contribution analyse la corrélation entre les comportements des utilisateurs, en effet, cette dimension sociale peut être vue comme étant la motivation principale des mouvements des individus durant leur vie de tous les jours, ainsi, nous divisons notre travail en trois phases: la phase de filtrage des données mobiles, la phase de création des communautés et la phase d’analyse de modèle obtenu. Dans notre troisième contribution, nous introduisons l’apprentissage de la dynamique des communuatés mobiles. Dans cette optique, nous pro-posons un nouvel algorithme de prédiction en exploitant l’aspect temporel lié à l’historiques de mobilité d’un utilisateur et à l’historique des personnes qui lui sont liées. Nos contributions à la recherche sont très intéressantes et tirent profit des comportements sociaux des individus. Elles apportent plus d’efficacité en terme de temps et de précision et ouvrent la voie à des avancées dans le domaine de recherche de la mobilité humaine et les réseaux sans fil avec une approche très interdisciplinaire.
Mots clès :
Optimisation de la topologie, applications sans fil, méthodes de détection des communautés, fouille de données de trajectoires, motifs fréquents, analyse des données géospatiales, extraction de l’information, méthodes de prédiction de liens, et réseaux complexes.
Abstract
The issue of exploiting the abstraction level of mobiles users to optimize realistic applications is one of the most compelling challenge in computational social science and communication net-works. The dissertation proposes three main contributions; in the first contribution, we propose a self organized policy to mobile devices based on efficient distributed topologies investigating the common interest of users and their social aspects. Our second contribution analyzes the correlation between user behaviours, indeed, we can see this social dimension as the main driver of individual movements in their daily life, thus, we divide our work in three phases: mobile data filtering phase, communities creation phase and an analysis phase of the created model. In our third contribution, we introduce the learning of the dynamics of the mobile communities. To this end, we propose a novel prediction algorithm by leveraging temporal aspect related to the past history of a user and the history of people related to him/her. Our research accom-plishments are very interesting and take advantage of the social behaviors of individuals. They provide more efficiency in terms of time and accuracy and pave the way to advances in wire-less networking and in the human mobility research field with a very interdisciplinary approach.
Keywords: Topology optimization, wireless applications, community detection methods,
trajectory mining, frequent pattern mining, analyzing geospatial big data, knowledge extraction, link prediction methods, and complex networks.
Mon coeur est empli de reconnaissance envers mon Créateur, Qui m’a donné la force, la volonté, et l’enthousiasme pour mener à bien mon travail de thèse.
J’adresse mes plus vifs remerciements à mon directeur de thèse: le Professeur Boukerram Abdellah, qui a accepté de diriger cette thèse et qui en a supervisé le déroulement. Sa confiance et ses encouragements étaient un support infaillible pour arriver aux objectifs fixés au départ de ce travail de thèse.
Je tiens à remercier également Mr. Kheddouci Hammamache, Professeur à l’université Claude Bernard de Lyon - France, qui m’a accueillie au sein de son laboratoire et m’a amenée vers cette thématiques très riche, et m’a permis d’explorer des domaines de recherche interdis-ciplinaires et prometteurs.
J’adresse mes sincères remerciements au Professeur L. Louail, le Doyen de la faculté des sciences, pour avoir soutenu et encouragé toute initiative pour réussir nos travaux de recherches. Mes remercienment vont également á Dr C. Khentout, le chef de département d’informatique, pour sa disponibilité.
J’adresse mes plus vifs remerciements à Madame N. Kamel, Professeure à l’université de Sétif, d’avoir accepté de présider le jury de soutenance. J’exprime aussi tous mes remer-ciements à l’ensemble des membres de mon jury: Madame S. Giordano, et Messieurs Dr A. Refoufi et Prof A. Tari. Veuillez recevoir l’expression de ma profonde gratitude.
Je tiens à remercier mon collègue Slimani Yacine, avec qui j’ai travaillé sur le problème de la détection de communautés, pour avoir crée un environnement d’études convivial et per-sévérant durant toute cette formation. Il m’a toujours répeté: le plus important est de continuer à travailler: absolument, il n’y a que le travail qui paie.
J’exprime ma reconnaissance à la Professeure Silvia Giordano qui m’a accueillie au sein de son équipe du laboratoire "LabNetworking" de l’université des sciences appliquées, en Suisse. La Professeure Silvia m’a apporté d’enrichissantes discussions, et a contribué efficacement à certains aspects de cette thèse, à savoir l’analyse de la mobilité humaine. Son souci du détail m’a incitée à approfondir ma réflexion, sa patience à répondre à mes questions et dissiper mes doutes m’a été précieuse.
Je remercie aussi Michela Papandrea et toute l’équipe de "LabNetworking". Leur convivi-alité m’a fourni un cadre de travail particuliérement agréable et enrichissant.
Je tiens à remercier particulièrement le professeur Yu Zheng pour m’avoir orienté vers ses travaux de recherches et d’avoir répondu à mes emails.
Je remercie aussi Mr. Abdelkrim Bouchelaghem pour ses encouragements.
Je remercie mes chères amies Nassima, Sofia, Samira, Amel et Khadidja pour leurs en-couragements. J’exprime ma gratitude á toi Sofia; tu m’as tenu compagnie avec bienveillance, tu m ’as épaulée pour réussir à aller jusqu’au bout. Merci beaucoup pour ton écoute et ton soutien infaillible.
A mes chèrs parents, mes frères, mes soeurs, mon cousin Abdelghafour et mes beaux frères, vous ne comprenez pas comment je supporte un tel rythme de travail acharné, mais vous êtes toujours soucieux de ma carrière et ouverts aux discussions parfois vives! Merci de croire en moi!.
J’éprouve une profonde reconnaissance à Ikram sur qui j’ai toujours pu compter, pendant les moments les plus difficiles. Merci d’être une soeur si merveilleuse. Tu es une source de courage infinie, chère soeur. Merci!
Une thèse est aussi une expérience humaine très riche en partages de valeurs communes, cela m’a procuré un profond contentement personnel.
A ceux qui agissent en bien est reservée la meilleure rècompense et même davantage . Saint Coran
Ce n’est pas en améliorant la bougie qu’ on a inventé l’ ampoule électrique. Le physicien Niels Bohr
Hard work beats talent when talent fails to work hard. Kevin Durant, basketball player
If learning the truth is the Sientist’s goal, then he must make himself the enemy of all that he reads. Ibn alHaytham
Radiate an energy of serenity and peace so that you have an uplifting effect on those you come into contact with. Dr.Wayne Dayer
Table of contents List of figures iv List of tables vi 1 Introduction 1 Introduction 1 1.1 Problem statement . . . 1
1.2 Main issues and Contributions . . . 2
1.3 Outline . . . 7
2 Analysis of Human Mobility for Mobile Wireless Networks 9 2.1 Introduction . . . 9
2.2 Analysis of Human mobility . . . 9
2.2.1 Definitions . . . 11
2.2.1.1 Flight . . . 11
2.2.1.2 Pause time . . . 11
2.2.1.3 Radius of gyration . . . 11
2.2.1.4 Gap . . . 12
2.2.1.5 Visit point or stay point . . . 12
2.2.1.6 Hot spot . . . 12
2.2.1.7 Jump size . . . 12
2.2.1.8 Truncated power-law distribution . . . 12
2.2.1.9 Fractal waypoints . . . 13
2.2.1.10 Inter-contact time . . . 13
2.2.1.11 Return time probability . . . 13
2.2.2 Spatial, Temporal and Social Dimensions . . . 13
2.2.3 Mobility Data Sources in Mobile Devices . . . 14
2.3 Human Mobility Features . . . 16
2.3.1 Mobility Features from a Location-Centric Perspective . . . 16
2.3.2 Mobility Features from a User-Centric Perspective . . . 17
2.4 Existing Human Mobility Models . . . 18
2.4.1 Random models . . . 19
2.4.2 Random variant models . . . 20
3 Topology Optimization in Wireless Networks 24
3.1 Introduction . . . 24
3.2 Topology optimization problem . . . 24
3.2.1 Features of communication graph . . . 25
3.2.2 Virtual topologies classification . . . 26
3.2.3 Covering node Sets . . . 27
3.2.3.1 Randomized virtual backbone construction . . . 27
3.2.3.2 Dominating and Independent sets . . . 28
3.2.3.3 Connected Dominating sets . . . 29
3.2.4 Link based structure . . . 29
3.2.4.1 Minimum Spanning Trees . . . 29
3.2.4.2 K-neighbors graph . . . 30
3.2.4.3 Relative Neighborhood Graphs (RNG) . . . 31
3.2.5 Mixed structures . . . 32
3.3 Topology Control Protocols . . . 32
3.4 A novel social perspective of topology optimization problem . . . 35
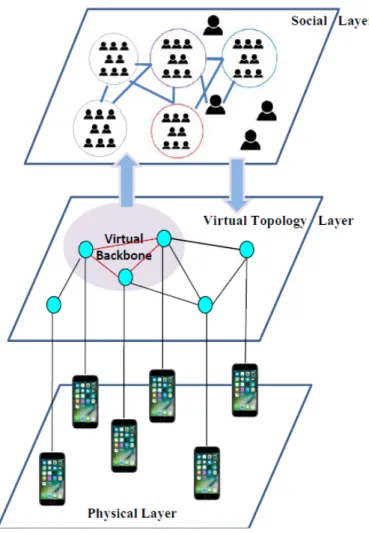
3.4.1 Virtual topology layer and routing . . . 36
3.4.2 Social layer and virtual topology layer . . . 37
3.4.3 Physical layer and virtual topology layer . . . 37
3.5 Conclusion . . . 39
4 Community Detection Methods in Complex Networks 40 4.1 Introduction . . . 40 4.2 Communities description . . . 42 4.2.1 Graph concepts . . . 42 4.2.2 Comparative definitions . . . 42 4.2.3 Self-referring definitions . . . 43 4.2.4 Quality Functions . . . 43
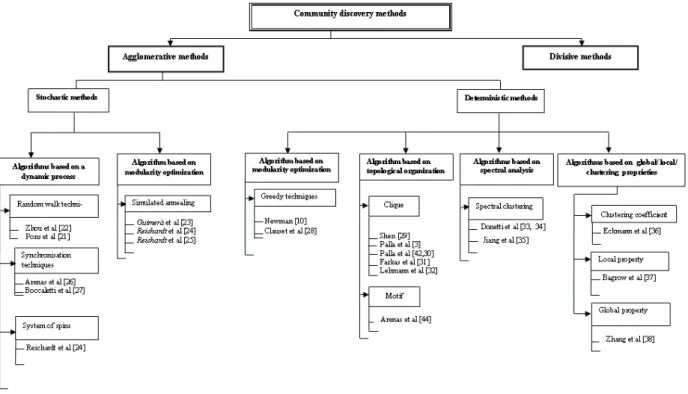
4.3 Taxonomy of community discovery methods . . . 45
4.4 Agglomerative methods . . . 47
4.4.1 Algorithms based on a dynamic process . . . 48
4.4.1.1 Random walk techniques . . . 48
4.4.1.2 Synchronization techniques . . . 49
4.4.1.3 System of spins . . . 49
4.4.2 Algorithms based on modularity optimization . . . 50
4.4.2.1 Simulated annealing . . . 50
4.4.2.2 Greedy techniques . . . 50
4.4.3 Algorithms based on topological organization . . . 51
4.4.3.1 Clique . . . 51
4.4.3.2 Motif . . . 52
4.4.4 Algorithms based on spectral analysis . . . 52
4.4.5 Algorithm based on clustering properties . . . 53
4.4.6 Algorithm based on local properties . . . 54
4.4.7 Algorithm based on global properties . . . 54
4.5.3 Algorithms based on spectral analysis . . . 56
4.5.4 Algorithm based on local properties . . . 57
4.5.5 Algorithm based on global properties . . . 58
4.5.6 Algorithm based on clustering coefficient properties . . . 59
4.6 Dynamic community discovery methods . . . 61
4.7 Conclusion . . . 63
5 An Ad Hoc Topology Scheme Founded on Community Structure Proprety 64 5.1 Introduction . . . 64
5.2 Constructing topology based on structural equivalence . . . 65
5.2.1 Preliminary and definitions . . . 65
5.2.2 Neighbors detection . . . 67
5.2.3 Clustering tree Algorithm . . . 67
5.3 On construction of virtual community backbone . . . 68
5.4 Results . . . 69
5.5 Routing application and topology features . . . 74
5.5.1 Key idea . . . 74
5.5.2 Relay region . . . 75
5.5.3 Energy consumption model . . . 76
5.5.4 Energy Aware Route Discovery Process . . . 76
5.5.5 Results . . . 78
5.6 Conclusion . . . 79
6 A Pattern Extraction Methodology for Mobility Paths 80 6.1 Introduction . . . 80
6.2 Proposed Methodology . . . 82
6.3 Stay point extraction . . . 82
6.4 Pattern discovery . . . 86
6.4.1 Defining point of interest . . . 86
6.4.2 Frequent patterns mining . . . 88
6.4.3 Community discovery method . . . 89
6.4.3.1 Fast algorithm . . . 90
6.4.3.2 Random walk algorithm . . . 91
6.4.3.3 Community detection Algorithm based on Relevant Coefficient 91 6.5 Experimental results . . . 92
6.5.1 GeoLife overview . . . 93
6.5.2 Interest Based Mobile Communities Extraction . . . 94
6.6 Conclusion . . . 100
7 A Novel Prediction Method for Analyzing Users Future Movement 101 7.1 Introduction . . . 101
7.2 Problem statement . . . 102
7.3 Data set preprocessing . . . 103
7.4 Location Prediction based on mobile communities . . . 104
7.4.1 User’s communities pattern extraction . . . 105
7.4.3 Prediction Model . . . 107
7.5 Experiments . . . 108
7.5.1 Communities and mobility . . . 108
7.5.2 Prediction results . . . 111
7.6 Conclusion . . . 115
Conclusion 116
2.1 Factors of influence on individual mobility behavior . . . 10
2.2 model used to extract flight information. . . 11
2.3 Sample GPS traces from the Disney World scenario . . . 15
2.4 Mobility Models . . . 20
3.1 Virtual topologies classification . . . 26
3.2 Application strategy for covering node sets. . . 27
3.3 Active connectivity and active domination of the virtual backbone . . . 28
3.4 Dominating set (surrounded)/Maximal Independent Set (black) . . . 28
3.5 A Connected Dominating Set (CDS) . . . 29
3.6 Minimum spanning tree and RA . . . 31
3.7 Relative Neighborhood Graph . . . 31
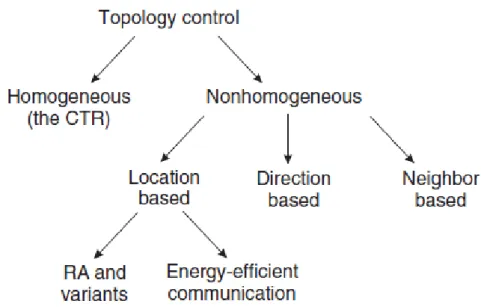
3.8 A taxonomy of topology control techniques . . . 33
3.9 Intuition behind the CBTC protocol. . . 34
3.10 Our view of Social Layer in the protocol stack. . . 36
3.11 The importance of appropriately setting the transmit power levels. . . 38
4.1 Network structure of the Web site of UAFS . . . 41
4.2 Community discovery methods: a. Agglomerative methods. . . 46
4.3 Community discovery methods: a. Separative methods. . . 47
4.4 Community structure of Southern women-event network . . . 47
4.5 pectral algorithm by Donetti and Muñoz . . . 53
4.6 Schematic illustration of the edge clustering coeffcient . . . 59
4.7 Example of a dynamic in communities . . . 61
5.1 Structural equivalence between two nodes. . . 66
5.2 Initial network . . . 72
5.3 An example illustrates the network topology . . . 73
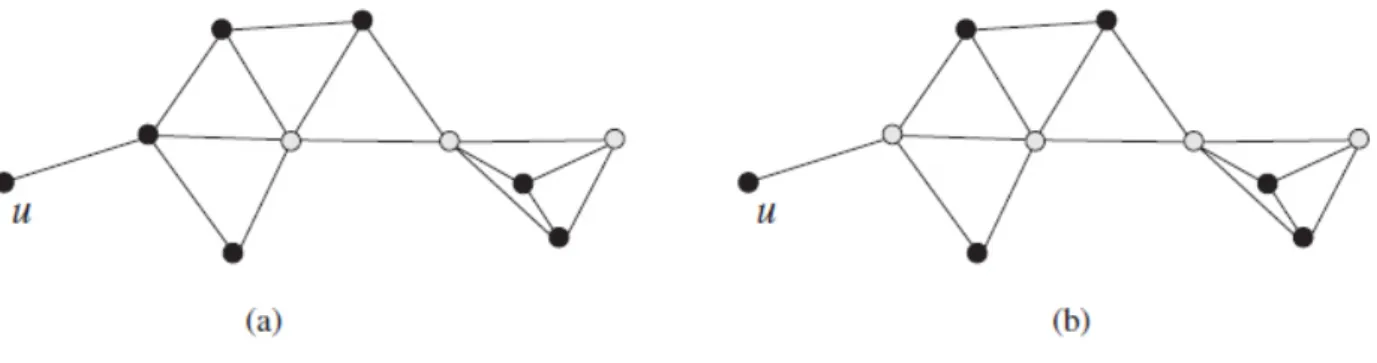
5.4 Comparaison between MIS backbone and virtual community backbone . . . . 74
5.5 Using a relay region . . . 75
5.6 Network lifetime . . . 78
5.7 Rate of received packets of DSR vs PCDSR . . . 78
6.1 A Methodology for Human Mobility Analysis . . . 83
6.2 Illustration of the elements of Feature Vector . . . 88
6.3 Mobiles Paths Database . . . 93
6.4 GPS trajectory and the extracted stay points . . . 94
6.5 Distribution of radius of gyration . . . 95 6.6 a)Profiling of user 126 for different activities b)Points of interest for user 126 . 95 6.7 a)Profiling of user 167 for different activities b)Points of interest for user 167 . 96
6.8 Extracted activities does user practice within different clusters . . . 96
6.9 Frequent mining strategy to find similar users experiences. . . 97
6.10 The results of detecting communities using Fast algorithm . . . 98
7.1 Link prediction problem for Interest Based Mobile Communities . . . 103
7.2 Number of stay points per week in 2009. . . 104
7.3 Number of users per week in 2009 . . . 104
7.4 Users movments during 52 weeks . . . 104
7.5 Illustration of users similarities . . . 106
7.6 Dynamic of IMoComm over four days . . . 110
7.7 Analyzing and excpecting the dynamic of IMoComm . . . 112
7.8 Community type for users ’future links. . . 112
7.9 Illustartion of next IMoComms for user 38. . . 113 7.10 Performance of the prediction method for three social graphs during one month 114
4.1 Community detection methods conducted on small graph . . . 44
4.2 Community detection methods applied on banchmark of 1854 nodes. . . 44
5.1 Structural equivalence and structural weight of the studied network. . . 73
6.1 Characteristics of mobility dataset . . . 93
6.2 Rate of inner community edges . . . 99
6.3 Modularty values . . . 99
7.1 Training and test periods for link prediction for three datasets . . . 111
Introduction
R
ECENT advances in mobile communication consider the social aspects of the mobile network users to resolve various issues and to optimize the performance through the solutions of properties of complex networks. In such a mobile network where the movements of the communicating devices mirror those of their owners, finding a route between two connected or disconnected devices implies uncovering habits in human movements and patterns in their connectivity (i.e., frequencies of meetings, average duration of a contact, etc.), and exploiting them to predict future encounters. It can therefore be assumed that the future of these devices and where they are used will largely determine future innovations surrounding the proliferation of mobile devices.1.1
Problem statement
The main motivation behind studying social computing and mobile wireless network is to im-prove a powerful environment for wireless and pervasive applications. Thereby, understanding human mobility patterns is a significant research endeavour that has recently received consid-erable attention. Moreover, individuals are set to benefit from this area of research, as mobile devices will be able to analyze their mobility pattern and offer context-aware assistance and information. However, links between mobile entities are created and broken, as the mobile entity moves within the network. Such mobility affects not only the source and/or destination but also intermediate participants in the communication, due to the networks multihops na-ture. The resulting routes can be extremely volatile, thus, making successful wireless access depends on efficiently reacting to these topology changes. This issue allow us to address two interesting challenges:
First, the user movements must be understood in order to improve prediction of topology changes and allow available resources to take the best decision about the dynamic of the wireless network at real-time. In addition, we consider the fact that mobility at individual level unveils interesting information: location, time and interest. To achieve this goal, we focus on analyzing the user’s mobility habits and his/her future movements, and, also, extracting a correlation between users patterns to point out the social context of user’s mobility. In the second issue, we manage to take advantage of the users information and his/her social patterns to provide a self organized policy to mobile devices based on efficient distributed topologies. Thus, we will be able to construct meaningful topology with respect to a higher abstract level of the mobile users in order to overcome technical barriers for mobile devices and ensure their self-organization cooperatively.
Analyzing Human mobility behaviour to build efficient topologies dedicated to several mobile applications play a major role for:
• incorporating all the information that is included in the three dimensions: locations, time and social contents,
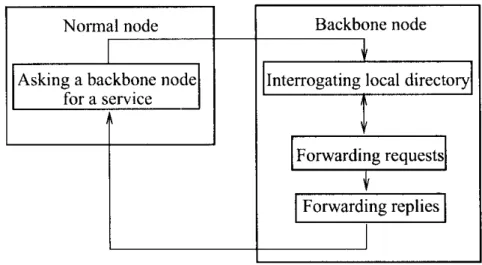
• facilating discovery of services for mobile devices,
• improving network throughput and capacity (conserve energy of mobile devices), • reducing the mobile data traffic,
• using fully decentralized multihop wireless communication would be possible by rein-stalling the communication configuration as quickly as possible,
• repairing the disconnection in the network structure by deploying temporary communi-cation model where each mobile entity is aware about its neighbors,
• exploiting any opportunity that brings mobile data closer to the destination.
1.2
Main issues and Contributions
Human mobility has undergone profound changes in recent decades with the development of new technologies which have transformed our daily lives. People have now sometimes very complex forms of mobility which need new vision in the analysis of dimensions that influence human mobility in order to extract relevant knowledge and predict an efficiently models. In the work [KS01], Kakihara et al. have expanded the concept of mobility by raising a number of significant aspects. It has been shown that ’being mobile’ is not just a matter of
people traveling but, far more importantly, related to the interaction they perform, the way in which they interact with each other in their social lives. This implies that social interactions playing crucial role as space and time aspects on studying human mobility which supplies a new perspective of mobile communication that can help us to enhance interaction among mobile users, through the protocol stack. Therefore, this thesis makes several contributions to accommodate new models in social layer and find out efficient strategies that exploit the social models in virtual topology layer and low-level layers through the protocol stack. Our contributions was a result of the understanding of many topics. The research questions of this thesis resulted in the next contributions:
• An ad hoc network is a collection of devices, which can be mobile, equipped with wireless network interfaces. The devices, also termed mobile nodes, may automatically form a temporary network among themselves without the aid of any established infrastructure or centralized control. The topology of ad-hoc networks is autonomously formed based on nodes’ physical locations and transmission ranges[MH]. To understand the interaction between virtual topology layer and the routing layer, we have proposed a new energy efficient algorithm for the dynamic source routing protocol (DSR) which is based on an enclosure topology and relay region. This topology provides an energy efficient commu-nication through the relay node and ensures connectivity between this relay node and all the existing nodes in its enclosure. This work is presented in the following academic publications:
1. Journal: Ahlem Drif, Abdellah Boukerram, Energy efficient DSR Algorithm based on topology for Mobile Ad-Hoc Network, International Journal of Computer Ap-plications, Volume 83 - Number 11, December 2013.
2. Conference: Ahlem Drif, Abdellah Boukerram, Optimisation de la consommation d’énergie dans les réseaux mobiles ad hoc, Doctoriales de Sciences et technologies de l’information et de la communication STIC’11, 20-21 Avril 2011, Tébessa, Algérie.
3. Conference: Ahlem Drif, Mécanisme de contrôle de topologie dans les réseaux ad hoc, in Embedded Systems Conference, EMP, Bordj-El-bahri, Alger, 05-06 Mai 2009.
• The description of the structure of complex networks has been one of the focus of at-tention of the scientific community in the recent years. The levels of description range from the microscopic (degree, clustering coefficient, centrality measures, etc., of individ-ual nodes) to the macroscopic description in terms of statistical properties of the whole network (degree distribution, total clustering coefficient, degree-degree correlations, etc). The general notion of community structure in complex networks was first pointed out in
the physics literature by Girvan and Newman [GN02], and refers to the fact that nodes in many real networks appear to group in subgraphs in which the density of internal connections is larger than the connections with the rest of nodes in the network. The community structure has been empirically found in many real technological, biological and social networks [EM02a], [ESMS03],[HHJ03] and its emergence seems to be at the heart of the network formation process [GDDG+03]. In our work, we aim to understand the macroscopic structure for the human mobility process in the real world. For this rea-son we have deeply understood the community structure, we have reviewed the existing community detection methods and have studied the network theory presented by New-man in[New10]. We have also developed two community detection algorithms. The first algorithm presents a new method for detecting communities using Markov chains based on the set of frequent motifs. The second algorithm presents an agglomerative algorithm based on relevance coefficient that keeps potentially useful information of the frequency of belonging to one community. The intuitive property is: a node has a high tendency to being members in community if it appears several times in the same community. In human mobility context, we have applied the method based on relevance coefficient for the discovery phase in our proposed methodology for human mobility analysis. Our academic publications related to communities discovery are as follows:
1. Conference: Ahlem Drif, Abdallah Boukerram, and Yacine Slimani. Découverte d’une structure de communauté des usagers du web. In 4 me conférence sur les modéles et l’analyse des réseaux: approches mathématiques et informatiques, Saint-Etienne, France, 2013.
2. Journal: Ahlem Drif et Abdellah Boukerram. Taxonomy and survey of commu-nity discovery methods in complex networks. International Journal of Computer Science and Engineering Survey, vol.5, no 4,2014.
3. Journal: Slimani, Y., Moussaoui, A., Lechevallier, Y., and Drif, A. (2012, Jan-uary). Identification de communautés d’usage du web depuis un graphe issu des fichiers d’accés. In EGC (pp. 525-530).
4. Journal: Yacine Slimani, Ahlem Drif, Abdelouahab Moussaoui, Discovery and Analysis of Usage Patterns for Web Personalization. International Journal on Re-cent and Innovation Trends in Computing and Communication.
5. Technical Rapport: Drif, A., Boukerram, A., Slimani, Y., Moussaoui, A. (2016). Découverte de communautés dans les réseaux complexes. Hal.archives-01389844.
6. Journal: Yacine Slimani, Abdelouahab Moussaoui, Yves Lechevallier, Ahlem Drif, Discovering Communities for Web Usage Mining Systems, will appear in Interna-tional Journal of Advanced Intelligence Paradigms (2017).
• Exploring and analyzing human movements that are changing over time, relating to user habits and depending on spacial aspect is a challenging problem [BCH+13], [RSH+11a].
The very first step in understanding human mobility consists in having data represent-ing such mobility in order to extract characteristics from them. Among the available mobile data sets , we have chosen the very large dataset collected in GeoLife project and released by Microsoft Research Asia [ZZXM] [Zhe] which we will present in chapter 6. Geolife dataset provides a good context information, including time, history, real location coordinates, daily activities of individuals which allows us to:
– assess the mobility features.
– design algorithms that can effectively learn from dynamic of mobile users.
In this contribution, we are interested in discovering communities of mobile users and studying how do communities provide accurate knowledge to analysis the different forms of human mobility. The basic idea of our contribution is to model the behaviour of users with strong social characteristics regarding the context of their location histories to explore a similar interest of people by mining their mobiles communities. To that purpose, we have extracted, first, the stay points, each of which denotes a geographic region where an individual stayed for certain duration, from the trajectory data, and second, we have explored the semantic meaning of a physical location using a simple model to express the relationship between the locations and the activities. After that, we have designed an algorithm to mine the travel sequences between two different individuals with respect to their location histories. Then, we have derived the similar interests among people which induce the extraction of their mobile communities patterns. The proposed methodology illustrates in what way a common interest of a group of individuals can create better understanding of human mobility. Realistic models based on these interest based communities can be the basis for several applications as recommendation system or wireless networks management. The academic publication of this work is:
1. Journal: Ahlem Drif, Abdellah Boukerram, Yacine Slimani, Silvia Giordano, Dis-covering Interest Based Mobile Communities, Mobile Networks and Applications, February 2017. DOI:10.1007/s11036-017-0811-3.
• A very significant characteristic of ad hoc networks is the presence of community struc-ture which can be represented by a group of mobile devices that carried by humans that
share common interest. The communication of such devices is, then, necessarily based on socialization behaviour, so a community organization is paramount and a number of social and technical barriers must be overcome in order for mobile ad hoc communities to self-organize cooperatively[H.R02]. Thus, we have proposed a social-aware approach for constructing efficient topology based on a common interest of mobile users. In the first phase approach, we construct a clustering tree based on structural weight of nodes with respect to the range assignment mechanism. The key idea of topology control techniques is to adjust nodes’ transmission power to achieve several objectives such as reducing energy consumption, reducing interference, and increasing network capacity, while maintaining network connectivity. In the second phase, the approach ensures that a mobile can reach all members of its community based on an efficient virtual backbone of community. The comparison with Minimum Independent Dominating Set topology shows that the proposed method build a meaningful network topology. Our academic papers related to this contribution have been presented and published in:
1. EditedProcedding: Ahlem Drif, Abdellah Boukerram, and Yacine Slimani. Com-munity discovery topology construction for ad hoc networks, in Lecture Notes (LNICST) Wireless Internet, pages 197-208, Springer 2014.
2. Conference: Ahlem Drif, Abdallah Boukerram, and Yacine Slimani. Commu-nity discovery topology construction for ad hoc networks. In International Wireless Internet Conference-The 8th International Wireless Internet Conference - Sympo-sium on Wireless and Vehicular Communication, November 13-14, 2014, Lisbon, Portugal.
• Mobile movement prediction is defined as the prediction of a mobile user’s next movement in a networked environment. In this work, we have proposed a novel prediction algorithm by leveraging temporal information on network dynamics. We have took advantage of the temporal graphs, the past history of an individual and the past history of person related to him. Thus, the proposed approach improves effectively prediction of users mobile behavior with regard to his/her next Interest based Mobile Community. Our method faithfully captures the user-specific mobility aspects and allows to deploy an efficient human mobility models that combine multiple information sources from users correlation and their behavioral patterns. Our contribution has been presented and published in:
1. Book Chapter Drif, Ahlem., Boukerram, Abdellah., Slimani, Yacine., and Gior-dano, Silvia. Can we recognize the next user’s mobile community?. in Jour-nal of Complex Networks and Their Applications. November 2017 (will appear)
DOI : 10.1007/978− 3 − 319 − 50901 − 327 , Vol 5, pp.335-346.
2. Conference Drif, Ahlem., Boukerram, Abdellah., Slimani, Yacine., and Giordano, Silvia. Can we recognize the next user’s mobile community?. in Proceedings of the
5th International Workshop on Complex Networks and their Applications, 28-30 November 2016, Milan, Italy.
1.3
Outline
The previous objectives and contributions are addressed along this dissertation following the structure described next.
Chapter 2 provides the basics and the background of human mobility analysis. It gives ex-planation of the characteristics of human mobility that we try to fulfill in this work. It is followed by descriptions for the terms that are frequently used in human mobility analysis and in our work. We also explain the characteristics of mobility data source in mobile devices. The chapter provides a brief overview of recent works that study the daily life mobility patterns and presents the classical human mobility models.
Chapter 3 provides an overview of the state of the art concerning the topology optimiza-tion problem. It gives a definioptimiza-tion of topology optimizaoptimiza-tion and describes the features of the communication graph. It also clarifies the basic idea of several virtual topologies and gives their classification. After having described a taxonomy of the topology control approaches, the chapter ends with a discussion on how social models can be integrated into the network protocol stack. On this point, we introduce our social perspective that express the need to deign novel social-aware approaches that take as input certain spatial, temporal and social parameters to provide valuable scheme to the topological and physical layers.
Chapter 4 contains some examples of real networks with community structure. In this way, we shall see what communities look like and why they are important: social networks are paradigmatic examples of graphs with communities, and, the word community itself refers to a social context. Then, we describe community local definitions and community comparing definitions, and, we review the notions of partition quality. Driven by the growing popularity of community detection methods in complex networks, we point out the most cited works in the literature, and, provide a taxonomy for community detection methods. Finally, chapter 4 gives a brief discussion of the issue of communities in dynamic networks.
In chapter 5, we introduce our proposed model for constructing meaningful topology based on the common interest of the users of ad hoc network and we give definitions of the structural equivalence measure. Then, we explain the process of constructing a privileged set which
gen-erally aims to get a better topology control strategy. We discuss the design of a context-aware algorithm including the common interest information that characterize a mobile entity. This chapter gives a comparison with the two implemented topologies which demonstrates the effi-ciency of the proposed scheme. Finally, it follows by presentation of the idea key of interaction between topology layer and routing application in order to highlight the benefits of using a self organized policy to mobile devices.
Chapter 6 is devoted to explain the proposed mobility data mining methodology. Here, our ultimate goal is to extract relevant knowledge and provide an abstract level for under-standing people mobility. So, this chapter describes our work in detail. The experimental results demonstrate the validity of the proposed methodology to extract what we have called "Interest based Mobile Communities" (IMoComm) in a real case.
In Chapter 7, we develop a new technique to improve users movement prediction using in-sights from analysis of network dynamics. The chapter explains the analysis of the dynamic of individuals at community level over different timing and thus defines communities prediction features. After performing an unsupervised task to extract the link pattern between people that distinguish meaningful Interest Based Mobile Community structures, we take advantage of temporal graphs, in a given learning period, and , therefore, we have investigated user’s patterns to infer which new mobile community a user is likely to be at in the near future which result in reducing dramatically prediction space.
Analysis of Human Mobility for
Mobile Wireless Networks
2.1
Introduction
Nowadays, the huge worldwide mobile-phone penetration is increasingly turning the mobile network into a gigantic ubiquitous sensing platform, enabling large-scale analysis and ap-plications. With the current advent of mobile devices such as smart-phones and tablets, understanding and modeling human interactions with respect to the spacial, temporal and social dimensions can help to develop mobile infrastructure placement, transfer scheduling algorithms, mobile advertising, mobile social networking, location based services and so on. In this chapter, we point out the basic concepts and discuss the key ideas and the problems that motivate our work.
2.2
Analysis of Human mobility
Human mobility has a significant influence on the performance of systems that involve daily human activities. Therefore, studying and finding fundamental characteristics of human mo-bility and developing realistic human momo-bility models are essential for optimum construction of these systems. Recently, for achieving more reliable models, researchers have tried to use real human traces in their studies such as mobile-phone-location traces [GHB], GPS traces [ZLC+], or Wireless Data [RSH+09].
individ-Figure 2.1: Factors of influence on individual mobility behavior[Hun06]
ual mobility behavior: Personal factors and External factors (see figure 2.1). Among these factors, two types of personal factors are mentioned as relevant factors for individual mobility: socio-demographic characteristics and attitudinal factors, which determine individual options and needs for mobility activities. Attitudinal factors include values, norms and attitudes (e.g. symbolical estimations of transport modes), which affect preferences and habits for specific activities, destinations, routes and means of transport. Furthermore, recent works try to define and extract behavioral features of individuals from individual mobility traces (such as popular places, the media and content they have accessed via internet, working pattern, ..., etc.)
2.2.1
Definitions
2.2.1.1 Flight
Flight is a straight line trip from one location to another without a pause or directional change [RSH+11b]. Gonzalez et al. [GHB] analyzed cellular network records and extracted
flight lengths with the concept of flight length as the distance between tower locations which handle consecutive calls of a user. They use two data sets for exploring the mobility pattern in human beings. The first one consists of traces of 100000 individuals that were selected from six million mobilephone users recorded over six months. The second one contains locations of 206 mobilephone users recorded every two hours for one week. In all the data sets they show that the flight length follows truncated power-law distributions (see figure 2.2).
Figure 2.2: The rectangular model used to extract flight information from traces.
2.2.1.2 Pause time
Pause time is the time during which a user stays at one point before starting a new flight.
2.2.1.3 Radius of gyration
Radius of gyration is the characteristic of a users trajectory during an observation time. This parameter is used to measure how far and how frequently a user moves. Thus, it was shown that the distribution of the radius of gyration can be approximated by a truncated power law. This suggests that the majority of people usually travel in close vicinity to their home location,
while few of them frequently make long journeys [SQBB].
2.2.1.4 Gap
Gap is the distance between two time-consecutive points of a user’s location traces.
2.2.1.5 Visit point or stay point
Visit-point is defined as a place where a user makes a stop or pause. In [LZX+08], the stay
point is defined as the location where a user stays more than 30 seconds within a circle of 5 meter radius of that location for the collected GPS traces.
2.2.1.6 Hot spot
A cluster of visit-points that are connected to each other meaning that they are within a predefined radio range.
2.2.1.7 Jump size
Jump size or travel distance characterizes the spatial dimension of users. Thus, the average travel distance can be defined by ∆r(l) =∑ni=2|ri−ri−1| where rl = r1, r2, ...rnbe the sequence
of n geographical displacements where user l have traveled during a time period and|ri−ri−1| is
the distance between locations ri and ri−1. Travel distance can range from a few to thousands
of kilometers over a periods of time [PWJX14].
2.2.1.8 Truncated power-law distribution
It is shown that the lengths of human flights which are defined to be straight line trips without directional change or pause (or lines between two consecutive stay points) have a truncated power-law distribution [CSN09].
2.2.1.9 Fractal waypoints
The stay points of humans can be modeled by fractal points. This implies that people are always more attracted to more popular places. The term fractal-points means the more popular points are clustered together while the less popular point are far from others. The high popular places are rare and the less popular places are plenty. The distribution of the points is the same in every level of resolution, in other words, fractal-points exhibit self-similarity [RLH+08].
2.2.1.10 Inter-contact time
Inter-contact time is defined as the time elapsed between two successive contacts of the same devices [S+06].
2.2.1.11 Return time probability
Return time probability distribution is the probability of returning at time t to a selected place. Prominent peaks (at 24, 48, 72, . . . , h) capture the tendency of humans to return regularly (on a daily basis) to a location they visited before [GHB08a].
2.2.2
Spatial, Temporal and Social Dimensions
Recent works have focus on expanding the concept of mobility by looking at three distinct dimensions of human interaction; namely, spatial, temporal and contextual mobility. The spatial features refer to the movement of people in physical space but also the global flux of objects, symbols, and mobility of space in virtual communities, temporal aspects are related to duration, sequence, temporal location and rate of recurrence of events [Bar88] whereas the social dimension is related to relational aspects of human interaction and contexts in which the human actions occur [LS00]. Social dimension of human interaction is increasingly mobilized by the impacts of various mobile technologies and the growth of social networks. Our society is transforming itself into a mobile society, where interaction itself is mobilized [SMK].
2.2.3
Mobility Data Sources in Mobile Devices
The very first step in understanding human mobility consists in having data representing such mobility in order to extract characteristics from them. Therefore, it is important that the data reflects as faithfully as possible the information related to mobility. It can be inspected from many different perspectives depending on the application.
• Mobility levels: general (all the movements of the user), medium small scale (mobility inside a campus), or indoor (inside a building, floor, room, etc.), among others.
• Accuracy: might be key (for indicating a friend where we are, or to locate ourselves in a foreign city), or can be a relaxed requirement (when looking for restaurants nearby). • Locating: the user might be enough (for applications with just the current location
attached to each request), or the user might need to be tracked. In this last case, the tracking frequency is also another parameter to analyze.
Nowadays almost every person carries a mobile device with her, all day long, everywhere she goes. Thus, the mobile device is the perfect proxy to track user’s mobility. This fact was rapidly acknowledge by the research community, who took advantage of the increasing number of sensors as well as the available application programming interfaces (APIs) of the different operating systems, which incredibly ease the use of the systems and sensors in the devices, to develop applications capable of tracking the user’s movements. Among the several systems integrated in the mobile devices that can be leveraged as location proxies, the most popular ones are GPS, as it is the only one providing real location coordinates, and also Wi-Fi and the cellular telephony network. There are other systems, like Bluetooth and Radio-frequency IDentification (RFID), which are also used in some specific scenarios to locate people in small size environments. We present the technologies available in mobile devices to track their owners location below:
1. Global Positioning System (GPS): The great majority of new mobile devices inte-grate a GPS system. When a user wants to obtain her location using this technology, first she/he enables the GPS of the terminal, then the device searches for the satellites and synchronizes with them, and finally, once the synchronization is set, the user can perform location requests. The location data accuracy is the main strength of this tech-nology, since it is close to 10 meters [DR01] [Zha02]. However, the decrease of the battery consumption comes at the cost of reducing the accuracy of the location data obtained [CGS+09]. Figure 2.3 shows a sample of GPS traces tracked from the Disney World.
Figure 2.3: Sample GPS traces from the Disney World scenario.[RSH+11b]
2. Wi-Fi-based location: By monitoring the Wi-Fi access point (AP) the user’s device is attached to ,as he/she moves, his/her mobility patterns can be indirectly tracked. The mapping between the AP medium access control (MAC) address and its location is needed in order to know the zone where the user is at all times. Since location tracking using Wi-Fi only needs to know the AP MAC address (no need for data transferring), the power consumption of having the Wi-Fi antenna working, scanning the radio envi-ronment looking for new Wi-Fi networks, and being attached to some AP is low [FN01] . However, depending on the method for translating the MAC address of the AP to the corresponding coordinates, there may exist an extra power consumption if an Internet connection is needed.
3. Cellular telephony network-based location: The working principles of this system are very similar to those of Wi-Fi case. The user mobility is tracked by knowing the network base transceiver station (BTS), also referred to as cell, the device is attached to as the user moves. In this case, a translation from BTS (cell) information to coordinates is also needed. The coverage is the main advantage of this technology since it provides global coverage, even in indoor environments. However, a cell from Global System for Mobile Communications (GSM) network ranges from 200 meters radius in urban areas to up to several kilometers in rural scenarios, thus the accuracy being much worse than GPS or Wi-Fi systems.
4. Bluetooth and Radio-frequency IDentification (RFID): Bluetooth-enabled de-vices are prevalent and the device population is relatively homogeneous. There were a several experiences collecting traces of Bluetooth activity in different urban environment and in some controlled setting [SCM+06].
5. Location-Based Social Networks (LBSN): This new type of social network is based on each of its users indicating (check-in) the place (restaurant, airport, sport center. . .
) where she/he is at every moment, like in Foursquare. Therefore, the location history can be directly obtained by taking the sequence of check-ins made by the user. The accuracy depends on the honesty of the user: if she/he checks-in where she/he really is, then she/he will be located inside the place she/he says to be, and depending on the size of the place, the accuracy will be higher (if the place is small, like a restaurant), or lower (if the place is big, like a mall).
2.3
Human Mobility Features
Researchers studying daily life mobility patterns have recently shown that humans are typi-cally highly predictable in their movements [PZG+13]. The studies surveyed can be roughly
classified, mainly, into two groups, depending on the perspective form which mobility is ana-lyzed. On the one hand, many works hold a perspective centered on the environment where mobility is studied, generally at city-level. Its main goal is to uncover how mobility shapes the environment or vice versa, but with the central aspect being mobility in the environment. The opposite perspective is user-centric, that is to say, the goal in this case is to characterize the individual or group behavior, but having the person as the center piece instead of the environment.
2.3.1
Mobility Features from a Location-Centric Perspective
Considering the case of location-centered mobility, sometimes known as urban dynamics, many works have appeared in the last years in line with the advent of smart cities and the corre-sponding need to understand the inhabitants flows defining the scenario [STN15] to help in planning and provision of municipal facilities and services, provide better public transportation [BCDL+13] and road usage [WHB+12]. This type of studies were not possible until traditional
approaches, like surveys, were replaced by the data provided by cellular network operators, which disclose more than just snapshots of people movements, but where the spatial extent and temporal correlations are wider than the ones provided by previous studies.
One of the first works using cellular telephony data to characterize urban-related features was carried on by the MIT in collaboration with Telecom Italia [RCSR07]. The study divided Rome into pixels and chose six different locations of one pixel each. The Erlang daily traffic distributions were studied, to group them by degree of similarity and map them to hot and cold areas of activity along the day, week and month. This work was taken as reference by Sun et al. [SYW+11], who also divided a southern city in China into pixels, and by using the
the cellphone usage data from the CDRs in each pixel.
More recent works, like [BCH+11], use CDRs to capture the city dynamics by determining the residential areas where people work and the residential areas of late-night people, thus demon-strating that clustering people based on cellphone usage is possible, even without taking into account temporal correlations. Follow up works [IBC+10], [IBC+11a], [IBC+11b] extended the former study by finding mobility patterns in New York and Los Angeles regions, such as identifying important locations, who travels further, who travels more distances, when people move more and at what season, among others, using a metric called daily range, which corre-sponds to the maximum distance traveled in a single day.
One of the most common studies regarding cities is to uncover which are the different regions of the city. In the work [YZX12], the authors try to complement the knowledge of points of interest (POIs) of a city with the information provided by CDRs to differentiate the intensity of each function in each region or location (e.g., a small restaurant has a different impact than a big attracting one, even when the two of them are considered POIs).
2.3.2
Mobility Features from a User-Centric Perspective
The second standpoint of mobility is user-centric, referring to the works aiming at characterize the intrinsic features of human mobility, disregarding the specific scenario where they move. In the survey elaborated by Lin et al. [LH14], they review relevant results in some of the main areas studied in human mobility studies: inferring important locations, detecting modes of transport, mining trajectory patterns, and recognizing location-based activities. They also classify mobility analysis into two main areas: mining mobility patterns and constructing mo-bility models. These two big blocks were also pointed out in [KBCP11], authors have proposed a framework that includes data collection and the final applications where the mobility results and models are applied as additional areas conforming the big picture of human mobility study. Regarding the identification of salient locations, Eagle et al. [ECQ09] analyzed CDRs of 215 individuals recorded during 5 months to cluster the most used BTSs (i.e., locations) and validated the results using data coming from Bluetooth beacons placed in the individuals homes. In [ZZXM], the authors use GPS data from 107 users taken during a year to mine interesting locations, as well as classical travel sequence, for travel recommendation.
Boldrini et al. [BP10] identify the preference to spend time in a limited number of popular locations, and study the preference to select short distances over longer ones, and compute the sociability of users. Thus, they have proposed a mobility model based on these three proper-ties for reproducing accurately the behaviors of users in mobile ad-hoc networks (MANETs), opportunistic and delay tolerant networks.
In the works [GHB08b] [TdMGP15], the authors use the CDRs of 100,000 users collected dur-ing 6 months to study the basic laws drivdur-ing human motion. They found out that human trajectories show a high degree of temporal and spatial regularity, since each individual is
characterized by time-independent travel distance and a significant probability to return to a few highly frequented locations. The distribution of the distance covered in the displacements suggests that human motion follows a Levy Walk, and the calculation of the radius of gyration (i.e., the distance traveled by the user when observed up to time t) follows a truncated Levy Flight distribution. These results were backed up by the work of Rhee et al. [RSH+11a], where GPS data were used instead of CDRs, but leading to the same heavy-tailed distribution of the distances covered by the individuals in their displacements. These behaviors, widely detected in several different data sets and populations, is in line with the exploration and preferential return model proposed in [SKWB10]. A novel finding is the two types of individuals found in [PSR+15], where the authors split the population into the so called returners (people who only visits a very limited set of locations) and explorers (people who travels to many more different and distant locations than the most usual ones), and explain the role of both types of individuals in the spread of diseases and social networking. Song et al. went a step further by proposing a new metric for mobility [SQBB10]. In their study, they used CDR data of 50.000 individuals recorded during 3 months, and study their entropy and entropy rates, to finally propose a new metric, the predictability, which sets the upper bound on the best accuracy a location prediction algorithm could ever achieve, depending on the specific user entropy rate and different number of locations visited. They show that predictability is largely indepen-dent from the radius of gyration, and that the average predictability is centered in the 93% of correct predictions. After its proposal, predictability has been widely studied.
2.4
Existing Human Mobility Models
Human mobility models can help in predicting the movements of humans. In this way they can be used in studying the effect of the topology design for finding ways to reduce the unnec-essary communication signals. The optimizations also have great impacts on heterogeneous networks because of extensive communication requirement due to cooperation among varying communication network technologies. Moreover, human mobility models can be very helpful in a variety of social issues [?], for example, urban planning, traffic engineering, understanding spread pattern of diseases, traffic congestion detection (e.g. accidents), and disasters discovery. Many human mobility models in the past two decades have been developed to represent human mobility patterns. However, very few of them were validated against large-scale and detailed human traces because of many technical and legal problems. Nowdays, some attempts have been made to collect real human traces, such as mobile-phone-location traces [GHB], GPS traces [RSH+11a], [RLH+08], or trace of wireless contacts and social connections [MDX12].
There have been a lot of efforts to introduce a synthetic human mobility model that can cap-ture human travel behavior in a realistic way. These existing models can be categorized into: random models, random variant models, geographical models, and social behavior models.
However, with all the new data captured by mobile phones about user mobility, it became clear that classical mobility models, such as random walk or random waypoint, among others, fall short to capture the real features driving human mobility. Thus, this huge amount of lo-cation data captured using mobile devices as monitoring tool needs to be carefully considered to determine which mobility-related information is able to provide, and their limitations, so that more accurate conclusions about mobility can be derived from it.
In the following paragraphs, we discuss each category of models and their ideas:
2.4.1
Random models
In random models, stay points are chosen randomly based on some probability distributions [RSH+11b].
• Random walk model or Brownian motion model: In this model, speeds and directions are randomly assigned to mobile nodes to select their next destination, i.e. each mobile node’s speed is chosen uniformly from a defined range [speedmin, speedmax], while its direction is chosen from the range [0−2π]. The mobile nodes move for a distance,
d, or time interval, t, then it is considered that they have reached their destination.
• Random waypoint: This model is like the random walk except that it considers the pause time as well. When the node reaches its destination it remains there for a prede-fined amount of time and then selects a new destination according to a uniform distri-bution over the area.
• Truncated Levy-walk model: The Levy walk model takes after the random walk, but it represents the heavy-tail flight feature. In this model, a step is defined by flight length, direction, flight time and dwell time. Mobile nodes choose their direction randomly, then choose flight length and pause time to follow truncated power-law distributions. Flight lengths have a probability density function as follows:
p(l)∼
{
l−(1+α) ; l <= lmax
0 ; l > lmax
Where a walker makes a flight followed by a pause,θ is the direction of that flight, l > 0 is the length of the flight, ∆tp is the time duration of the pause or pause time, α is a
constant parameter of the distribution known as the exponent or scaling parameter, and
β is the displacement exponent.
Figure 2.4: Sample trajectories of (a) Brownian motion, (b) Levy walk and (c) Random way point
p(∆tp)∼
{
∆t−(1+β)p ; ∆tp <= ∆tpmax
0 ; ∆tp > ∆tpmax
Rhee et al [RSH+11b] used mobility track logs obtained from 44 participants carrying GPS
receivers from September 2006 to January 2007. The sample settings where traces are obtained are two university campuses (one in Asia and one in the US), one metropolitan area (New York city), one State fair and one theme park (Disney World). The participants walk most of times in these locations and may also occasionally travel by bus, trolley, cars, or subway trains. They have illustrated that many statistical features of human walks follow truncated power-law, showing evidence of scale-freedom. Furthermore, they have construct a simple Levy walk mobility model which is versatile enough in emulating diverse statistical patterns of human walks observed in the studied traces (see figure 2.4).
2.4.2
Random variant models
In this type, the mobility models are also random but they contain dependencies (spatial or temporal) .
• Markovian way point model: This model is a mobility model based on the basic random waypoint model. It implements some Markovian transition probabilities among waypoints. In other words, choosing next waypoints depends on current locations. This will create spatial dependency for the model [Meg10].
• Gauss Markov model: This model contains temporal dependency. The idea is that mobile nodes choose their speed and direction randomly as in random models, but after
a fixed time interval, the speed and direction are calculated again considering previously calculated values of these parameters [GHB08b].
• Reference point group mobility model: In this model, mobile nodes make a group and each group has a leader and the nodes move along with their leader, with the same direction and speed. That leader is considered as the reference point for the group and around that each mobile node is moving in its own way. Both the group and individual movements are based on random waypoint models. The fact that in this model each node’s speed may depend on its neighbor’s speed creates spatial dependency [Meg10].
2.4.3
Geographical models
These models contain geographical constraints.
• Freeway model: Each mobile node is limited to its lane on the freeway and also the speed of the mobile node temporally relates to its previous speed.
• Manhattan model: It has the same characteristics as the freeway model but the mobile nodes can make turns at each corner of the street [BSH03].
• Obstacle model: In order to represent realistic geographical limitations, this model introduces obstacles in pathways. These obstacles are randomly placed in the simulated area. Mobile nodes should change their paths and choose proper ways to avoid running into those obstacles [PBDK12].
2.4.4
Social models
This type of mobility models considers human mobility based on collective human behaviors which are affected by social factors such as friendships.
• Dartmouth model: In this model, mobile nodes are modeled to move among hot spots. Mobility information, which contains hot spots locations, transition probabilities for moving between hot spots, and pause time distribution, is extracted from real data sets. The model estimates the locations and paths of mobile nodes based on the extracted, region dependent mobility information. So, it needs to have the transition probabilities for moving between hotspots and the locations of hotspots as the input [LHK+09].
• Clustered mobility model: This model is based on preferential attachment theory which means the attractiveness of one area is determined by the current number of nodes that are assigned to that area. The mobile nodes tend to visit attractive areas. The result of this fact is that, areas which have high attractiveness will gain more attractiveness. This model divides the simulation area into a number of subareas and then assigns the mobile nodes to these subareas using the referred theory. Mobile nodes select their next subarea according to its attractiveness which is proportional to (k + 1)α, where k is the number of nodes in the subarea and α is the clustering exponent. Consequently, the attractiveness follows power-law distribution [NSRD11].
• ORBIT model: In the ORBIT model the total network area is divided into a number of clusters and each mobile node is assigned a subset of these clusters. The mobile nodes are able to move randomly only within their clusters set [GPQ07].
• SLAW: Self-similar Least Action Walk model: In [LHK+09], Lee et al. have
introduced a model called SLAW which generates fractal waypoints, and uses it with the Least Action Trip Planning (LATP) algorithm to simulate human traces. The SLAW model starts with generating a map with fractal waypoints. In this model, the mobile nodes first select a subset of waypoints in the generated map. Then, the order, in which those selected waypoints are going to be visited, is specified as the mobile node’s daily plan. SLAW first builds clusters of waypoints, for representing hot spots, by connecting every pair of waypoints whose distances between each other are less than 100 meters (typical Wi-Fi outdoor transmission range). Each cluster is assigned a weight which is the ratio of the cluster’s size (number of waypoints in that cluster) to total number of waypoints in the map. Each mobile node chooses 3 to 5 clusters randomly from clusters set with probability proportional to these weights. In other words, the model represents cluster’s popularity proportional to cluster’s size. Then, each mobile node selects 5% to 10% of waypoints in each chosen cluster uniformly. To sum up, this waypoint selection algorithm creates heterogeneously bounded mobility areas, one of the characteristics of human mobility.
• SMOOTH model: In [MCN11], Munjal et al. have proposed a model that captures some of the features: Human-Mobility characteristics; flight lengths and pause time follow truncated power-law distributions. The idea of the model is described in two parts: visit-point placements and movement patterns. The waypoints is regrouped in clusters and their popularities are defined by randomly assigned probabilities to have the sum of all clusters’ probability as one. Each cluster is represented by a single coordinate called landmark. Landmarks are placed uniformly over the simulation area such that no two landmarks are within each other’s transmission range. There is no boundary defined for any cluster. For initial placement of a mobile node in the network, a mobile node selects a cluster by its probability and is placed within half of the cluster’s transmission
range. For the movement pattern, each mobile node chooses to explore a new location with the probability proportional to the number of distinct locations visited so far. For the new location first the flight length is generated using a power-law distribution. Based on this length and the current location of the mobile node the destination is calculated. If the node chooses to visit one of the locations it has visited before, the location is selected with probability proportional to the total number of times the node has visited the location so far.
2.5
Conclusion
This chapter provides an overview of the state of the art concerning the topic covered in this thesis. It includes some background on one of the main building blocks in which the thesis is based on; the human mobility features, mobility data source and keys concepts for further chapters.
Topology Optimization in Wireless
Networks
3.1
Introduction
An important problem appearing in computer-communication network is to design an optimal topology for increasing the network traffic carrying capacity. This chapter considers the case of mobile networks, and it discusses the implications of node mobility on the characterization of an optimal topology with respect to the critical range for connectivity. In the end of the chapter, we introduce our social perspective of topology optimization and discuss the features of interaction between social layer and virtual topology layer in the protocol stack.
3.2
Topology optimization problem
Definition 1 We consider a wireless ad hoc network consisting of a set V of N wireless
nodes distributed in a two-dimensional plane. By proper scaling, we assume that all nodes have the maximum transmission range equal to one unit. These wireless nodes define a unit disk graph UDG (V ) in which there is an edge between two nodes if and only if their Euclidean distance is at most one. Unit Disk Graphs (UDG) are the most prominent class of graphs used
in wireless network [BCH+13].
Topology Control is the art of coordinating nodes’ decisions regarding their transmitting ranges, in order to generate a network with the desired properties (e.g.connectivity) while reducing node energy consumption and/or increasing network capacity.
every u∈ N a transmitting range RA(u), with 0 < RA(u) < rmax, where rmaxis the maximum
transmitting range. Note that, under the assumption that the path loss model is the same for all the network nodes, and that shadowing/fading effects are not considered, transmitting range, and transmit power level are equivalent concepts. Since , traditionally, the function RA is defined in terms of range, instead of power. The Range Assignment problem, which was first studied in [KKKP00], is defined as follows:
Definition 2 Let N be a set of nodes in the d-dimensional space, with d = 1, 2, 3.
Deter-mine a range assignment function RA such that the corresponding communication graph is
strongly connected, and c(RA) = ∑i∈N(RA)α is minimum over all connecting range
assign-ment functions, where α is the distance-power gradient.
The cost measure c(RA) used in the definition of the RA problem is the sum of the transmit power levels used by all the nodes in the network.
Definition 3 MINIMUM TRANSMITTING RANGE MOBILE (MTRM): Suppose n nodes
are placed in [0, l]d, and assume that nodes are allowed to move during a time interval [0, T ]. What is the minimum value of r such that the resulting communication graph is connected during some fraction, f , of the interval?
Thus, RA can be informally stated as the problem of finding a minimal nodes range assignment that generates a connected communication graph, where ’minimal’ is intended as ’least energy cost’. In a certain sense, the RA problem can be seen as a generalization of the problem of determining the critical transmitting range (CTR) for connectivity.
3.2.1
Features of communication graph
It have been shown that the constraints of the critical value of the transmitting range CTR can be determined in order to guarantee the most important network property, that is, connectivity.
Definition 4 Connectivity A graph G is said to be k-connected, where 1 <= k < n, if
for any pair of nodes u, v there exist at least k node disjoint paths connecting them. The connectivity of G, denoted as k(G), is the maximum value of K such that G is K-connected. A 1-connected graph is also called simply connected.
The interest in studying the CTR for K-connectivity is motivated by the fact that, when a network is K-connected, at most K− 1 node or link faults can be tolerated without discon-necting the network. So, a K-connected network is more resilient to faults than a simply connected network, where a single node or link failure might partition the network.
3.2.2
Virtual topologies classification
Various research deal with services oriented architectures and communication in mobile wireless networks are interested to use virtual dynamic topologies to get a better network organization and ensure an efficient connectivity. Several studies have constructed and maintained virtual topologies in wireless networks in order to optimize data flows and exchanges. In [MH], Haddad et al proposed a classification of mostly used topology based solutions in ad hoc networks. As we can see from figure 3.1, the authors classify topologies into two main classes:
• Covering node Sets: This class is based on subsets of V which share some proprieties like covering property, dominating property,... It regroups Multipoints relays (MPR sets), Dominating Sets (DS), Independent Sets (IS), Minumum Independent Sets (MIS), ect
• Link Based Structure:This class is based on subgraphs of G. It regroups Neighbor-hood Graphs (NG), Spanning Tree (ST), Minumum Spanning Tree (MST), ect.
![Figure 2.1: Factors of influence on individual mobility behavior[Hun06]](https://thumb-eu.123doks.com/thumbv2/123doknet/3477335.101616/22.893.92.806.111.610/figure-factors-influence-individual-mobility-behavior-hun.webp)


![Figure 4.4: a)The Southern women dataset [DGG09] b) Partition of the bipartite graph into communities aplying label propagation algorithm](https://thumb-eu.123doks.com/thumbv2/123doknet/3477335.101616/59.893.147.758.820.1054/figure-southern-dataset-partition-bipartite-communities-propagation-algorithm.webp)