Self-Selected or Mandated, Open Access Increases Citation
Impact for Higher Quality Research
Yassine Gargouri1, Chawki Hajjem1, Vincent Larivière2, Yves Gingras3, Les Carr5, Tim Brody5 & Stevan Harnad,4,5
1Institut des sciences cognitives, U. du Québec à Montréal
2Observatoire des Sciences et des Technologies, U. du Québec à Montréal 3Canada Research Chair in the History and Sociology of Science, U. du Québec à
Montréal
4Canada Research Chair in Cognitive Sciences, U. du Québec à Montréal 5School of Electronics and Computer Science, U. of Southampton
Corresponding Author: S. Harnad, Institut des sciences cognitives, Université du Québec
Abstract:
Background: Articles whose authors have supplemented subscription-based access to
the publisher’s version by self-archiving their own final draft to make it accessible free for all on the web (“Open Access”, OA) average twice as many citations as articles in the same journal and year that have not been made OA. Some have suggested that this “OA Advantage” may not be causal but just a self-selection bias, because authors preferentially make higher-quality articles OA. To test this we compared self-selective self-archiving with mandatory self-archiving for a sample of 27,197 articles published 2002-2006 in 1,984 journals.
Methdology/Principal Findings: The OA Advantage proved just as high for both.
Logistic regression analysis showed that the advantage is independent of other correlates of citations (article age; journal impact factor; number of co-authors, references or pages; field; article type; or country) and greatest for the most highly cited articles. The OA Advantage is real, independent and causal, but skewed. Its size is indeed correlated with quality, just as citations themselves are (the top 20% of articles receive about 80% of all citations).
Conclusions/Significance: The OA advantage is greater for the more citable articles, not
because of a quality bias from authors self-selecting what to make OA, but because of a quality advantage, from users self-selecting what to use and cite, freed by OA from the constraints of selective accessibility to subscribers only. It is hoped that these findings will help motivate the adoption of OA self-archiving mandates by universities, research institutions and research funders.
One-sentence Summary: We demonstrate that the greater citation impact of open access research is causal rather than an artifact of author bias (i.e., authors self-selectively making higher quality research open access) by showing that the citation increase is just as great when the open access is mandatory; the open access impact advantage is independent of other correlates of citation impact, and greater for higher quality research.
Introduction
The 25,000 peer-reviewed journals and refereed conference proceedings that exist today publish about 2.5 million articles per year, across all disciplines, languages and nations.
No university or research institution anywhere, not even the richest, can afford to subscribe to all or most of the journals that its researchers may need to use (Odlyzko 2006). As a consequence, all articles are currently losing some portion of their potential research impact (usage and citations), because they are not accessible online to all their potential users (Hitchcock 2010).
This is supported by recent evidence, independently confirmed by many studies, that articles whose authors have supplemented subscription-based access to the publisher’s version by self-archiving their own final draft to make it accessible free for all on the web (“Open Access”, OA) average twice as many citations as articles in the same journal and year that have not been made OA. This “OA Impact Advantage” has been found in all fields analyzed so far -- physical, technological, biological and social sciences, and humanities (Lawrence 2001; Brody & Harnad 2004; Hajjem et al. 2005; Moed 2005b; Eysenbach 2006; Giles et al. 1998; Kurtz & Brody, 2006; Norris et al. 2008; Evans 2008; Evans & Reimer 2009).
Hence OA is not just about public access rights or the general dissemination of knowledge: It is about increasing the impact and thereby the progress of research itself. A work’s research impact is an indication of how much it contributes to further research by other scientists and scholars -- how much it is used, applied and built upon (Brin & Page 1998; Garfield 1955, 1976, 1988; Page et al. 1999). That is also why impact is valued, measured and rewarded in researcher performance assessement as well as in research funding (Harnad 2009).
Self-archiving mandates
Only about 15-20% of the 2.5 million articles published annually worldwide are being self-archived by their authors today (Björk et al 2010; Hajjem and al., 2005). Creating an
Institutional Repository (IR) and encouraging faculty to self-archive their articles therein is a good first step, but that is not sufficient to raise the self-archiving rate appreciably above its current spontaneous self-selective baseline of 15-20% (Sale, 2006). Nor are mere requests or recommendations by researchers’ institutions or funders, encouraging them to self-archive, enough to raise this 20% figure appreciably, even when coupled with offers of help, rewards, incentives and even offers to do the deposit on the author’s behalf. In two international, multidisciplinary surveys, 95% of researchers reported that they would self-archive if (but only if) required to do so by their institutions or funders. (Eighty-one percent reported that, if it was required, they would deposit willingly; 14% said they would deposit reluctantly, and only 5% would not comply with the deposit requirement; Swan 2006.) Subsequent studies on actual mandate compliance have gone on to confirm that researchers do indeed do as they reported they would do, with mandated IRs generating deposit rates several times greater than the 20% self-selective baseline and well on the road toward 100% within about two years of adoption (Sale, 2006).
Universities' own IRs are the natural locus for the direct deposit of their own research output: Universities (and research institutions) are the universal providers of all research output, in all scientific and scholarly disciplines; they accordingly have a direct interest in
hosting, archiving, monitoring, measuring, managing, evaluating, and showcasing their own research output in their own IRs, as well as in maximizing its uptake, usage, and impact (Holmes & Oppenheim 2001; Oppenheim 1996). OA self-archiving mandates hence add visibility and value at both the individual and institutional level (Swan & Carr 2008).
In 2002, The University of Southampton’s School of Electronics & Computer Science (ECS) became the first in the world to adopt an official self-archiving mandate. Since then, a growing number of departments, faculties and institutions worldwide (including Harvard, Stanford, and MIT) as well as research funders (including all seven UK Research Funding Councils, the US National Institutes of Health, and the European Research Council) have likewise adopted OA self-archiving mandates. Over 150 mandates had already been adopted and registered and charted in ROARMAP1 as of summer 2010.
In 2008, mindful of the benefits of mandating OA, the council of the European Universities Association (EUA)2 unanimously recommended that all European Universities should create IRs and require all their research output to be deposited in them immediately upon publication (to be made OA as soon as possible thereafter). The EUA further recommended that these self-archiving mandates be extended to all research results arising from EU research project funding. A similar recommendation was made by EURAB (European Research Advisory Board). In the US, the FRPAA has proposed similar mandates for all research funded by the major US research funding agencies. Some studies, however, have suggested that the “OA Advantage” might just be a self-selection bias rather than a causal factor, with authors selectively tending to make higher-quality (hence more citable) articles OA (Craig et al. 2007; Davis & Fromerth 2007; Henneken et al 2006; Moed 2006). The present study was carried out to test this hypothesis by comparing self-selected OA with mandated OA on the basis of the research article output of the four institutions with the longest-standing OA mandates: (i) Southampton University (School of Electronics & Computer Science) in the UK (since 2002); (ii) CERN (European Organization for Nuclear Research) in Switzerland (since November, 2003); (iii) Queensland University of Technology in Australia (since February 2004); (iv) Minho University in Portugal (since December, 2004).
Method
The objective was to compare citation counts -- always within the same journal/year -- for OA (O) and non-OA (Ø) articles, comparing the O/Ø citation ratios for OA that was self-selected (S) vs. mandated (M). (The critical comparisons of interest were hence
1 ROARMAP (Registry of Open Access Repository Material Archiving Policies)
SO/Ø vs. MO/Ø.) The sample covered articles published between 2002 and 2006.3 The metadata for the articles were collected from the four institutional repositories, as well as from the Thomson-Reuters citation database.4
The effect of OA on citation impact cannot be reliably tested by comparing OA and non-OA journals because no two journals have identical subject matter, track-records and quality-standards (nor are there as yet enough established OA journals in most fields). The comparison must hence be between OA and non-OA articles published within the same (non-OA) journals (Harnad and Brody, 2004). For each Mandated article, Mi,
deposited in our four mandated IRs, we accordingly collected, as our pool of Nonmandated controls for comparison, with all the Nj articles being also published in the
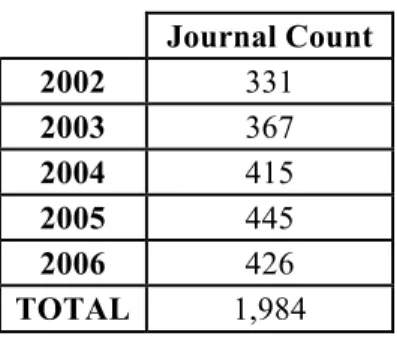
same journal, volume and year. Our sample of deposited articles from 2002 to 2006 was distributed across 1,984 non-OA journals in the Thomson-Reuters database (Table 1).5
Journal Count 2002 331 2003 367 2004 415 2005 445 2006 426 TOTAL 1,984
Table 1: Journal counts per year. Number of journals in our sample for each year tested.
To reduce our nonmandated comparison sample to a reasonable processing size, we restricted the number of journal/year-matched controls to the 10 Øj articles that were
semantically closest to their corresponding target Mi (as computed on the basis of shared
words in their titles, omitting stop words). This tightening of content similarity also made the control articles even more comparable to their targets than using the full spectrum of same-journal content. The total size of the article sample (6215 mandated targets plus their 20,982 corresponding controls6) from 2002 to 2006 was 27,197.
3 About two years need to elapse for the citations from the most recent year to stabilize. 4 Citation counts were extracted from the Thomson-Reuters database November, 2008.
5 Based on the Directory of Open Access Journals (DOAJ), 2% of journals indexed by Thomson-Reuters in
2006 were OA journals. Articles from these journals were removed from our pool because for them O/Ø comparisons were not possible.
6 When more than one M article was published in the same journal/volume/year (which represents 66% of
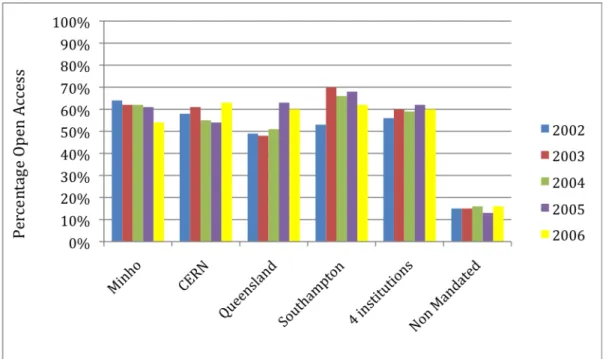
The full-text OA status of the articles in our sample was verified using an automated webwide search-robot (Hajjem and al. 2005) as well as an automated Google Scholar search. Figure 1 shows each of our four mandated institutions’ verified annual OA article deposits as a percentage of the institution’s total published article output for each year based (only) on those articles published in the journals indexed by the Thomson-Reuters citation database; the resulting estimate of the overall OA mandate compliance rate is about 60%. Note also the robot data’s confirmation of the approximately 15% baseline for spontaneous, self-selected (i.e., non-mandated) OA self-archiving among the control articles in the same journal/years.
Figure 1: Open Access (OA) Archiving Percentages for Institutions With
Self-Archiving Mandates Versus Non-Mandated, Self-Selected Controls: As estimated from the portion of their yearly published article output that is indexed by Thomson-Reuters, in this 2006 sample at least 60% of each of the four mandated institutions’ total yearly article output was self-archived and hence made OA, as mandated. The corresponding percentage OA among the control articles published in the same journal/year (but originating from other, presumably nonmandated institutions) was 15%, or close to the frequently reported global spontaneous baseline rate of about 15-20% for self-selected (nonmandated) self-archiving (Björk et al 2010). In other words, about 15% of these papers were self-selectively self-archived when it was not mandated, whereas at least 60% were self-archived when it was mandated.
This mandated deposit rate of 60% is substantially higher than the self-selected deposit rate of 15-20%. Of course, with anything short of 100% compliance it is always logically possible to hold onto the hypothesis that the OA citation advantage could be solely a
self-selection bias by arguing that, when self-archiving is mandated, what used to be a bias toward self-selectively self-archiving one’s more citable articles instead takes the form of a selective bias toward noncompliance with the mandate for one’s less citable articles. But in that case a reasonable expectation would be at least a substantial reduction in the size of the OA impact advantage with a mandated self-archiving rate four times as high as the spontaneous self-archiving rate, were it indeed true that the OA advantage was solely or largely due to self-selection bias.
To test whether mandated OA reduces the OA citation advantage, 4 kinds of articles need to be compared:
- O M : OA, Mandated, - Ø M : Non-OA, Mandated, - O S : OA, Self-Selected - Ø S : Non-OA, Self-Selected
The analysis uses the citation counts within each journal/year. Because the date on which the mandate was first adopted varies (from 2002 to 2004) for the four institutions, we analyzed the data for the four institutions jointly as well as individually. The individual analyses show the time-course of mandate compliance more clearly; the global analysis combines data, enlarges the sample size and smoothes out incidental effects of institutional and timing differences.
We compared the following ratios: O/Ø, OM/OS, OS/ØS, OM/ØM, OM/Ø, OS/Ø and OM/OS using their mean log citation ratios. For example, to compare mandated OA with self-selected OA, we computed the logarithm of the ratio OMj/OSj for each journal j and
then we computed the arithmetic mean of all the logarithms of those ratios for all journals. With OA/OS, there would be an advantage in favor of OM if the logarithm of the ratio was greater than zero, and in favor of OS otherwise.
∑
= = n j j j OS OM n OS OM 1 log 1 /The logarithm is used to normalize the data and to reduce any effect arising from articles that have relatively high citation counts, compared to the whole sample. The comparisons are all within-journal, to minimize between-journal differences in average citation levels (“journal impact factor”), and open access articles are keyword-matched to their non-open access controls in order to minimize differences still further.
Results
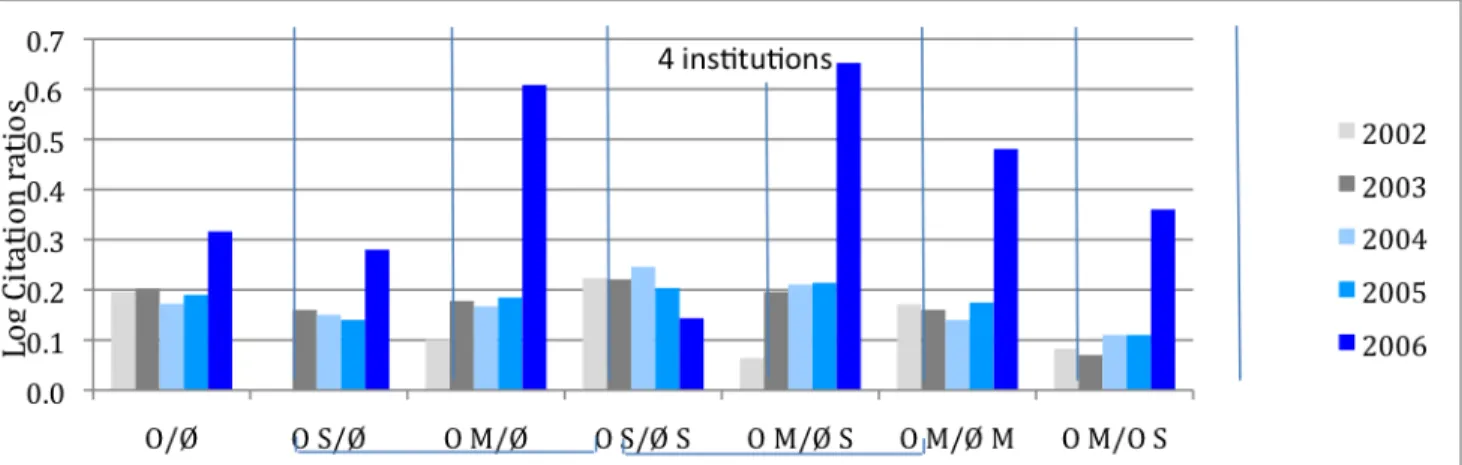
Overall, OA articles are cited significantly more than non-OA articles, confirming the repeatedly observed OA Advantage (O/Ø). There is also no evidence at all that mandated OA (OM) has a smaller citation advantage than self-selected OA (OS) (if anything, rather the contrary!). Figure 2 shows the results for the four institutions together. Appendix 1
shows each institution separately. The pattern for the individual institutional data is largely the same as for the average across the four institutions.
Figure 2: Log Citation Ratios Comparing the Yearly OA Impact Advantage for
Self-Selected vs Mandatory OA 2002-2006. O = OA article (Open Access); Ø = non-OA article (non-Open Access); M = Mandated OA; S = Self-Selected OA. Averages across the sample of four institutions with self-archiving mandates confirm the significantly higher citation counts for OA articles (symbolized here as “O”) compared to matched control non-OA articles (symbolized here as “Ø”) published in the same journal and year. They are compared as O/Ø log ratios in the seven comparisons. (The first comparison, O/Ø, for example, is the arithmetic mean of all the (log) ratios O/Ø for each of the 5 years.) OA articles are more highly cited irrespective of whether the OA is Self-Selected (S) or Mandated (M). The O/Ø Advantage is present for mandated OA (OM/ØS) and is of about the same magnitude irrespective of whether we compare the S ratios with the M ratios for the entire control sample (OS/Ø vs OM/Ø) or just compare S alone with M alone (OS/ØS vs OM/ØM).7 (The larger values for year 2006 are almost certainly due to the fact that 2006 was still too near to have stabilized at the time this analysis was conducted (2008-9); the analysis has since been extended for years 2006-2008, thereby stabilizing the data for 2006 and 2007, and yielded the same results, always with the exception of the most recent year, which was 2008 in the most recent analysis.)
7 The OA Advantage, far from shrinking when it is mandatory (compliance rate, 60%)
rather than self-selective (15%), is, according to this sample, if anything, slightly greater (OM/OS) (although this slight increase, being the smallest effect, might be due to chance or sampling error).
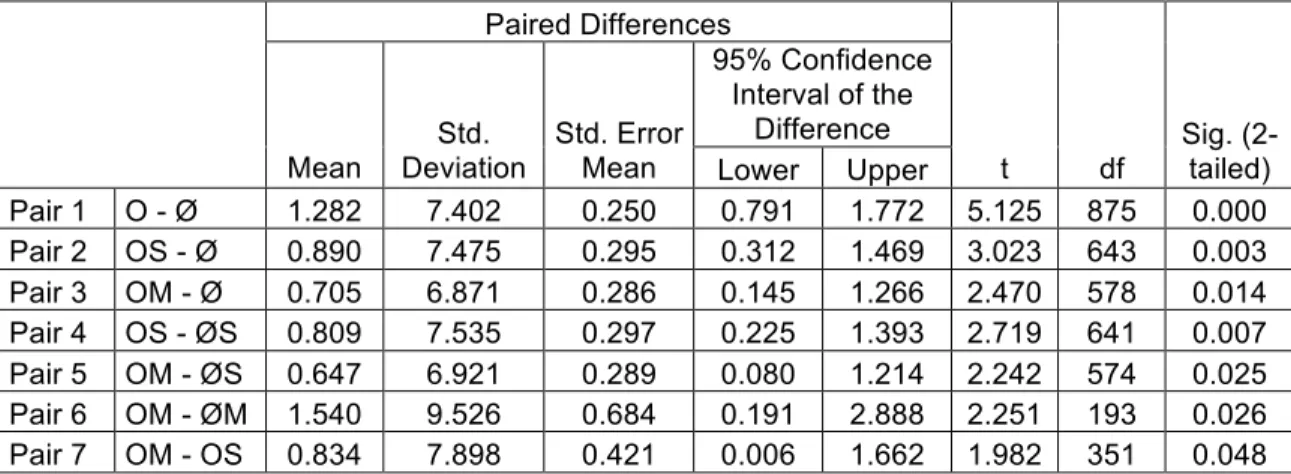
Paired Differences 95% Confidence Interval of the Difference Mean Std. Deviation Std. Error
Mean Lower Upper t df
Sig. (2-tailed) Pair 1 O - Ø 1.282 7.402 0.250 0.791 1.772 5.125 875 0.000 Pair 2 OS - Ø 0.890 7.475 0.295 0.312 1.469 3.023 643 0.003 Pair 3 OM - Ø 0.705 6.871 0.286 0.145 1.266 2.470 578 0.014 Pair 4 OS - ØS 0.809 7.535 0.297 0.225 1.393 2.719 641 0.007 Pair 5 OM - ØS 0.647 6.921 0.289 0.080 1.214 2.242 574 0.025 Pair 6 OM - ØM 1.540 9.526 0.684 0.191 2.888 2.251 193 0.026 Pair 7 OM - OS 0.834 7.898 0.421 0.006 1.662 1.982 351 0.048
Table 2: Paired Samples Test. Significance levels for the 2-tailed t-tests for the
differences graphed as log ratios in Figure 2, averaged across 2004-2006
(mandates began to be adopted in 2004). Open Access (O) vs. Non-Open Access (Ø); Mandated (M) vs. Self-Selected (S). The OA Advantage occurs irrespective of whether the OA is Self-Selected or Mandated.
For all OA vs Non-OA (O/Ø) comparisons, regardless of whether the OA was Self-Selected (S) or Mandated (M), the mean log citation differences are significantly greater than zero (based on correlated-sample t-tests for within-journal differences; Table 2). As the last of the four institutional mandates was adopted in 2004, the test was based on a sample of M and S articles published between 2004 and 20068. There is no detectable reduction in the size of the OA Advantage for Mandated OA (60%) compared to
Self- Self- Self- Self- Self- Self- Self- Self- Self- Self- Self- Self- Self- Self- Self- Self- Self- Self- Self- Self- Self- Self- Self- Self- Self- Self- Self- Self- Self- Self- Self- Self- Self- Self- Self- Self- Self- Self- Self- Self- Self- Self- Self- Self- Self- Self- Self- Self- Self- Self- Self- Self- Self- Self- Self- Self- Self- Self- Self- Self- Self-
8 The greater OA Advantage for 2006 might be due to a variety of factors that will be analyzed in future
more detailed studies over a longer time base (and taking deposit date into account, alongside publication date and the date at which citations are counted):
(a) These results were analyzed in 2009, and 2006 was the most recent full year analyzed. If the results for a year are analyzed before at least 1.5 years have elapsed, citations are still incomplete, the data are unstable, and the OA Advantage may not yet be detectable.
(b) Some of the compliance rates for 2002-2006 may have been retroactive, with the older articles deposited several years after they were published. That would mean that older articles were not receiving their full OA Advantage (and the finding of an Early Access Advantage by Kurtz et al 2005 and Kurtz & Henneken 2007 suggests that later deposits may never gain all the citations they would have received if deposited earlier). The mandates were adopted between 2003 and 2005. So perhaps only 2006 was receiving its full OA Advantage.
(c) Citations grow with article age but our multiple regression analyses also reveal an OA*Age interaction, with the OA Advantage growing faster than article age. Hence the OA Advantage becomes bigger for older articles, when measured independently, with other variables that increase citations (such as age, journal impact factor, number of co-authors) partialled out.
(d) In contrast to (c), however, it is also possible that as global OA is growing, global OA use is rising, which would mean that the OA Advantage itself is growing; this too could help explain the higher Advantage for the most recent year in our current sample (2006).
Selected OA (15%).9 It would require a very complicated argument indeed (“self-selective noncompliance for less citable articles”) to resurrect the hypothesis that the OA Advantage is only or mostly a self-selection bias in the face of these findings. (Such an argument does remain a logical possibility until there is 100% mandate compliance, but an increasingly implausible one).
Logistic regression
The number of citations an article receives can be correlated with and hence influenced by a variety of variables. Those variables, in turn, could create another kind of bias. For example, older articles tend to have more citations than younger articles simply because there has been more time to cite them. If OA articles tended to be older than non-OA articles, then article age, rather than OA, could be the cause of the OA Advantage. A way to test whether correlates of citation other than OA are responsible for the OA Advantage is to perform a multiple logistic regression analysis to see whether OA alone is still significantly correlated with higher citations when the correlation with other variables has been “factored out.”
In ordinary multiple regression analysis, there might be, say, three "Predictor" variables used to predict a 4th "Target" variable. For example, in weather forecasting, each of (P1) temperature, (P2) pressure, and (P3) humidity is individually correlated with, and hence predictive of (T) rain. These three pairwise correlations are each examples of simple regression. The prediction is much better, however, if we use all three predictors jointly. This is called multiple regression. It gives each of the predictors a "weight" (ß) that estimates how much it contributes independently to predicting rain, with the other 2 predictors factored out. Multiple regression analysis works if the variables are continuous (like temperature) and normally distributed (i.e., bell-curve-shaped). But if the variables are discrete or not normally distributed, a variant analysis called logistic regression is used in which the variables are subdivided above and below a cut-off point, and various different models, with different cut-off points, are tested to see which ones predict the target variable the best in each range. We use this variant analysis, because our variables are not all continuous or normally distributed. The logistic regression weights (Exp(ß)) are estimates of the size of the individual contributions of each of our predictor variables to our target variable (citations).
[In Table 3 -- and in all the other Tables displaying the Exp(ß) weights for our logistic regressions -- the relative size of the Exp(ß) weight for each of our 15 predictor variables (in each of our models, which vary in their ranges and cut-off points) estimates how much (and in what direction) each predictor contributes to predicting the target (citations); statistically significant contributions are in boldface. To visualize the size and the direction of the independent contributions of our predictors, each Table has a corresponding Figure, showing the contributions as color-coded bars.]
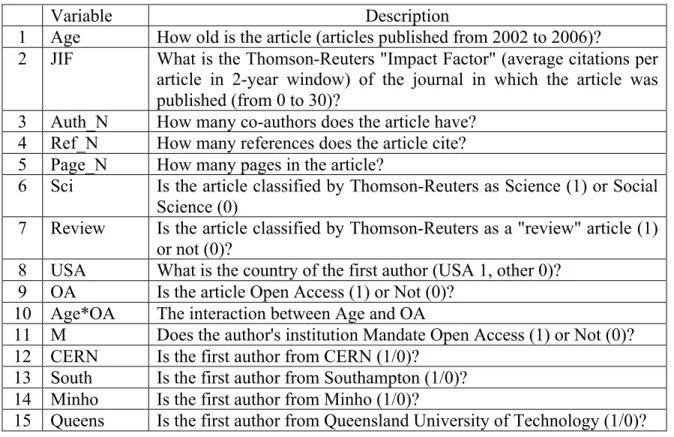
We have accordingly analyzed the following set of variables potentially influencing citations. Variables 1-8 are known to be correlated with citation counts. Variable 9 is OA itself; and variable 10 is a measure of the degree to which the relation between OA and Age is non-additive. Variable 11 indicates whether or not the OA is mandated. Variables 12-15 are just the four mandating institutions that are our reference points in this study.
Variable Description
1 Age How old is the article (articles published from 2002 to 2006)?
2 JIF What is the Thomson-Reuters "Impact Factor" (average citations per article in 2-year window) of the journal in which the article was published (from 0 to 30)?
3 Auth_N How many co-authors does the article have? 4 Ref_N How many references does the article cite? 5 Page_N How many pages in the article?
6 Sci Is the article classified by Thomson-Reuters as Science (1) or Social Science (0)
7 Review Is the article classified by Thomson-Reuters as a "review" article (1) or not (0)?
8 USA What is the country of the first author (USA 1, other 0)? 9 OA Is the article Open Access (1) or Not (0)?
10 Age*OA The interaction between Age and OA
11 M Does the author's institution Mandate Open Access (1) or Not (0)? 12 CERN Is the first author from CERN (1/0)?
13 South Is the first author from Southampton (1/0)? 14 Minho Is the first author from Minho (1/0)?
15 Queens Is the first author from Queensland University of Technology (1/0)? Table 3: Set of fourteen variables (plus one interaction) potentially influencing citation counts
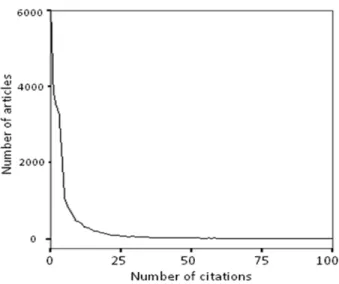
Figure 3: Distribution of citation counts (minus self-citations) for articles.
Citation counts are not normally distributed. Of our sample of 27,197 articles, 23% had zero citations; 51% had 1-5 citations; 12% had 6-10 citations; 8% had 11-20 citations; and 6% had 20+ citations. It is for this reason that a logistic analysis rather than an ordinary regression analysis was conducted. (Cf. Figure 6, which presents the distribution of average Journal Impact Factors -- which are, roughly, average citation counts -- for journals.)
All self-citations were subtracted from the citation counts. (About 32% of the articles in our sample have at least 1 self-citation, with an average of about 2 self-citations per article.) As is well-known, and evident from Figure 3, citation counts are not normally distributed and instead follow a power-law or stretched-exponential function (Larivière et al. 2009; Wallace et al. 2009). We accordingly used binary stepwise logistic regression analysis, with a dichotomous dependent variable, selecting for each test the model that maximizes the chi-square likelihood ratio. To make the interpretation of the coefficients easier, we exponentiated the ß coefficients (Exp(ß)) and interpreted them as odds-ratios (minus 1, to highlight the polarity of any change). For example, we can say for the second model (M2) that for a one unit increase in OA, the odds of receiving 5-9 citations (versus 1-4 citations) increased by +.323 (i.e., a factor of 1.323). Table 4 and Figure 4 show (Exp(ß)-1) values for each model with "x-y cites vs. y-z cites" as dependent variables ((x,y,x) ∈ {1, 2, 3, ..., 20}), assigning 1 if the citation count (minus self-citations) is between y and z and 0 if it is between x and y. The four models are compare citation ranges (M1) zero vs. lo (1-4); (M2) lo (1-4) vs. med-lo (5-9); M3 lo (1-4) vs. med-hi (10-19); M4 lo (1-4) vs. hi (20+). (The Exp(ß) values of variables turned out to have the same polarity and to be quite similar in magnitude, whether or not self-citations are substracted.)
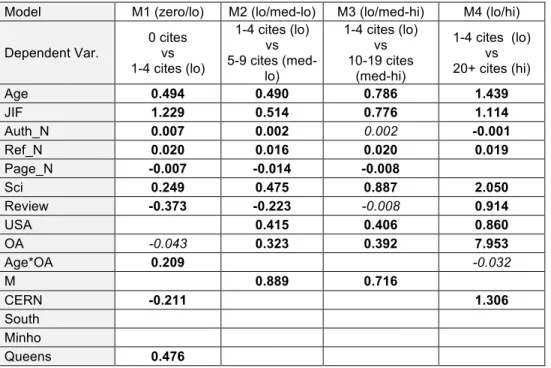
Model M1 (zero/lo) M2 (lo/med-lo) M3 (lo/med-hi) M4 (lo/hi) Dependent Var. 0 cites vs 1-4 cites (lo) 1-4 cites (lo) vs 5-9 cites (med-lo) 1-4 cites (lo) vs 10-19 cites (med-hi) 1-4 cites (lo) vs 20+ cites (hi) Age 0.494 0.490 0.786 1.439 JIF 1.229 0.514 0.776 1.114 Auth_N 0.007 0.002 0.002 -0.001 Ref_N 0.020 0.016 0.020 0.019 Page_N -0.007 -0.014 -0.008 Sci 0.249 0.475 0.887 2.050 Review -0.373 -0.223 -0.008 0.914 USA 0.415 0.406 0.860 OA -0.043 0.323 0.392 7.953 Age*OA 0.209 -0.032 M 0.889 0.716 CERN -0.211 1.306 South Minho Queens 0.476
Table 4: The (Exp(ß)-1) values for logistic regressions 14 predictor variables (plus one interaction variable) were used to predict the target variable (citation counts): (1) article age (Age), (2) journal impact factor (JIF), (3) number of co-authors (Auth_N), (4) number of references cited (Ref_N) , (5) number of pages (Page_N), (6) Science vs. Social Science (Sci), (7) Review article vs. ordinary article (Review), (8) US co-author vs. no US co-author (USA), (9) open access vs not (OA), (10) non-additive interaction between OA and Age (Age*OA), (11) OA mandated vs. not (M), (12) mandating institution CERN (CERN), (13) mandating institution Southampton ECS (South), (14) mandating institution U. Minho (Minho), (15) mandating institution Queensland U. Technology (Queens). Four logistic regression models estimated the size of the independent contribution of each of the 15 predictor variables to predicting the citation counts using four different cut-off values and comparison ranges (selected on the basis of the overall citation count distribution in Figure 3): (M1) articles with 0 vs lo (1-4 ) citations; (M2) lo (1-4 ) vs. med-lo (5-10) citations; (M3) lo (1-4 ) vs. med-hi (10-19) citations; (M4) lo (1-4 ) vs. hi (20+) citations. Note that OA is a significant independent contributor to citations in all but the lowest of these four citation ranges. The effect is displayed as a bar graph in Figure 4. (Boldface values for Exp(ß) indicate differences significant at p<0.01 and italic values indicate
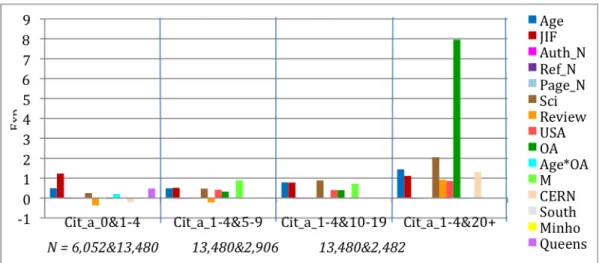
Figure 4: Exp(ß)-1 values for logistic regressions. These comparisons are based
on 4 models, each analyzing a different comparison range. For each comparison (e.g., 1-4 citations (lo) vs. 5-9 citations (med-lo)) an article is assigned zero if its citation count is in the lower of the two ranges and one if it is in the upper range. Then the model assigns the best fitting weights to each of the fifteen predictor variables in their joint prediction of the citation counts. The weights are proportional to the independent contribution of each variable. (Only statistically significant weights are shown.) In most of the four citation range comparisons (zero/lo, lo/med-lo, low/med-hi, lo/hi), citation counts are positively correlated with Age, Journal Impact Factor, Number of Authors, Number of References, Number of Pages, Science, Review, USA Author, OA, and Mandatedness. There is also a significant OA*Age interaction in the top and bottom range. (Citations grow with time; for age-matched articles, the OA Advantage grows even faster with time; Figure 5). OA is a significant independent contributor in three of the four models and their citation ranges, especially in the the lo/hi comparison.
Figure 4 shows that citations are, as is already well-known, positively correlated with the
first eight variables listed earlier (Age, Journal Impact Factor, Authors, References, Pages, Science, Review10, USA) -- as well as with OA. Articles that are made OA have significantly higher citation counts. In this analysis the significant OA advantage is independent of the other variable; it is present in every citation range but highest in the highest citation range (1-4 citations vs 20+ citations): In other words, the OA advantage is strongest for highly cited articles.
In our sample, articles by authors at the mandated institutions have higher than average
10 The classification as ‘Review’ is derived from the Thomson-‐Reuters database, which uses number of
references cited as its main criterion for classifying an articles as a Review. As the number of references cited is another one of our predictor variables, there was probably some confounding of these two non-‐ independent factors in our analysis. Citations came out as negatively correlated with the Review variable for the low-‐medium citation ranges in our analysis, so it was eliminated in further analyses.
citation counts; this effect is present only in the medium-high citation ranges (and is of course also influenced by the level of author compliance with the institutional Mandate, discussed further below). CERN articles have higher citation counts in the lowest and especially the highest citation range. However, when all CERN articles are excluded from our sample, there is no significant change in the other variables.
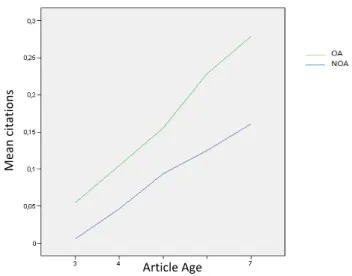
There is a significant interaction between Age and OA (Age*OA) for the lowest citation range comparison, zero/lo (0 vs. 1-4 citations) as well for the highest comparison, lo/hi (1-4 citations vs. 20 citations and more). Both the linear main effect of age and OA, and this nonlinear interaction are statistically significant. Figure 5 illustrates the Age*OA interaction effect for the lo/hi range comparison using the means for OA and Non-OA citation counts for each article age. The pattern again confirms the OA advantage but also shows that in the lo/hi comparison range the advantage increases more for older articles, over and above what would be expected from age alone.
Figure 5: Interaction between OA and article age. Over and above the sum of
the independent positive effects on citations of OA alone and of age alone, the size of this OA Advantage increases as articles get older,. The interaction is illustrated here for the lo/hi (1-4/20+) citation range comparison (model M4) for articles that were from 3 years old (2006) to 7 years old (2002). (The comparison was made in 2009.)
Logistic regression by Impact Factor interval:
In order to compare articles published in comparable journals and to see the profile for journals in increasing impact ranges (see distribution, Figure 6), we divided our sample into 4 quartiles in terms of Journal Impact Factor (JIF), each range covering 25% of the
Article Age Me an c ita tio ns
articles:
JIF1 : 0 ≤ JIF < 0.63 JIF2 : 0.63 ≤ JIF < 1.05 JIF3 : 1.05 ≤ JIF < 1.78 JIF4 : 1.78 ≤ JIF < 29.96
Only the top quartile contains journals with JIFs from 1.78 to 29.96. As we are also interested in the variability within this top quartile, we further subdivided it into two octiles, each covering 12.5% of the articles. (Subdividing more minutely would make the sample sizes too small to detect effects of interest.) This yielded a total of five ranges for the JIF variable:
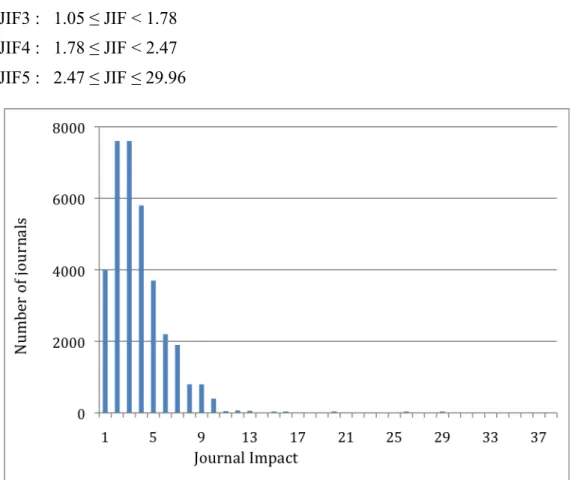
JIF1 : 0 ≤ JIF < 0.63 JIF2 : 0.63 ≤ JIF < 1.05 JIF3 : 1.05 ≤ JIF < 1.78 JIF4 : 1.78 ≤ JIF < 2.47 JIF5 : 2.47 ≤ JIF ≤ 29.96
distribution of individual article citation counts (Figure 3), the distribution of journal impact factors (average citation counts) is highly skewed. Most journal JIFs fall between 0 and 5,with the peak between 2 and 3, followed by a long rapidly shrinking tail, tail with very few journals having a JIF greater than 10.
The same regression is done separately for each JIF range by controlling all the variables (except JIF). Figures 7-11 (and Appendix 2: Tables 5-9) summarize the values of
Exp(ß)-1 corresponding to the controlled variables for each JIF range11.
When articles are published in a low JIF journal, citation counts for their individual articles are positively correlated with Age, References, Authors, OA and M. The OA advantage is greater in the higher citation ranges. For the lowest range of individual article citations, the Age*OA interaction is significant, but OA itself is not.
Figure 7: Exp(ß)-1 values for logistic regressions (Lowest JIF Range:
0.0-.0.63). (See Figure 4 for explanation of analysis and interpretation.) In this lowest range of journal impact factors, the biggest factor contributing to citation in all citation range comparisons is article age. OA is an important contributor in the two upper range comparisons.
For articles in journals with JIFs between 0.63 and 1.05, the pattern is quite similar, except that the Age*OA interaction is absent and OA itself (alongside Age, as separate variables) is significant.
11 As noted earlier, our Exp(ß) values for these variables exhibit the same polarity and pattern whether or
Figure 8: Exp(ß)-1 values for logistic regressions (JIF range 0.63-1.05) (See
Figure 4 for explanation of analysis and interpretation.) In the second lowest JIF range, article age continues to be the main factor in all four citation ranges, with OA emerging and growing in the top three.
For articles in journals with JIFs between 1.05 and 1.78, the pattern is again quite similar. The USA and Review variables now also correlate with citation increase.
Figure 9: Exp(ß)-1 values for logistic regressions (JIF range 1.05-1.78) (See Figure 4 for explanation of analysis and interpretation.) In this middle range of journal JIFs, article age continues to be influential, and OA is a significant factor in three of the four citation ranges.
For journals with JIFs between 1.78 and 2.47, longer articles (more pages) have more citations. Here the OA advantage is significant only in the highest citation count ranges. The number of authors is also less correlated with increased citations as the citation range gets higher. CERN and QUT have a citation advantage in this JIF range. However, removing the articles from these institutions does not alter the pattern for the other variables.
Figure 10: Exp(ß)-1 values for logistic regressions (JIF range 1.78-2.47) (See Figure 4 for explanation of analysis and interpretation.) In this next-to-highest JIF range, OA has its effect only in the top range (lo/hi).
For journals with JIFs between 2.47 and 29.96. The OA advantage is again significant for the highest citation ranges. (The increased citations for USA and Review articles also increase in significance). In this JIF range, CERN has a citation advantage in medium-high citations ranges. Removing the articles from this institution, however, does not change the pattern for the other variables.
Figure 11: Exp(ß)-1 values for logistic regressions (JIF 2.47-29.96) (See Figure
4 for explanation of analysis and interpretation.) In this, the highest JIF range, article age again increases citations in all ranges, whereas OA again has its effect only in the top range (lo/hi) (Note the anomalous effect of the “Review” variable; this is probably because it is confounded with the Reference count variable; when Review was removed in further analyses, the patterm of the other variables, and in particular OA, was unchanged.)
Overall, OA is correlated with a significant citation advantage for all journal JIF intervals as well as for the sample as a whole. This advantage is greatest for the highest citation ranges. When regressions are done separately for the different JIF ranges, the Age*OA interaction disappears, but OA and Age (as separate variables) remain significant. (There is no significant effect of a specific institution compared to the rest of the institutions, hence there is no need to exclude any specific institution from our sample.)
Discussion
This study confirms that the OA advantage is a statistically significant, independent positive increase in citations, even when we control the independent contributions of many other salient variables (article age, journal impact factor, number of authors, number of pages, number of references cited, Review, Science, USA author). All these other variables are of course correlated with citation counts, so the fact that OA continues to correlate with an independent positive increase in citation counts even when all these other correlates are partialled out is quite a strong outcome. It means that the OA Advantage is not just a bias arising from either a random or a systematic imbalance in the other correlates of citations.
Moreover, the OA advantage is just as great when the OA is mandated (with mandate compliance rate ~60%) as when it is self-selective (self-selection rate ~15%). That makes it highly unlikely that the OA advantage is either entirely or mostly the result of an author bias toward selectively self-archiving higher quality – hence higher citability – articles. Nor are the main effects the result of institutional citation advantages, as the institutions were among the independent predictor variables partialled out in the logistic regression; the outcome pattern and significance is also unaltered by removing CERN, the only one of the four institutions that might conceivably have biased the outcome because its papers were all in one field and tended to be of higher quality, hence higher citability overall.
Since, with the exception of our one unidisciplinary institute, CERN (high energy physics), the pluridisciplinary articles from the three other mandated institutional repositories are mostly not in fields that habitually self-archive their unrefereed preprints well before publication (as many in high energy physics do), nor in fields that already have effective OA for their published postprints (as astronomy does: Henneken et al 2006, 2008; Kurtz & Brody 2006), it is also unlikely that the OA advantage is either entirely or mostly just an early (prepublication) access advantage (Kurtz et al 2005; Kurtz & Henneken 2007). This will eventually be testable once there are enough reliable data available on deposit-date, relative to publication-date, for a large enough body of
self-archived OA articles. In any case, an early-access advantage in a preprint self-archiving field translates into a generic postpublication OA advantage in that vast majority of fields in which authors do not self-archive their prepublication preprints and hence their published postprints are accessible only to subscribers – except if they have also been self-archived. The OA mandates all apply only to refereed postprints, self-archived upon publication, not to pre-refereeing preprints, self-archived before publication.
This study confirms that the OA advantage is substantially greater for articles that have successfully met the quality standards of higher-impact journals and it is also greater in the higher-citation ranges for individual papers within each journal-impact level. The typical Pareto distribution for citations whereby the top 10-20% of articles receive about 80-90% of all citations Seglen (1992), is present in our own sample of 708,219 articles extracted from Thomson-Reuters from 1998 to 2007: about 20% of articles received about 80% of all citations. In addition, 10% of journals receive 90% of all citations. The implication is that OA itself will not make an unusable (hence uncitable) paper more used and cited (although the proportion of uncited papers has been diminishing with time; Wallace et al. 2009). But wherever there are subscription-based constraints on accessibility, providing OA will increase the usage and citation of the more usable and citable papers, probably in proportion to their importance and quality, hence citability. The most likely cause of the OA citation advantage is accordingly not author
self-selection toward making more citable articles OA, but user self-self-selection toward using
and citing the more citable articles – once OA self-archiving has made them accessible to all users, rather than just to those whose institutions could afford subscription access. In other words, the OA advantage is a quality advantage, rather than a quality bias: it is not that the higher quality articles – the ones that are more likely to be selectively cited anyway -- are more likely to be made OA self-selectively by their authors, but that the higher quality articles that are more likely to be selectively cited are made more accessible, hence more citable, by being made OA.
Our results also suggest that mandated OA might have some further independent citation advantage of its own, over self-selected OA -- but until and unless it is replicated, it is more likely that this small, previously unreported effect was due to chance or sampling error. If there does indeed prove to be an independent “mandate advantage” over and above OA itself, a possible interpretation would be the reverse of the self-selection hypothesis: There may be a higher proportion of higher-quality work among the 80% that are not being made OA on a self-selective basis today than among the 20% that are; so the OA mandates serve to help bring this “cream of science” to the top.
It also needs to be noted that some of the factors contributing to the OA advantage are permanent, whereas others will shrink as OA rises from its current 15-20% level and will
disappear completely at 100% OA. All competitive advantage of OA over non-OA (because OA is more accessible) will of course vanish at 100% OA (as will the possibility of concurrent measurement of the OA Advantage). Any self-selective bias (whether positive or negative) will likewise disappear at 100% OA. What will remain will be the quality advantage itself (the tendency of researchers to selectively use and cite the best research, if they can access it), but maximized by levelling the playing field, making everything accessible to every user online.
There will continue to be the early-access advantage in fast turnaround fields: It is not that making findings accessible earlier merely gets them their citation “quota” earlier; it significantly increases that quota, probably by both accelerating and broadening their uptake in further research (Kutz et al. 2005). And even after the competitive advantage is gone because all articles are OA, the download advantage will continue to be enjoyed by all articles (Bollen et al 2009; Davis et al. 2008) (thereby potentially influencing research even where it does not generate citations), while the quality advantage will see to it that for the best work, increased downloads are translated into uptake, usage and eventual increased citations. (Earlier download increases have been found to be correlated with, hence predictive of, later citation increases; Brody et al. 2006.)
Summary and Conclusion
The assumption that increasing access to research will increase its usage and impact is the main rationale for the worldwide OA movement. Many prior studies have by now shown across all fields that those journal articles whose authors have made them Open Access by self-archiving them online, freely accessible to all potential users, are cited significantly more than articles that are accessible only to subscribers. There is prior evidence for a self-selection bias toward the preferential self-archiving of higher quality articles in a few special fields (such as astronomy and some areas of physics) where most articles are made OA in unrefereed preprint form long before they are refereed and published, and where the published version is effectively accessible to all potential users as soon as it is published. Authors may indeed be more reluctant to make the preprints of papers about which they have doubts OA before they are refereed (Kurtz et al. 2005; Moed 2006). But we have now shown that for most other fields (i) the OA Advantage remains just as high for mandatory self-archiving as for self-selected self-archiving and that (ii) this is not an artifact of systematic biases in other correlates of citation counts. Both the self-archiving and the mandates apply to refereed postprints, upon acceptance for publication, not to unrefereed preprints.
Hence the OA Advantage is real, independent and causal. It is indeed true that the size of the advantage is correlated with quality, just as citations themselves are correlated with
quality (the top 20% of articles receiving about 80% of all citations); but what that means is that the OA advantage is higher for the more citable articles, not because of a quality bias from author self-selection but because of a quality advantage of the more citable articles that OA enhances by maximizing accessibility, and thereby also citability. On a playing field leveled by OA, users can selectively access, use and cite those articles that they judge to be of the highest relevance and quality, no longer constrained by their accessibility.
Overall, only about 15-20% of articles are being spontaneously archived today, self-selectively. To reach 100% OA globally, researchers' institutions and funders need to mandate self-archiving, as they are now increasingly beginning to do. We hope that this demonstration that the OA Impact Advantage is real and causal will provide further incentive and impetus for the adoption of OA mandates worldwide in order to ensure that research can at last achieve its full impact potential, no longer constrained by today’s needless limits on its accessibility to its intended users (Brody et al. 2007; Bernius & Hanauske 2009; Carr & Harnad 2009; Dror & Harnad 2009).
To measure that maximized research impact, we and others are already developing new OA metrics for monitoring, analyzing, evaluating, crediting and rewarding research productivity and progress (Adler & Harzing 2009; Bollen et al 2009; Brody 2003; Brody et al 2006; Cronin 1984; Cronin & Meho 2006; De Bellis 2009; De Robbio 2009; Diamond 1986; Harzing 2008; Harnad 2009; Jacso 2006; Moed 2005a). Hence there is no need to have any penalties or sanctions for non-compliance with OA self-archiving mandates. As the experience of Southampton ECS, Minho, QUT and CERN has already demonstrated, OA mandates, together with OA’s own rewards (enhanced research access, usage and impact), will be enough to establish the causal connection between providing access and reaping its impact, through the research community’s existing system for evaluating and rewarding research productivity. In the online era, researchers’ own “mandate” will no longer just be “publish-or-perish” but “self-archive to flourish.”
References
Adler, N.; Harzing, A.W.K. (2009) When Knowledge Wins: Transcending the sense and nonsense of academic rankings, The Academy of Management Learning & Education, v8(1) 72-95.
Bernius S & Hanauske M (2009), Open Access to Scientific Literature - Increasing Citations as an Incentive for Authors to Make Their Publications Freely Accessible, Frankfurt University, publications 2009, in 42nd Hawaii International Conference on
Björk B-C, Welling P, Laakso M, Majlender P, Hedlund T, et al. (2010) Open Access to the Scientific Journal Literature: Situation 2009. PLoS ONE 5(6): e11273. doi:10.1371/journal.pone.0011273
Bollen J, Van de Sompel H, Hagberg A & Chute R (2009) A Principal Component Analysis of 39 Scientific Impact Measures. PLoS ONE 4(6) e6022.
Brin, S & Page L (1998) The Anatomy of a Large-Scale Hypertextual Web Search Engine. Computer Networks and ISDN Systems 30: 107-117
Brody, T. (2003) Citebase Search: Autonomous Citation Database for e-Print Archives.
ECS Technical Report, University of Southampton.
Brody, T., Carr, L., Gingras, Y., Hajjem, C., Harnad, S. and Swan, A. (2007)
Incentivizing the Open Access Research Web: Publication-Archiving, Data-Archiving and Scientometrics. CTWatch Quarterly 3(3).
Brody, T., Harnad, S. and Carr, L. (2006) Earlier Web Usage Statistics as Predictors of Later Citation Impact. Journal of the American Association for Information Science and
Technology (JASIST) 57(8) 1060-1072.
Carr, L. and Harnad, S. (2009) Offloading Cognition onto the Web IEEE Intelligent
Systems 24 (6).
Craig, I. D., Plume, A. M., McVeigh, M. E., Pringle, J. Amin, M. (2007)
Do Open Access Articles Have Greater Citation Impact? A critical review of the literature Publishing Research Consortium, Journal of Informetrics, 1 (3): 239-248, July 2007
Cronin, B and Meho L. I. (2006). Using the h-index to rank influential information scientists. Journal of the American Society for Information Science and Technology 57(9), 1275-1278.
Cronin, B (1984) The citation process: the role and significance of citations in scientific
communication. London: Taylor
Davis, P. M. and Fromerth, M. J. (2007) Does the arXiv lead to higher citations and reduced publisher downloads for mathematics articles? Scientometrics 71 (2)
Davis, P.M., Lewenstein, B.V., Simon, D.H., Booth, J.G., Connolly, M.J.L.
(2008) Open access publishing, article downloads, and citations: randomised controlled trial British Medical Journal 337:a568
De Bellis, N (2009) Bibliometrics and Citation Analysis: From the Science Citation
Index to Cybermetrics. Scarecrow Press.
De Robbio, A. (2007) Analisi citazionale e indicatori bibliometrici nel modello Open Access, Bollettino AIB 47(2) 257-288
Diamond, Jr., A. M. (1986) What is a Citation Worth? Journal of Human Resources 21:200-15.
Dror, I. and Harnad, S. (2009) Offloading Cognition onto Cognitive Technology. In Dror, I. and Harnad, S. (Eds) (2009): Cognition Distributed: How Cognitive Technology
Extends Our Minds. Benjamins
Evans, J. A. (2008) Electronic Publication and the Narrowing of Science and Scholarship
Science 321(5887) 395-399
Evans, J. A. and Reimer, J. (2009) Open Access and Global Participation in Science
Science 323(5917) 1025
Eysenbach G. (2006) Citation Advantage of Open Access Articles. PLoS Biology 4(5). Garfield, E., (1955) Citation Indexes for Science: A New Dimension in Documentation through Association of Ideas. Science 122: 108-111
Garfield, E. (1973) Citation Frequency as a Measure of Research Activity and Performance in Essays of an Information Scientist, 1: 406-408, 1962-73, Current Contents, 5
Garfield, E. (1988) Can Researchers Bank on Citation Analysis? Current Comments 44. October 31, 1988
Giles, C.L. K. Bollacker, S. Lawrence (1998) CiteSeer: An Automatic Citation Indexing System 3rd ACM Conference on Digital Libraries: 89-98.
Hajjem, C., Harnad, S. and Gingras, Y. (2005) Ten-Year Cross-Disciplinary Comparison of the Growth of Open Access and How it Increases Research Citation Impact. IEEE
Data Engineering Bulletin 28(4) 39-47.
Harnad, S. (2009) Open Access Scientometrics and the UK Research Assessment Exercise. Scientometrics 79 (1)
Harnad, S. & Brody, T. (2004) Comparing the Impact of Open Access (OA) vs. Non-OA
Articles in the Same Journals, D-Lib Magazine 10 (6)
Harzing, A.W.K.; Wal, R. van der (2008) Google Scholar as a new source for citation analysis? Ethics in Science and Environmental Politics, vol. 8, no. 1, pp. 62-71.
Henneken, E. A., Kurtz, M. J., Accomazzi, A., Grant, C. S., Thomson, D., Bohlen, E. and Murray, S. S. (2008) Use of Astronomical Literature - A Report on Usage Patterns
Journal of Informetrics 3(1) 1-90 http://arxiv.org/abs/0808.0103
Henneken, E. A., Kurtz, M. J., Eichhorn, G., Accomazzi, A., Grant, C., Thomson, D., and Murray, S. S. (2006) Effect of E-printing on Citation Rates in Astronomy and Physics.
Journal of Electronic Publishing 9(2)
Hitchcock, S. (2010) The effect of open access and downloads ('hits') on citation impact: a bibliography of studies
Holmes A & Oppenheim C (2001) Use of citation analysis to predict the outcome of the 2001 Research Assessment Exercise for Unit of Assessment (UoA) Library and
Information Management 61.
Jacso, P (2006) Testing the Calculation of a Realistic h-index in Google Scholar, Scopus, and Web of Science for F. W. Lancaster. Library Trends 56(4) 784-815.
Kurtz, M. J., Eichhorn, G., Accomazzi, A., Grant, C. S., Demleitner, M., Murray, S. S. (2005) The Effect of Use and Access on Citations. Information Processing and
Management 41 (6) 1395-1402
Kurtz, M. & Brody, T. (2006) The impact loss to authors and research, in Jacobs,
Neil, Eds. Open Access: Key Strategic, Technical and Economic Aspects. Chandos Publishing (Oxford) Limited.
Kurtz, M. J. and Henneken, E. A. (2007) Open Access does not increase citations for research articles from The Astrophysical Journal
Lariviere, V; Y Gingras & E Archambault (2009) The decline in the concentration of citations, 1900-2007. JASIST 60(4) 858-862.
Lawrence, S. (2001) Free online availability substantially increases a paper's impact Nature 411:521
Moed, H. F. (2005a) Citation Analysis in Research Evaluation. NY Springer.
Moed, H. F. (2005b) Statistical Relationships Between Downloads and Citations at the Level of Individual Documents Within a Single Journal. Journal of the American Society
Moed, H. F. (2006) The effect of 'Open Access' upon citation impact: An analysis of ArXiv's Condensed Matter Section Journal of the American Society for Information
Science and Technology 58(13) 2145-2156
Norris, M., Oppenheim, C., & Rowland, F. (2008) The citation advantage of open-access articles
Journal of the American Society for Information Science and Technology 59(12)
1963-1972
Odlyzko, A. (2006) The economic costs of toll access, in Jacobs, Neil, Eds. Open Access:
Key Strategic, Technical and Economic Aspects. Chandos Publishing (Oxford) Limited.
Oppenheim, Charles (1996) Do citations count? Citation indexing and the research assessment exercise, Serials, 9:155-61
Page, L., Brin, S., Motwani, R., Winograd, T. (1999) The PageRank Citation Ranking: Bringing Order to the Web.
Sale, A. (2006) The acquisition of open access research articles. First Monday, 11(9), October 2006.
Seglen, PO (1992) The skewness of science. Journal of the American Society for
Information Science 43:628-38.
Swan, A. (2006) The culture of Open Access: researchers’ views and responses. In : Jacobs, N., Eds. Open Access: Key Strategic, Technical and Economic Aspects. Oxford : Chandos/ 52-59, 2006.
Swan, A. and Carr, L (2008). Institutions, their repositories and the Web. Serials Review 34 (1) 2008.
Wallace, ML, V Larivière, Gingras, (2009) Modeling a Century of Citation Distributions. Journal of Informetrics 3(4): 296-303
Appendix 1: OA Impact Advantage for each Institution
Figure 2 showed the mean log citation ratios for O/Ø, OM/OS, OS/ØS, OM/ØM, OM/Ø,
OS/Ø and OM/OS for the four institutions together. The outcome was that the Open Access (OA) citation advantage was present and roughly equal whether the OA was Self-Selective (S) or Mandated (M). That showed that the OA Advantage is not merely an artifact of author self-selection. This appendix shows the results for each institution separately. As will be evident, the pattern for the individual institutional data is largely the same as it is for the average across the four institutions.
Figure 12: OA Impact Advantage for Self-Selected vs Mandatory OA for Southampton
ECS. (Figure 12-15 are similar to Figure 2)
Figure 13: OA Impact Advantage for Self-Selected vs Mandatory OA for Queensland
Figure 14: OA Impact Advantage for Self-Selected vs Mandatory OA for Minho
Appendix 2: Multiple regression by JIF – Beta values
The multiple logistic regression we applied to our total sample of journals is applied here separately to the journals in each JIF (Journal Impact Factor) range by including all the other 14 predictor variables, apart from JIF itself. Tables 5-9 summarize the values of
Exp(ß)-1 corresponding to the predictor variables for each JIF range. The results were
discussed in Figures 6-11. In sum, they show that whereas citation counts grow with an article’s age across all the citation range comparisons for our four models (zero/low, low/medium1, low/medium2, low/high), OA’s contribution tends to be more on the high-citation end, being greater in the higher JIF range (JIF4-JIF5) among journals and in the low/high range comparisons (M4) among articles.
A. JIF1 (JIF < 0,63)
Model M1 (zero/lo) M2 (lo/med-lo) M3 (lo/med-hi) M4 (lo/hi)
Dependent Var. 0 cites vs 1-4 cites (lo) 1-4 cites (lo) vs 5-9 cites (med-lo) 1-4 cites (lo) vs 10-19 cites (med-hi) 1-4 cites (lo) vs 20+ cites (hi) Age 0.537 0.847 1.071 1.689 Auth_N 0.079 0.066 0.054 0.087 Ref_N 0.017 0.013 0.026 0.020 Page_N -0.038 Sci 2.214 Review 3.760 USA OA 0.533 1.406 Age*OA 0.093 0.059 M 0.881 0.902 CERN South Minho -0.299 Queens
Table 5: Exp(ß) values for logistic regressions for JIF1 B. JIF2 (0.63 <= JIF < 1.05)
Model M1 (zero/lo) M2 (lo/med-lo) M3 (lo/med-hi) M4 (lo/hi)
Dependent Var. 0 cites vs 1-4 cites (lo) 1-4 cites (lo) vs 5-9 cites (med-lo) 1-4 cites (lo) vs 10-19 cites (med-hi) 1-4 cites (lo) vs 20+ cites (hi) Age 0.407 0.548 0.869 1.117 Auth_N 0.028 0.007 Ref_N 0.016 0.012 0.018 0.011 Page_N Sci Review -0.395 2.106
USA OA 0.346 0.337 1.322 Age*OA M 0.265 0.963 0.722 CERN -0.489 South Minho Queens
Table 6: Exp(ß)-1 values for logistic regressions for JIF2 C. JIF3 (1.05 <= JIF < 1.74)
Model M1 (zero/lo) M2 (lo/med-lo) M3 (lo/med-hi) M4 (lo/hi)
Dependent Var. 0 cites vs
1-4 cites (lo) 1-4 cites (lo) vs 5-9 cites (med-lo) 1-4 cites (lo) vs 10-19 cites (med-hi) 1-4 cites (lo) vs 20+ cites (hi) Age 0.581 0.540 0.879 1.305 Auth_N 0.032 0.033 0.026 0.041 Ref_N 0.012 0.007 0.013 0.009 Page_N 0.026 Sci Review 0.939 USA 0.330 0.791 OA 0.236 0.263 0.449 Age*OA M 0.428 0.492 CERN -0.599 South 2.734 Minho Queens 0.856 0.382
Table 7: Exp(ß)-1 values for logistic regressions for JIF3 D. JIF4 (1.74 <= JIF < 2.47)
Model M1 (zero/lo) M2 (lo/med-lo) M3 (lo/med-hi) M4 (lo/hi)
Dependent Var. 0 cites vs 1-4 cites (lo) 1-4 cites (lo) vs 5-9 cites (med-lo) 1-4 cites (lo) vs 10-19 cites (med-hi) 1-4 cites (lo) vs 20+ cites (hi) Age 0.690 0.427 0.800 1.540 Auth_N -0.006 Ref_N 0.020 0.010 0.019 0.024 Page_N 0.028 Sci 1.090 Review USA 0.822 OA 0.747
Age*OA M 0.645 0.729 CERN -0.446 0.657 0.615 2.974 South -0.767 Minho Queens
Table 8: Exp(ß)-1 values for logistic regressions for JIF4
E. JIF5 (2.47 <= JIF < 29.96)
Model M1 (zero/lo) M2 (lo/med-lo) M3 (lo/med-hi) M4 (lo/hi)
Dependent Var. 0 cites vs
1-4 cites (lo) 1-4 cites (lo) vs 5-9 cites (med-lo) 1-4 cites (lo) vs 10-19 cites (med-hi) 1-4 cites (lo) vs 20+ cites (hi) Age 0.484 0.312 0.590 1.259 Auth_N -0.002 -0.005 Ref_N 0.016 0.010 0.007 0.009 Page_N -0.024 Sci 1.007 Review -0.818 -0.414 0.650 USA 0.391 0.360 0.635 OA 0.722 Age*OA M 0.468 CERN -0.554 South Minho Queens 0.751