To link to this article : DOI:10.1021/ja503449w
URL :
http://dx.doi.org/10.1021/ja503449w
This is an author-deposited version published in:
http://oatao.univ-toulouse.fr/
Eprints ID: 13901
To cite this version:
Tsai, Wan-Yu and Taberna, Pierre-Louis and Simon, Patrice Electrochemical
Quartz Crystal Microbalance (EQCM) Study of Ion Dynamics in Nanoporous
Carbons. (2014) Journal of the American Chemical Society, n° 136 (n° 24). pp.
8722-8728. ISSN 0002-7863
O
pen
A
rchive
T
oulouse
A
rchive
O
uverte (
OATAO
)
OATAO is an open access repository that collects the work of Toulouse researchers
and makes it freely available over the web where possible.
Any correspondence concerning this service should be sent to the repository
administrator:
[email protected]
Electrochemical Quartz Crystal Microbalance (EQCM) Study of Ion
Dynamics in Nanoporous Carbons
Wan-Yu Tsai,
†,‡Pierre-Louis Taberna,
†,‡and Patrice Simon*
,†,‡†Université Paul Sabatier, CIRIMAT UMR CNRS 5085, 118 route de Narbonne, 31062 Toulouse, France ‡Réseau sur le Stockage Electrochimique de l’Energie (RS2E), FR CNRS3459 80039 Amiens, France
ABSTRACT: Electrochemical quartz crystal microbalance (EQCM) and cyclic voltammetry (CV) measurements were used to characterize ion adsorption in carbide-derived carbon (CDC) with two different average pore sizes (1 and 0.65 nm), from neat and solvated 1-Ethyl-3-methylimidazolium bis(tri fluoromethane-sulfonyl)imide (EMI-TFSI) electrolytes. From the electrode mass change in neat EMI-TFSI, it was shown that one net charge stored corresponds almost to one single ion at high polarization; in that case, no ion-pairing or charge screening by co-ions were observed. In 2 M EMI-TFSI in acetonitrile electrolyte, experimental solvation numbers were estimated for EMI+cation, showing a partial desolvation when cations were adsorbed in confined carbon pores. The extent of desolvation increased when decreasing the carbon pore size (from 1 down to 0.65 nm). The results also suggest that EMI+ cation owns higher mobility than TFSI−anion in these electrolytes.
INTRODUCTION
In the past two decades, a lot of attention has been focused on electrochemical double layer capacitors (EDLCs), also known as supercapacitors, since they are one of the most promising electrochemical energy storage devices for high power delivery or energy harvesting applications.1−4 The charge storage mechanism in supercapacitor electrodes is achieved through electrostatic attraction between the ions of an electrolyte and the charges present at the electrode surface, leading to a charge separation at the electrolyte/electrode interface. Since no faradaic reaction is involved in the charge storage mechanism, supercapacitors hold higher power density (15 kW/kg) and much better cyclability (>106) compared to batteries.
Porous carbon materials have been widely used and studied for supercapacitor applications, owing to their good electro-chemical stability and abundance on earth.5−10An excitingfield of research emerged a few years ago when, using carbide-derived carbon (CDC) with fine-controlled pore size distribution, it was found that the capacitance increased dramatically when the carbon pore size was decreased below the solvated ion size,11suggesting as well that ions could lose a part of their solvation shell to access these confined nanopores. Following this study, numerous works have been devoted to understanding the origin of the anomalous increase in capacitance, and the physics of ion adsorption and ionic transport in confined nanoporous carbon.12−23 Among these works, ionic liquid electrolytes have been widely studied, since they are considered as a green alternative to the traditional volatile organic electrolytes due to their outstanding properties, such as being liquid salts at room temperature, low vapor pressure, and high thermal and electrochemical stability. By
testing CDCs with different pore sizes in neat 1-ethyl-3-methylimidazolium bis(trifluoromethanesulfonyl)imide (EMI-TFSI) ionic liquid electrolyte, it was found that the maximum capacitance was achieved when the carbon pore size was close to that of the adsorbing ions of the electrolyte.24Further study extended the experiments on CDCs in 2 M EMI-TFSI dissolved in acetonitrile (AN) to understand the solvation effect on the ion adsorption in porous carbons.25It was shown that cation and anion adsorption showed different electro-chemical signatures when decreasing the carbon pore size below 1 nm, originating from the different extent of solvation of the ions. However, owing to the lack of in situ techniques for studying the electrode/electrolyte interface during charging and discharging, lots of questions regarding how the charge is stored at the molecular scale in a confined environment remain unsolved: Does one net charge stored on the electrode correspond to one single ion adsorption? Since there is strong interaction between cations and anions in neat ionic liquids, do co-ions affect counterion adsorption? In solvent-containing electrolyte systems, how do solvents affect the charge storage? Do solvents screen the charge of the ions leading to a less efficient charge storage? Recent modeling studies started to address some of these concerns by showing for instance the existence of superionic state in confined pores,14 the importance of the role of the co-ions,15 the existence of oscillations of the capacitance with the carbon pore size,18or the fast ion transport in confined pores.20 Very recently, molecular dynamics simulations using a realistic CDC structure
in an ionic liquid-based electrolyte have shown that the presence of solvents (acetonitrile) enhances the accessibility of the ions to small pores.26 In such confined pores, the ion solvation shell contains from 2 to 4 solvent molecules, while 9 solvent molecules are present around the ions in the bulk of the electrolyte.
Recently, it has been reported by Levi et al. that electrochemical quartz crystal microbalance (EQCM) can serve as an in situ gravimetric probe for studying the concentration and compositional changes in porous materi-als.27−29 EQCM is composed with a thin piezoelectric quartz crystal sandwiched between two metal electrodes used to create an alternating electricfield across the crystal, causing vibrational motion of the crystal at its resonance frequency. This resonance frequency is sensitive to the mass onto the crystal. The shift of the quartz resonance frequency (Δf) can be converted into
mass change (Δm) on the quartz crystal and electrodes by applying Sauerbrey’s equation:
ρ μ Δm= − ·Δ = − · Δ f f C f 2 f q q o (1)
whereρqis the density of quartz (2.648 g/cm3),μqis the shear modulus of quartz (2.947× 10¹¹g/cm.s2), f
ois the fundamental resonance frequency of the quartz, and Cf is the calibration constant (or sensitivity factor).30By using one side of quartz as a working electrode in an electrochemical cell while simultaneously measuring the mass changes, one is able to monitor electrochemical processes that take place at the electrode surface, such as electrodepositing or electrosorption, in real time.31,32
EQCM being a powerful in situ technique to study the charge mechanism and the solvation effect at the electrode/
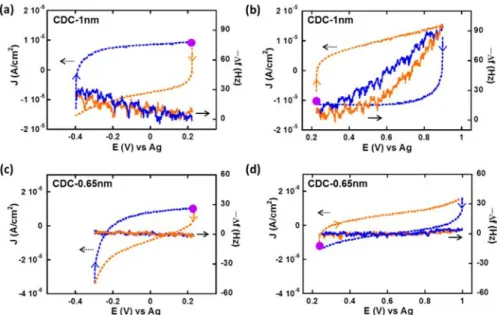
Figure 1.CV and EQCM frequency response of CDC-1 nm (a,b) and CDC-0.65 nm (c,d) in neat EMI-TFSI below (a,c) and above (b,d) immersion potential. The purple dot is where the cycle starts. Orange and blue curves indicate charge and discharge of ions, respectively.
Figure 2.CV and EQCM frequency response of CDC-1 nm (a,b) and CDC-0.65 nm (c,d) in 2 M EMI-TFSI/AN below (a,c) and above (b,d) the immersion potential. The purple dot is where the cycle starts. Orange and blue curves indicate charge and discharge of ions, respectively.
electrolyte interface, we used this technique to characterize, from the experimental point of view, the ion adsorption mechanism in confined pores. Neat EMI-TFSI ionic liquid and 2 M EMI-TFSI dissolved in acetonitrile (AN) with EQCM technique and microporous CDCs with large (1 nm) and small (0.65 nm) pore sizes have been used to study both the influence of the presence of solvent and the impact of the carbon pore size.
RESULTS AND DISCUSSION
Cyclic Voltammograms and Quartz Frequency Re-sponses. The cyclic voltammograms (CVs) and EQCM results of CDC-1 nm and CDC-0.65 nm tested at room temperature in neat and solvated EMI-TFSI are presented in Figures 1 and 2, respectively. For studying anion and cation contribution separately, results were collected in two different potential ranges in each experiment: starting from the open circuit voltage of first immersion of the quartz (noted as “immersion potential”) indicated with purple dots in all the figures, the potential was scanned negatively down to negative potential values (Figures 1a,c and 2a,c) or up to positive potential values (Figures 1b,d and 2b,d). In both Figures 1 and 2, CVs are presented in dashed lines and frequency responses are presented in solid lines, and the different colors indicate the ion charging (orange curves) and discharge (blue curves). According to Sauerbrey’s equation (eq 1), the frequency response (Δf) decreases when the electrode mass (Δm) increases. For visual convenience, negative frequency responses (−Δf), proportional to Δm, are shown in Figures 1 and 2. In all the tests, the electrochemical potential windows were found to be smaller than those previously reported using conventional CDCfilm electrodes (3 V for neat EMI-TFSI and 2.5 V for 2 M EMI-TFSI/AN).25 It is mainly due to the small amount of carbon deposited on the quartz (20−45 μg/cm2) compared to the carbon loading of conventional supercapacitors (about 10 mg/cm2), thus exalting the electrochemical activity of the electrolyte on the Au electrode at highly positive or negative potentials. The carbon loading on the quartz shown in this work was controlled between 35 to 45μg/cm2.
Figure 1 shows CVs and simultaneous EQCM response collected for the 1 nm pore size CDC sample below (Figure 1a) and above (Figure 1b) the immersion potential, in neat EMI-TFSI electrolyte. The calculated ion sizes in the longest dimension are 0.76 and 0.79 nm for the EMI+cation and TFSI− anion, respectively.24 Figure 1a,b exhibits a characteristic capacitive behavior with rectangular CV profiles, thus confirming a previous study25 conducted with the same samples showing that both cations and anions could freely access 1 nm pores. In Figure 1a, the potential scan is first started from the immersion potential (0.22 V) down to−0.4 V, and then swept back to 0.22 V. Figure 1a shows the simultaneous change of the opposite of the frequency (−Δf, proportional to the electrode weight increase) versus the potential (solid curves). In this potential range, the charge/ discharge of the double layer is considered to be mainly achieved by adsorption/desorption of the cations (EMI+, counterions), in a first approximation. The increase of the electrode mass observed during the negative scan is associated with cation adsorption, while during desorption (positive scan), the electrode mass decreases.
In Figure 1b, the potential scan was achieved from the immersion potential up to 0.9 V (vs ref), and then reversed back to the immersion potential; the quartz resonance
frequency response (−Δf) first increased and then decreased. Similarly, from Sauerbrey’s equation, the electrode mass increases during positive scan (charging) and decreases during negative scan (discharging); the weight change fits with the adsorption and desorption of TFSI− anions (counterions), which is assumed to be responsible of the charge balance at the carbon surface.
Figure 1c,d shows the results of the sample with a pore size of 0.65 nm (CDC-0.65 nm) tested in EMI-TFSI. Since the CDC pore size is smaller than both the cation and anion size, it is expected that the ions have limited access to the pores, as previously shown by Segalini et al.33Both CVs in Figure 1c,d show a slightly distorted rectangular signature, and the current is an order of magnitude lower than that of CDC-1 nm (Figure 1a and 1b). The EQCM frequency responses for both positive and negative polarizations exhibit almost no variation, meaning that no mass change on the quartz was observed upon cycling. Both CV and EQCM results are in agreement with the expectation that the pore size of 0.65 nm is too small for both the cation and anion to enter or leave freely.
The CVs and frequency responses of CDC-1 nm in solvated EMI-TFSI are presented in Figure 2a,b. Both CVs display capacitive behavior with a nice rectangular profile, showing free access of both the anions and the cations to the 1 nm-pore, without limitation. Regarding the frequency responses, a similar trend as in Figure 1 (CDC-1 nm in neat EMI-TFSI) is obtained: the electrode mass increases during cation/anion adsorption and decreases during cation/anion desorption.
The CVs of the CDC-0.65 nm pore size sample in solvated EMI-TFSI (Figure 2c,d) are both distorted; the current is smaller for anion adsorption/desorption processes (Figure 2d, positive polarization) than that of the cation one (Figure 2c, negative polarization). Furthermore, the quartz frequency response shows distinct difference between cation and anion adsorptions: while the electrode mass increases (respectively decreases) during cation adsorption (respectively desorption), there is almost no mass change in Figure 2d, suggesting that the adsorption of a small amount of TFSI− anionsneeded to balance the small chargeis coupled with desorption of acetonitrile molecules previouslyfilling the nanopores.
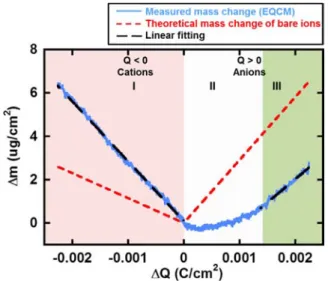
Mass Change vs Charge: Compositional Information. Figure 3 shows the change of the electrode weight vs the charge passed in the electrode during ion charging in the cyclic voltammetry, from the immersion potential down to−0.4 V/ ref (Figure 1a) or from immersion potential up to 0.9 V/ref (Figure 1b), for the CDC-1 nm in neat EMI-TFSI. The red dashed lines are related to the theoretical weight change vs charge, considering that only EMI+ or TFSI− is adsorbed for balancing the negative or positive charge, respectively, at the carbon surface. Starting from the immersion potential (ΔQ = 0), the electrode mass change increases steadily during negative polarization in neat EMI-TFSI in CDC-1 nm (Figure 3, domain I): there is a linear change of the electrode mass with the negative charge accumulated on the electrode (left branch). Both the mass change and the mean slope of the experimental plot (black dashed line) over the whole range of charge (ΔQ) are close to those of theoretical ones: 97 and 111 g/mol for the average molecular weight of the adsorbed species calculated from the experimental slope (explained in the Experimental Section) and for the molar weight of EMI+, respectively (Table 1). In domain I, the charge in the porous electrode occurs only through the adsorption of counterions (EMI+) and no co-ion (TFSI−) seems to be involved. Such behavior has been
previously reported and described by Levi et al.28,29 as perm-selective: only the adsorption of the counterion balanced the charge at the carbon electrode.
A different behavior is observed during anion adsorption (ΔQ > 0), where the electrode mass change slowly increases at positive charge less than 0.4 mC (domain II), before reaching a constant slope for chargeΔQ > 0.4 mC (domain III). In the linear part of domain III (ΔQ > 0.4 mC), the average molecular weight of the adsorbed species calculated from the experimental slope is 270 g/mol, close to that of the bare anions (280 g/mol for TFSI−). This strongly suggests that, far from the immersion potential, the charge storage mechanism mainly involves anion transfer in confined micropores. Differently, at small positive charge in domain II (ΔQ < 0.4 mC), the slope of the plot is less than the theoretical line corresponding to the bare anion adsorption (red dashed line), suggesting that TFSI− anion transfer is not the only process involved during the charge. This behavior was already reported by Levi et al.,28and corresponds to an ion exchange zone. In this region of small positive polarization, the adsorption of anions (counterions) is concomitant with desorption of cations (co-ions) which are expelled from the electrode, leading to the breaking of the perm-selectivity in the 1 nm micropores.28,34,35 Upon subsequent increase of the polarization(ΔQ > 0.4 mC, domain III), the weight change vsΔQ is consistent with the exchange of anions only and the perm-selectivity of the electrode is recovered. Anion adsorption in such confined environments seems to occur once most of the cations have left the electrode pores, thus suggesting that EMI+cations are more mobile than
TFSI−anions in carbon pores of 1 nm diameter. The difference observed between negative (cation adsorption) and positive polarization (anion adsorption) is consistent with modeling results obtained in neat BMI-PF6 electrolyte, which showed that more counter- and co-ions were involved during positive polarization.17
Figure 4 shows the electrode mass change vs charge change during the polarization of the CDC-1 nm pore size in 2 M
EMI-TFSI in acetonitrile electrolyte, from the CVs presented in Figure 2a,b. Similar to neat EMI-TFSI, three different domains can be observed in the plot. In domain I, for negative charge (ΔQ < 0), the change of electrode mass increased linearly with the charge. The average molar weight of the adsorbed species involved in the charge storage mechanism calculated from the slope of the experimental plot is 265 g/mol (Table 1), which is much higher than bare EMI+molecular weight (dashed red line in region I). The difference between these two values is assumed to originate from the presence of solvent molecule around the EMI+cation during the adsorption process. On the basis of these results, the average solvation number of the EMI+ cations in acetonitrile can be calculated as 3.7, so that 3.7 acetonitrile molecules enter the pores together with one EMI+ cation. Despite the presence of the solvation shell around the cations, the 1 nm micropores show a perm-selective behavior since there is no visible cation−anion mixing zone in this region; anions are assumed to be expelled from the electrode at the very early stage of the negative polarization. For positive charge (ΔQ > 0, Figure 4), a different behavior is observed.
Figure 3.Electrode mass change vs charge during the polarization of CDC-1 nm in neat EMI-TFSI: Blue solid lines are measured mass change (EQCM), red dashed lines are the theoretical mass change of neat ions calculated from Faraday’s law. The black dashed line shows the linearfitting of measured mass change. Ion population change vs charge plot is given in the Supporting Information section.
Table 1. Apparent Molecular Weights Calculated from the ExperimentalΔm vs ΔQ Curvesa
neat EMI-TFSI (g/mol) solvated EMI-TFSI (g/mol)
EMI+(111) TFSI−(280) EMI+(111+n·AN) TFSI−(280+n·AN)
CDC-1 nm 97 270 (high Q) 265 (n = 3.7) 208 (high Q)
CDC-0.65 nm 179 (n = 1.6)
aThe apparent molecular weights regarding anion adsorption in CDC-1 nm for both electrolytes were obtained fromΔm vs ΔQ curves at high
polarization (high Q). n is the calculated acetonitrile solvation number.
Figure 4.Electrode mass change vs charge (blue solid lines) during the polarization of CDC-1 nm in 2 M EMI-TFSI + AN. The red dashed lines are the theoretical mass change of neat ions calculated from Faraday’s law. The black dashed line shows the linear fitting of measured mass change. Ion population change vs charge plot is given in the Supporting Information section.
Whatever the charge, the slope of the plot is always less than the theoretical line corresponding to the adsorption of neat (nonsolvated) TFSI−ions; it is linear only at higher charge in domain III, with a slope corresponds to an apparent molecular weight of 208 g/mol (see Table 1). Such a behavior can only be explained by the existence of an cation−anion mixing zone, due to a breaking of the perm-selectivity in the carbon micropores of 1 nm: the adsorption of counterions, here TFSI−, is accompanied by the desorption of co-ions, EMI+. Similar to what was observed in neat EMI-TFSI electrolyte, in the presence of solvent molecules, the charge storage in micro-porous carbons with controlled 1 nm pore size seems to mainly involve cation exchange, different from what was observed with microporous activated carbons in propylene carbonate-based organic electrolytes.28These results are in line with the higher mobility of cations as compared to anions36,37 in neat EMI-TFSI, and with the electrochemical study using a cavity microelectrode in acetonitrile-based EMI-TFSI electrolytes.25
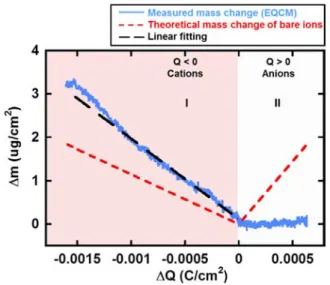
Figure 5 shows the electrode mass vs charge change during the polarization of CDC-0.65 nm in 2 M EMI-TFSI in
acetonitrile electrolyte, from the CVs presented in Figure 2c,d. The Δm−ΔQ curve does not show any mass change during anion adsorption (ΔQ > 0, domain II), as already seen in Figure 2d, which is ascribed to the size effect: the pore size is too small for TFSI−anions to access, and the mass of the few amount of TFSI−adsorbed on the electrode was offset by the repellence of acetonitrile molecules. For cation adsorption (ΔQ < 0, domain I), the same trend as that for solvated EMI-TFSI in CDC-1 nm is observed, except that the slope of theΔm−ΔQ curve is lower. From this curve, an average molecular weight of 179 g/mol was obtained, and the calculated mean solvation number was found to be 1.6 (Table 1). The lower solvation number obtained for the EMI+ adsorption in small pore sizes (0.65 nm), compared to 3.7 for the 1 nm pore size sample, supports the partial desolvation of the cations when accessing small pores.
A recent study on charge storage mechanism in confined nanoporous CDC electrodes by molecular dynamics simulation in 1.5 M BMI-PF6in acetonitrile electrolyte shows that under polarization, ions that can access these confined 1 nm pores by partial desolvation, the solvation number moving from 8 to 9 in bulk electrolyte down to 2−3 in confined pores,26in agreement with the present experimental results.
The present EQCM study has shown some key differences existing between EMI+ and TFSI−ions during transport and adsorption into carbon nanopores. In neat or acetonitrile-based electrolyte, the EMI+ adsorption is perm-selective, while the TFSI−anion adsorption at the positive electrode is achieved via ion exchange with the co-ions; this exchange process may slow down the transport and adsorption kinetics at the positive porous carbon electrodes. Cations were found to be partially desolvated when accessing small pores, and solvation numbers could be estimated from the change of the electrode mass during the polarization.
CONCLUSIONS
Cyclic voltammetry with in situ EQCM measurement were applied to test neat TFSI and acetonitrile-solvated EMI-TFSI electrolyte in CDC with two different average pore sizes. The quartz resonance frequency responses were converted into mass change on the electrode during charging and discharge. The measured mass changes showed that both neat and solvated ions have more difficulty in accessing the 0.65 nm-pores than 1 nm-nm-pores, in good agreement with our previous study. With further calculation, the EQCM technique offers more information on the compositional change during electrochemical measurement. For neat EMI-TFSI, it was found that the charge is stored with high efficiency when the polarization is large enough; one net charge stored corresponds almost to one single ion. In that case, no ion-pairing or charge screening by co-ions are observed during charging in confined micropores, while a screening of the charge by the co-ions can be observed at low polarization at the positive electrode. For solvated EMI-TFSI in acetonitrile, solvation numbers around cation in 1 nm- and 0.65 nm-pore were estimated to be 3−4 and 1−2, respectively. These numbers provide important insights into the difference in solvation environment between CDC-1 nm and CDC-0.65 nm. Less solvated acetonitrile molecules in 0.65 nm-pore than in 1 nm-pore signifies that the ion desolvation occurs to be able tofit in the smaller pores. The results also suggest that EMI+cation owns higher mobility than TFSI− anion. The combination of the CV and EQCM techniques thus offer a great opportunity for pushing further our basic understanding of ion transport and extent of solvation in porous materials, for designing optimized porous materials for the next generation of high energy density supercapacitors.
EXPERIMENTAL SECTION
In this work, neat 1-ethyl-3-methylimidazolium bis(trifluoromethane-sulfonyl)imide (EMI-TFSI) (Solvionic, CAS #174899-82-2) ionic liquid and 2 M EMI-TFSI in acetonitrile (AN) (Acros Organics, CAS #75-05-8) were used as electrolyte, and TiC-CDCs (Y-Carbon, Inc.) with average pore sizes of 1 and 0.65 nm were chosen as electrode materials. The Brunauer−Emmett−Teller (BET) specific surface area for CDC-1 nm and CDC-0.65 nm are 1542 and 1023 m2/g, respectively.
Slurry composed of 90% of active electrode materials and 10% of polyvinylidenefluoride (Arkema, CAS #24937-79-9) in N-Methyl-2-pyrrolidone(Sigma-Aldrich, CAS #872-50-4) was prepared and dripped on a Maxtek 1-in.-diameter Au-coated AT-cut quartz crystal Figure 5.Electrode mass change vs charge (blue solid lines) during
the polarization of CDC-0.65 nm in 2 M EMI-TFSI + AN. The red dashed lines are the theoretical mass change of neat ions calculated from Faraday’s law. The black dashed line shows the linear fitting of measured mass change. Ion population change vs charge plot is given in the Supporting Information section.
(with a fundamental frequency of 5 MHz). The carbon-coated quartz was then dried in 60°C oven overnight. A Maxtek RQCM system combined with Autolab PGSTAT101 was used for simultaneous EQCM and electrochemical measurements. The electrochemical cell was assembled in a glovebox under argon atmosphere at room temperature using the carbon-coated quartz as working electrode, platinum-coated titanium mesh as counter electrode, and a silver wire as a quasi-reference electrode.
Cyclic voltammetry (CV) tests were conducted at a scan rate of 10 mV/s at room temperature with simultaneous recording of the quartz resonance frequency. The CV tests were cycled to reach stable/ equilibrium state until the motional resistance was under steady sate (see Supporting Information, SI, Figure S1). The shift of the quartz resonance frequency (Δf) was converted into the mass change (Δm) on the carbon-coated quartz during cycling by applying Sauerbrey’s equation (eq 1). The sensitivity factor, Cf, was obtained by carrying
out a silver electroplating under constant current (chronopotentiom-etry @−0.18 mA/cm2) on a bare quartz soaked in electrolytic solution
containing 0.01 M silver nitrate and 0.1 M tetraethylammonium tetrafluoroborate in acetonitrile. The mass of silver deposit (m) was calculated by applying Faraday’s law (eq 2), assuming a 100% faradic efficiency: = · · = · · · m Q M n F I t M n F w w (2) where Q is the charge passed through the electrode in Coulomb, I is the current in Ampere, t is the time in seconds, Mwis the molecular
weight of silver (107.9 g/mol), F is the Faraday constant (96 485 C/ mol), and n is the valence number of the ion. The calibration constant Cfwas then determined from the slope ofΔf versus Δm curve. The
value of the calibration constant used in this work is 17.5 ng/Hz. The amount of charge stored or released on the electrode surface during cyclic voltammetry is calculated from CVs (integration of current versus time). The immersion potential was set as a reference point, then one can further interpret the EQCM results into electrode mass change (Δm) versus the charge (ΔQ) passed in the electrode during charging/discharge (blue solid lines in Figures 3−5). Assuming that one net charge stored on the electrode is contributed by one single ion, the theoretical mass change of bare ions was calculated from Faraday’s law (eq 2), using the values of molecular weight (Mw) of 111
and 280 g/mol for EMI+and TFSI−, respectively (red dashed lines in Figures 3−5). Furthermore, combining eqs 1 and 2, the apparent molecular weight (Mw′) of the species that interact with the electrode
during electrochemical measurements is calculated from the slope of Δm−ΔQ curve by the following equation:
′ = M nF m Q w (3) The acetonitrile solvation number (n) is calculated using eq 4:
= ′ −
n M M
M
w w(bare ion)
w(AN) (4)
where Mw(bare ion) and Mw(AN)are the molecular weight of ions and
acetonitrile, respectively. The calculated apparent molecular weights and solvation numbers (n) are shown in Table 1. The current of CV in Figures 1 and 2, and theΔm and ΔQ in Figures 3−5 were normalized by the electrochemical active area of the quartz (1.27 cm2).
ASSOCIATED CONTENT
Change of resonance frequency ( f) and motional resistance (R) (Figure S1); ion population change vs charge (Figure 2A−C). This material is available free of charge via the Internet at http://pubs.acs.org.
AUTHOR INFORMATION
Corresponding Author
Notes
The authors declare no competingfinancial interest.
ACKNOWLEDGMENTS
W.-Y.T. was supported by the European Research Council (ERC, Advanced Grant, ERC-2011-AdG, Project 291543-IONACES). P.S. also acknowledges funding from the Chair “Embedded Multi-Functional Nanomaterials” from the Airbus Group Foundation.
REFERENCES
(1) Conway, B. E. Electrochemical Supercapacitors: Scientific Fundamentals and Technological Applications, 1st ed.; Springer: New
York, 1999.
(2) Kötz, R.; Carlen, M. Electrochim. Acta 2000, 45, 2483.
(3) Miller, J. R.; Burke, A. F. Electrochem. Soc. Interface 2008, 17, 53. (4) Simon, P.; Gogotsi, Y. Nat. Mater. 2008, 7, 845.
(5) Pandolfo, A. G.; Hollenkamp, A. F. J. Power Sources 2006, 157, 11.
(6) Simon, P.; Gogotsi, Y. Acc. Chem. Res. 2012, 46 (5), 1094−1103. (7) Zhang, L. L.; Zhao, X. S. Chem. Soc. Rev. 2009, 38, 2520. (8) Zhu, Y.; Murali, S.; Stoller, M. D.; Ganesh, K. J.; Cai, W.; Ferreira, P. J.; Pirkle, A.; Wallace, R. M.; Cychosz, K. A.; Thommes, M.; Su, D.; Stach, E. A.; Ruoff, R. S. Science 2011, 332, 1537.
(9) Pérez, C. R.; Yeon, S.-H.; Ségalini, J.; Presser, V.; Taberna, P.-L.; Simon, P.; Gogotsi, Y. Adv. Funct. Mater. 2013, 23, 1081.
(10) Tsai, W.-Y.; Gao, P.-C.; Daffos, B.; Taberna, P.-L.; Perez, C. R.; Gogotsi, Y.; Favier, F.; Simon, P. Electrochem. Commun. 2013, 34, 109. (11) Chmiola, J.; Yushin, G.; Gogotsi, Y.; Portet, C.; Simon, P.; Taberna, P. L. Science 2006, 313, 1760.
(12) Huang, J.; Sumpter, B. G.; Meunier, V. Chem.Eur. J. 2008, 14, 6614.
(13) Lin, R.; Taberna, P. L.; Chmiola, J.; Guay, D.; Gogotsi, Y.; Simon, P. J. Electrochem. Soc. 2009, 156, A7.
(14) Kondrat, S.; Georgi, N.; Fedorov, M. V.; Kornyshev, A. A. Phys. Chem. Chem. Phys. 2011, 13, 11359.
(15) Shim, Y.; Kim, H. J. ACS Nano 2010, 4, 2345.
(16) Wu, P.; Huang, J.; Meunier, V.; Sumpter, B. G.; Qiao, R. ACS Nano 2011, 5, 9044.
(17) Merlet, C.; Rotenberg, B.; Madden, P. A.; Taberna, P.-L.; Simon, P.; Gogotsi, Y.; Salanne, M. Nat. Mater. 2012, 11, 306.
(18) Jiang, D.; Wu, J. J. Phys. Chem. Lett. 2013, 4, 1260. (19) Ohba, T.; Kaneko, K. J. Phys. Chem. C 2013, 117, 17092. (20) Kondrat, S.; Wu, P.; Qiao, R.; Kornyshev, A. A. Nat. Mater. 2014, 13, 387.
(21) Wang, H.; Forse, A. C.; Griffin, J. M.; Trease, N. M.; Trognko, L.; Taberna, P.-L.; Simon, P.; Grey, C. P. J. Am. Chem. Soc. 2013, 135, 18968.
(22) Deschamps, M.; Gilbert, E.; Azais, P.; Raymundo-Pinero, E.; Ammar, M. R.; Simon, P.; Massiot, D.; Beguin, F. Nat. Mater. 2013, 12, 351.
(23) Richey, F. W.; Dyatkin, B.; Gogotsi, Y.; Elabd, Y. A. J. Am. Chem. Soc. 2013, 135, 12818.
(24) Largeot, C.; Portet, C.; Chmiola, J.; Taberna, P.-L.; Gogotsi, Y.; Simon, P. J. Am. Chem. Soc. 2008, 130, 2730.
(25) Lin, R.; Huang, P.; Ségalini, J.; Largeot, C.; Taberna, P. L.; Chmiola, J.; Gogotsi, Y.; Simon, P. Electrochim. Acta 2009, 54, 7025. (26) Merlet, C.; Péan, C.; Rotenberg, B.; Madden, P. A.; Daffos, B.; Taberna, P.-L.; Simon, P.; Salanne, M. Nat. Commun. 2013, 4, 2701. (27) Levi, M. D.; Salitra, G.; Levy, N.; Aurbach, D.; Maier, J. Nat. Mater. 2009, 8, 872.
(28) Levi, M. D.; Levy, N.; Sigalov, S.; Salitra, G.; Aurbach, D.; Maier, J. J. Am. Chem. Soc. 2010, 132, 13220.
(29) Levi, M. D.; Sigalov, S.; Aurbach, D.; Daikhin, L. J. Phys. Chem. C 2013, 117, 14876.
(30) Sauerbrey, G. Z. Für Phys. 1959, 155, 206.
(31) Bruckenstein, S.; Shay, M. Electrochim. Acta 1985, 30, 1295. (32) Buttry, D. A.; Ward, M. D. Chem. Rev. 1992, 92, 1355. (33) Segalini, J.; Iwama, E.; Taberna, P.-L.; Gogotsi, Y.; Simon, P. Electrochem. Commun. 2012, 15, 63.
(34) Levi, M. D.; Sigalov, S.; Salitra, G.; Elazari, R.; Aurbach, D. J. Phys. Chem. Lett. 2011, 2, 120.
(35) Levi, M. D.; Sigalov, S.; Salitra, G.; Aurbach, D.; Maier, J. ChemPhysChem 2011, 12, 854.
(36) Noda, A.; Hayamizu, K.; Watanabe, M. J. Phys. Chem. B 2001, 105, 4603.