HAL Id: hal-00907446
https://hal.inria.fr/hal-00907446
Submitted on 21 Nov 2013HAL is a multi-disciplinary open access archive for the deposit and dissemination of sci-entific research documents, whether they are pub-lished or not. The documents may come from teaching and research institutions in France or abroad, or from public or private research centers.
L’archive ouverte pluridisciplinaire HAL, est destinée au dépôt et à la diffusion de documents scientifiques de niveau recherche, publiés ou non, émanant des établissements d’enseignement et de recherche français ou étrangers, des laboratoires publics ou privés.
Whole genome re-sequencing : lessons from unmapped
reads
Anaïs Gouin, Pierre Nouhaud, Fabrice Legeai, Guillaume Rizk,
Jean-Christophe Simon, Claire Lemaitre
To cite this version:
Anaïs Gouin, Pierre Nouhaud, Fabrice Legeai, Guillaume Rizk, Jean-Christophe Simon, et al.. Whole genome re-sequencing : lessons from unmapped reads. Journées Ouvertes Biologie Informatique Math-ématiques, Jul 2013, Toulouse, France. �hal-00907446�
Whole genome re-sequencing : lessons from unmapped reads
Ana¨ıs GOUIN1,2, Fabrice LEGEAI1,2, Pierre NOUHAUD1, Guillaume RIZK1, Jean-Christophe SIMON1andClaire LEMAITRE2
1 INRA, UMR 1349, Institute of Genetics, Environment and Plant Protection, Le Rheu Cedex, France
{fabrice.legeai,pierre.nouhaud,jean-christophe.simon}@rennes.inra.fr
2 INRIA Rennes - Bretagne Atlantique/IRISA, EPI GenScale, Rennes, France
{anais.gouin,claire.lemaitre}@inria.fr
Abstract Unmapped reads are often discarded from the analysis of whole genome re-sequencing, while, opposingly, new biological information can be discovered from their analysis. In this pa-per, we investigated these reads from the re-sequencing data of thirty-three aphid genomes. The unmapped reads for each individual were retrieved from the results of the mapping of the sets of reads against the Acyrthosyphon Pisum reference genome, its mitochondrion genome and several known or putative symbiont genomes. These sets of unmapped reads were then cross-compared, this pointed out that a significant number of these sequences were conserved among individuals, especially when the latter are adapted to a same specific host plant, revealing that they may share crucial and functional material. Moreover, the analysis of the contigs resulting from the assem-blies of the unmapped reads gathered by biotype allowed us to discover putative novel sequences absent from the reference genomes and highlighted the possible presence of other symbionts in the pea aphid genome whose existence were not known previously. As a conclusion, this study emphasizes that using a default strategy (e.g for the mapping) may lead to the loss of important information, and must be accompanied by specific analyses depending on the biological model. Keywords comparative genomics, NGS, re-sequencing, mapping, assembly, genomic variants, unmapped reads, aphid genomics
1 Introduction
NGS and whole genome re-sequencing is nowadays commonly used to identify genomic variants that are potentially involved in phenotypic variations, genetic diseases, adaptation or speciation in natural populations. Typically, the reads are mapped against a reference genome and the SNP and structural variant calling are based on the mapped reads [1,9]. Beside the usual caveats regarding unknown insertions or genomic contaminations, using these strategies on non-model organisms such as the pea aphid, may suffer from the poor quality of the reference genome and the uncompleteness of symbionts and organelles genomes. These problems produce a non negligeable fraction of unmapped reads, whose sequences are neglected in favor of the mapped in the further steps of the analysis, while they may contain useful information. This study describes our way to mine the unmapped reads in order to extract relevant biological knowledge, and lead to advice and recommendations for other re-sequencing projects.
We investigated this question in the context of a large scale re-sequencing project on the pea aphid complex. The pea aphid Acyrthosiphon pisum is a phytophagous insect feeding on more than 20 Fabaceae genera. This species forms a complex of sympatric populations, or biotypes, each specialized on one or a few legume species [12,14]. Peccoud et al. (2009) showed that these biotypes include at least eight partly reproductively isolated host races and three cryptic species, forming a gradient of specialization and differentiation potentially through ecological speciation [10]. In addition, the pea aphid is associated with an obligatory endosymbiont, Buchnera aphidicola, located in specialized cells called bacteriocytes and providing its host with essential amino acids. The pea aphid also harbors several facultative symbionts whose distribution is strongly correlated with plant specialization of their hosts and it has been posited that some of these symbionts could play a role in plant adaptation, although clear evidence is still lacking [8,13].
The study was carried out on thirty-three aphid re-sequenced genomes. The reads were mapped against the Acyrthosiphon pisumreference genome, its mitochondrion genome and several known (Buchnera aphidicola), or putative symbiont genomes. The quality of Acyrthosiphon pisum reference genome (530 Mb) composed of 23,924 scaffolds ([4]) is poor compared to those of model organisms, and some symbiont genomes sequences may not be well characterized for this species. As a result, an important part of the reads were not mapped. In this paper, we scrutinized these unmapped reads by performing cross-comparisons between the sets, assembling the reads by biotype and analysing the resulting contigs. We used new sophisticated tools such as Minia [3] and Compareads[7], and more classical ones such as Blast tools [2]. This analysis revealed that biological infor-mation are contained in the unmapped reads and we discovered putative novel sequences of the Acyrthosiphon pisumand new symbiont genomes.
2 Material and Methods 2.1 NGS data
Thirty-three aphid genomes were paired-end re-sequenced using the Illumina HiSeq 2000 instrument with around 15X coverage for each genome. The individuals belong to different populations referring as biotypes according to their adaptation to a specific host plant. We then have for this study, eleven biotypes composed of three individuals each. Reads are 100bp long, sequenced in pairs with a mean insert size of 250 bp. and 42.5 million read pairs were obtained on average for each individual.
2.2 Read mapping
The 100bp paired-end reads were mapped, using Bowtie2 [5] with default parameters (up to 10 mismatches per read, or less if indels are present), to a set of several reference genomes simultaneously. This set is mainly composed of the official pea aphid reference genome, that is the Acyrthosiphon pisum reference genome [4], and its mitochondrion genome. It contains also the genome of the primary bacterial symbiont Buchnera aphidicola, and several known putative secondary symbiont genomes (Candidatus Hamiltonella defensa 5AT, Candidatus Regiella insecticola R5.15, Rickettsia sp. endosymbiont of Ixodes scapularis, Rickettsiella grylli, Serratia symbiotica str. Tucson, Spiroplasma melliferum KC3, Wolbachia sp. strain wRi). Various statistics about the quality of the mapping were carried out and we calculated for each individual the average coverage for each reference genome used. Acyrthosiphon pisum genome coverage is about 14.3X on average (min=10.6X and max=19.96X) and Buchnera genome is covered around 748.8X (min=138.08X and max=1509.03X). The coverage of the other symbiont genomes depends on the biotype and varies from 0X to 117.7X.
Fragments for which both reads of the pair did not map against the reference genomes were extracted from the BAM file (mapping result file) and used for the present study.
In order to check the quality of the unmapped reads, Prinseq [11] was used. Entire poly-N tail at the 3’-end was removed and low quality sequences were trimmed (if quality less than 20 over a window of 10 nucleotides). Only sequences of at least 66 nucleotides were kept for the analysis.
2.3 Comparison of unmapped reads
With the remaining reads, we created the sets of unmapped reads for each individual. Compareads [7] was used to compare the read content of these sets in a pairwise manner : it can find similar reads between two sets of reads without assembling them. A read of set A needs to share at least 2 non-overlapping kmers of size 33 with at least one read of set B to be considered similar. This gives two percentages of similarity between sets A and B : the percentage of reads of A similar to reads of B and vice versa. For all pairwise comparisons, a symetric similarity score was also provided, computed as follows : AinterB+BinterAN
A+NB , with AinterB the number
of reads in set A similar to reads in set B, BinterA the number of reads in set B similar to reads in set A, NA
and NBthe total number of reads in sets A and B respectively.
The 33 samples were classified based on this similarity measure, using R software with the maximum distance for the distance matrix and the complete linkage method for hierarchical clustering. A heatmap of the classified samples was produced to display graphically the pairwise similarity scores.
2.4 Assembly
To get a sufficient coverage for assembly, we used the union of common unmapped reads between the 3 individuals of a same biotype, that is the reads present in at least one comparison between two individuals of a same biotype were all concatenated in one fastq file. The de novo assembler Minia [3] was used to assemble the common unmapped reads for each biotype. The following parameters were used : k-mers seen less than 3 times were filtered out and the size of the kmer for the De Bruijn graph was set to 31.
To calculate the contigs’ coverage, the sets of unmapped reads were re-mapped against the contig sequences using Bowtie2 [5] (default parameters) and the number of reads mapping each contigs were obtained with Sam-tools[6]. Following the average coverage observed from the reads mapped on the genome for one individual (15X), we considered that the contigs with a coverage from 20% to 60% were issued from the genome (nuclear-like coverage), and contigs with higher coverage may come from the symbionts (symbiont-like coverage) or repetitive sequences.
2.5 Comparison and analyses of contigs
BLASTClust was used for assessing whether contigs were similar between biotypes [2]. A match was re-tained between two sequences if they were 80% identical over at least 90% of each sequence length. To find the origin of the larger contigs, they were BLASTed against the aphid reference genomes (nuclear, mitochondrion and symbionts), and contigs with hits with an e-value below 1e-50 were considered as highly divergent region of the A. pisum or its symbiont genomes, i.e. contained reads that could not be mapped during the first mapping step. The remaining contigs were then BLASTed against the non-redundant nucleic database (NR) (blastx). 3 Results
3.1 A non negligeable fraction of reads do not map
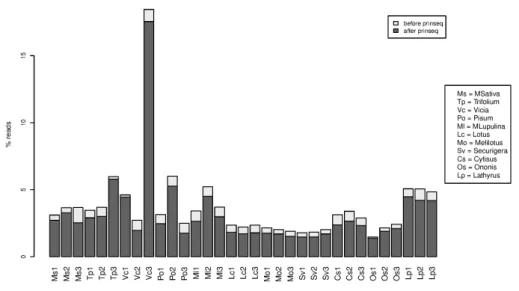
For a given individual, there are between 0.6 and 7 Million pairs (mean = 1.3 Million) of reads that do not map on any of the reference genomes (nuclear genome, mitochondrion or known symbionts), that is both reads of the pair is unmapped. This constitutes an average of 3.7 % of the initial read sets, and most of these are of good quality, as shown in Fig. 1, since few reads were removed (about 17 % ) by quality trimming (see Methods).
Figure 1. Percentage of unmapped reads (unmapped by pair) for each individual, after and before cleaning for quality. Individuals are grouped by biotype and sorted according to their known divergence with respect to the reference genome, the most divergent ones being at the right side of the figure.
We can also see in Fig. 1 that the fraction of unmapped reads varies between individuals. For some bio-types, the fraction of unmapped reads is very similar between individuals, suggesting a common cause of unmapping related to the biotype origin of the individuals. However the fraction of unmapped reads does not seem correlated to the divergence of the individuals (or biotypes) with respect to the reference genome.
This figure shows up that our mapping parameters were correct. Because, if we used a too stringent mapping parameters, we would have expected that the number of unmapped reads were correlated to the divergence of the biotypes and the reference genome, but this is not the case here.
3.2 There is some biologically meaningfull information in these reads
Each set of unmapped reads was compared to all other sets using Compareads [7]. Overall the 1056 (33x32) pairwise comparisons, the percentage of common reads between 2 individuals varies greatly, from 6 to 95% with an average value of 50% . The maximal of the average intersection percentage for each individual is 70% and each individual (except one) shares at least 50 % of its reads with one other individual. This strongly suggests that a large part of unmapped reads is not just random noise.
Interestingly there is a significant difference when comparing individuals of the same biotype (on average 70 % of common reads) versus individuals of different biotypes (48 %). This trend is confirmed by the hierarchical classification of individuals based on the pairwise similarity scores computed from the read set intersections (see Methods). Indeed, we can see in Fig. 2 that individuals belonging to the same biotype have comparable similarity profiles and are clustered together.
Figure 2.Hierarchical classification of the sets of unmapped reads. Each color below the tree corresponds to a biotype. Colors in the heatmap are function of the similarity score between two samples, from low similarity in red to high similarity in yellow.
In particular, one extreme and nice example is the lathyrus biotype, which is known to be the most divergent one (considered as a cryptic species) and which shows a very specific profile on the heatmap with strong similarity among this biotype (yellow group on Fig. 2) : a lathyrus individual shares on average 72 % of its reads with another lathyrus individual, whereas only 23 % with an individual of another biotype.
These results show that the sets of unmapped reads contain some sequence information able to discriminate the biotypes, and therefore unmapped read sets may contain valuable sequences for biological analyses. Indeed, the sequences they are consituted of may play a functional role in the speciation.
3.3 Where do these sequences come from ?
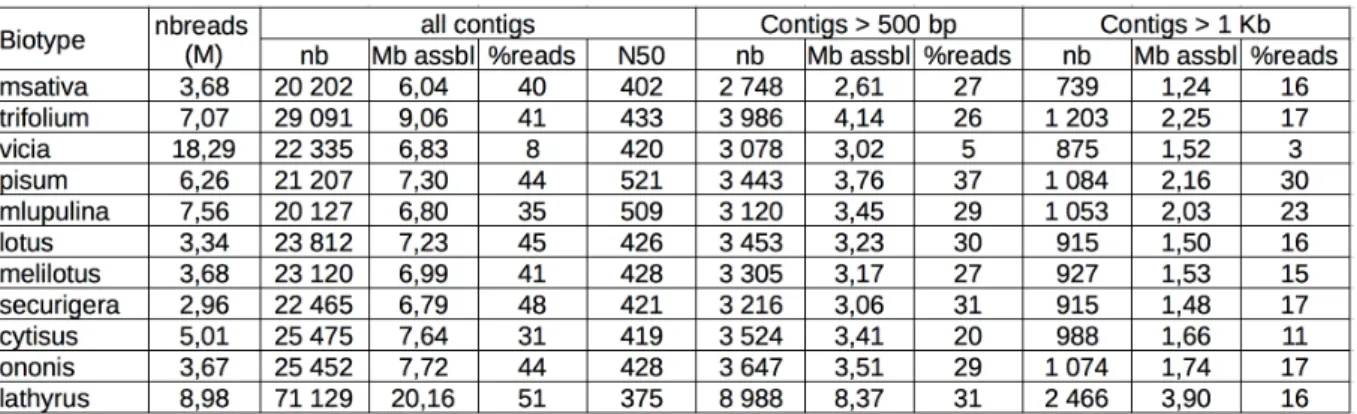
In order to get longer and more efficiently intepretable sequences, we assembled them conjointly by biotype, using the assembler minia [3]. Overall, 92.5 Mb of contig sequences ranging from 108 bp to 35.6 Kb were assembled. The average N50 is low (around 450 bp), but we get more than 12 000 contigs larger than 1 Kb (see Table in Fig. 3).
Figure 3. Contig statistics table. For each biotype, the number (nbreads) of unmapped reads used for the assembly is indicated along with several statistics describing the contigs for several length cut-offs, that is the number of obtained contigs (nb), their cumulative length (Mb assbl), the percentage of reads (%reads) that could be mapped on the contigs and the N50 value.
On average, 39 % of the reads could be remapped on the contigs. For contigs larger than 1 Kb, coverage varies greatly, with 70 % of them having a coverage around 45x suggesting that these contigs can originate from the pea aphid nuclear genome. On the other hand, there are 12 % of contigs with coverage larger than 60x which could originate from bacterial symbiont, mitochondrion, or repeated sequence.
But, we observe that some biotypes dissent from this trend : mlupulina and pisum have more contigs with a symbiont-likecoverage, whereas lathyrus has almost all of its contigs with a nuclear-like coverage (see Fig. 4).
3.3.1 Too divergent aphid genomic sequences
On average, half of the contigs (of size at least 1Kb) have a significant blast hit with the nuclear reference genome. The contigs matching the reference nuclear genome have a mean coverage of 30x, consistent with a nuclear origin. Hence, these contigs likely originate from the nuclear genome and are assembled from reads that were too divergent to map in the first phase. When trying to map these reads with more sensitive parameters (–very-sensitive mode), less than 5% could be mapped on the reference genome, suggesting that this level of divergence may be not recovered with a pure-mapping approach. Consequently we observe that the msativa biotype, which is the same biotype as the reference genome, has the less contigs mapping to the genome than the others, and the more divergent lathyrus has the most summing to 2.4 Mb (see Fig. 4).
3.3.2 New bacterial symbiont
Some of the remaining contigs (not matching the aphid genome) have significant similarity with the sym-biont genomes. But only 2 biotypes (pisum and mlupulina) have most of their contigs similar to symsym-bionts (see Fig. 4). Accordingly, these contigs have a high coverage (more than 140x on average). They show similarity with mainly one symbiont genome : Rickettsia sp. endosymbiont of Ixodes scapularis. However, very few mapped on this genome, initially, with a coverage of only 3x for the pisum and mlupulina biotypes (and 0 for the others). This suggests that the chosen reference genome for Rickettsia were too distant from the actual aphid symbiont. When comparing these contigs to other Rickettsia species we could find a more closely related species Rickettsia bellii. But, the mapping of the reads on this new reference genome gave a lower coverage than the one observed from these contigs (around 40x combined for all three individuals of a biotype, instead of 140) suggesting that we still are missing a very close reference.
3.3.3 Analysis of the remaining contigs
We compared the contigs which neither mapped to the nuclear genome nor to the known symbionts, against the NR database, in order to identify regions which include highly divergent genes, or uncharacterized sym-bionts. Interestingly, beside various viral sequences, we found out sequences similar with many other insect genes, and few bacteria. We are currently proceeding to the refinement of the structures of these genes in order to facilitate their evolutional and functional annotations.
3.3.4 Common contigs, probably nuclear genome missing in the reference assembly
Some of these contigs are similar between several biotypes or even between all biotypes. We clustered them together using BlastClust. We obtained 60 clusters with contigs present in at least 8 biotypes and having a nuclear-like coverage. This represents 58 Kb of sequence, which certainly comes from the nuclear genome of the pea aphid.
Among these 60 clusters, 31 showed similarity with the reference genome and 23 with some aphid genes. These highly divergent genes may be considered as candidate genes for the host-plant adaptation. On the other hand, 29 contigs remained with no similarity with the reference genome. Hence, these latter contigs, representing 23.6 Kb, may be novel aphid sequences missing in the current reference assembly.
3.3.5 A special case of complex and highly repeated sequence
The third individual of the vicia biotype (vc3) shows atypical results compared to other individuals. First, it contains 5 times more unmapped reads than the average (more than 14 Million reads). Nevertheless, 90 % of these where found similar to another vicia individual (vc1). As the latter set contains only 4 Million reads, this high value suggests that the 14 Million reads set is highly redundant. Most of these reads were included in the reads set for the assembly phase, even so the obtained assembly was not longer than for the other biotypes and worse only 8 % of the reads could be mapped on the produced contigs.
Therefore with default parameters we were not able to assemble most of these reads. As it is not due to a low coverage since we showed that the set contained a lot of redundancy, we hypothesized that the reason of the
assembly failure was the high complexity of the assembly graph. We assessed this complexity by comparing the number of branching nodes versus non branching ones (branching node being small repeated sequences having different contexts). As a matter of fact, the vicia graph contains 10 % of branching nodes versus 4 % on average for the other biotypes. To reduce this complexity, we made a second assembly by setting the minimal kmer coverage parameter, usually used to filter out sequencing errors, to 10 (instead of 3), and obtained a larger assembly (23 Mb) using 6.7 Million reads (37 %). By setting the parameter to 100, we could still map 7 Million reads but only on 0.9 Mb. These latter sequences were thus highly covered, 700X on average.
These results show that the individual vc3 contains some sequences, not necessarly specific to this indi-vidual, but in very high coverage, and that are hard to assemble maybe because of numerous small sequence variants or sequencing errors difficult to filter out due to the high coverage. This results might be explained from a recent transposable element specifically active in the vicia biotype.
3.4 Discussion and conclusion
The analysis of unmapped reads from the thirty-three pea aphid re-sequenced genomes revealed that there are important biological information in these data, which are usually put aside. However their analysis is not trivial and we proposed a novel approach to rescue some of the lost information.
The direct pairwise comparisons of read sets, before assembly, enabled to find rapidly similar read sets and pinpoint atypical samples. Moreover, this enabled to choose combinations of samples to merge in order to achieve sufficient coverage for assembly. Indeed the coverage of each individual was too low to expect a good quality assembly. Nevertheless, selecting and merging only reads common to a biotype, may have prevented to find other interesting sequences specific to one genotype or to a combination of individuals of different biotypes. Therefore a more in-depth analysis of the pairwise comparisons followed by assembly of particular combinations of read sets would be interesting to conduct and may help to uncover unexpected links between individuals.
The assembly phase enables to obtain larger sequences that can be more efficiently analysed and compared to sequence databases. However, if bacterial sequences, such as the ones obtained from Rickettsia can be easily assembled and lead to large contigs, this is not the case for a majority of the unmapped reads. As shown by the Vicia example, some repeated and complex sequences need intensive parameter exploration or alternative assembly methods. Unfortunately, these peculiar reads may represent a large fraction of the unmmaped read sets as few of them could be remapped on the built contigs.
The final step of our approach was to align the contigs against sequence databases with less stringent similarity criteria (using the local aligner blast) than the one used during the first mapping step of our process. This enabled to determine the nuclear or symbiont origin of most of the larger contigs. For the symbiont origin, this revealed a wrong choice of reference genome and permitted to find a closer representative species. Without this analysis, we would have concluded from the first mapping that this symbiont was absent (or with a very low abundance) from all individuals.
Important biological implications can be extract regarding the contigs with nuclear origin. These are large regions either absent from the reference genome, or with sufficient divergence with the corresponding reference sequence so that each of the read pairs originating from it can not map. The latter explanation seems to be the most frequent in our dataset. It highlights the major drawback of classical comparative genomics approaches relying on a reference genome. The regions of the reference genome with important genomic divergence for some individuals will contain less mapped reads from these individuals and eventually few divergence will be detected, leading to an erroneous interpretation. Hence this mapping issue could lead to the loss of valuable biological information or biases in the variation analyses depending on the divergence of the individuals to the reference genome. One could think that lowering the mapping threshold to account for high levels of divergence could be a solution. However, this may lead to false positive mappings and more importantly will be too demanding in time and computer resources for huge high throughput sequence data sets. Here, our approach helps to recover those divergent regions, and in our specific case, the forthcoming analysis of those
rescued sequences will help to say if they are genomic regions harboring candidate genes involved in host-plant adaptation.
Finally, some of our contigs are novel sequences (or divergent duplicates), absent from the reference genome and could also harbor some important biological or evolutionary traits. We are currently investigating this with a different and complementary approach : the detection and assembly of inserted sequences using the whole read sets (not only the unmapped ones). We plan to compare the contigs obtained by both approaches and if some match are found, we will get an additional information of the location of the novel inserted sequences in the reference genome.
Acknowledgements
This work was supported by ANR Blanc SPECIAPHID (ANR 11 BSV7 005 01) and by the R´egion Bre-tagne (Adaptro).
References
[1] 1000 Genomes Project Consortium, R. M. Durbin, G. R. Abecasis, D. L. Altshuler, A. Auton, L. D. Brooks, R. M. Durbin, R. A. Gibbs, M. E. Hurles, and G. A. McVean. A map of human genome variation from population-scale sequencing. Nature, 467(7319):1061–1073, Oct 2010.
[2] S. F. Altschul, W. Gish, W. Miller, E. W. Myers, and D. J. Lipman. Basic local alignment search tool. J Mol Biol, 215(3):403–410, Oct 1990.
[3] R. Chikhi and G. Rizk. Space-efficient and exact de bruijn graph representation based on a bloom filter. In WABI, volume 7534 of Lecture Notes in Computer Science, pages 236–248. Springer, 2012.
[4] International Aphid Genomics Consortium. Genome sequence of the pea aphid acyrthosiphon pisum. PLoS Biol, 8(2):e1000313, Feb 2010.
[5] B. Langmead and S. L. Salzberg. Fast gapped-read alignment with bowtie 2. Nat Methods, 9(4):357–359, Apr 2012. [6] H. Li, B. Handsaker, A. Wysoker, T. Fennell, J. Ruan, N. Homer, G. Marth, G. Abecasis, R. Durbin, and . G. P. D. P.
Subgroup. The sequence alignment/map format and samtools. Bioinformatics, 25(16):2078–2079, Aug 2009. [7] N. Maillet, C. Lemaitre, R. Chikhi, D. Lavenier, and P. Peterlongo. Compareads: comparing huge metagenomic
experiments. BMC Bioinformatics, 13(Suppl 19):S10, Dec 2012.
[8] A. H. C. McLean, M. van Asch, J. Ferrari, and H. C. J. Godfray. Effects of bacterial secondary symbionts on host plant use in pea aphids. Proceedings of The Royal Society B: Biological sciences, 278(1706):760–766, 2011. [9] R. Nielsen, J. S. Paul, A. Albrechtsen, and Y. S. Song. Genotype and snp calling from next-generation sequencing
data. Nat Rev Genet, 12(6):443–451, Jun 2011.
[10] J. Peccoud, A. Ollivier, M. Plantegenest, and J.-C. Simon. A continuum of genetic divergence from sympatric host races to species in the pea aphid complex. Proc Natl Acad Sci U S A, 106(18):7495–7500, May 2009.
[11] R. Schmieder and R. Edwards. Quality control and preprocessing of metagenomic datasets. Bioinformatics, 27(6):863–864, Mar 2011.
[12] J.-C. Simon, S. Carr´e, M. Boutin, N. Prunier–Leterme, B. Sabater–Mu˜noz, A. Latorre, and R. Bournoville. Host–based divergence in populations of the pea aphid: insights from nuclear markers and the prevalence of faculta-tive symbionts. Proceedings of the Royal Society of London. Series B: Biological Sciences, 270(1525):1703–1712, 2003.
[13] T. Tsuchida, R. Koga, and T. Fukatsu. Host plant specialization governed by facultative symbiont. Science, 303:1989, 2004.
[14] S. Via. Specialized host plant performance of pea aphid clones is not altered by experience. Ecology, 72(4):1420– 1427, 1991.