HAL Id: hal-01361274
https://hal.inria.fr/hal-01361274
Submitted on 7 Sep 2016
HAL is a multi-disciplinary open access
archive for the deposit and dissemination of
sci-entific research documents, whether they are
pub-lished or not. The documents may come from
teaching and research institutions in France or
abroad, or from public or private research centers.
L’archive ouverte pluridisciplinaire HAL, est
destinée au dépôt et à la diffusion de documents
scientifiques de niveau recherche, publiés ou non,
émanant des établissements d’enseignement et de
recherche français ou étrangers, des laboratoires
publics ou privés.
MCC’2015 – The Fifth Model Checking Contest
Fabrice Kordon, Hubert Garavel, Lom Messan Hillah, Emmanuel Paviot-Adet,
Loïg Jezequel, César Rodríguez, Francis Hulin-Hubard
To cite this version:
Fabrice Kordon, Hubert Garavel, Lom Messan Hillah, Emmanuel Paviot-Adet, Loïg Jezequel, et al..
MCC’2015 – The Fifth Model Checking Contest. LNCS Transactions on Petri Nets and Other Models
of Concurrency, Springer, 2016, Lecture Notes in Computer Science, 9930, pp.262-273.
�10.1007/978-3-662-53401-4_12�. �hal-01361274�
MCC’2015 – The Fifth Model Checking Contest
Fabrice Kordon1, Hubert Garavel2, Lom Messan Hillah3, Emmanuel Paviot-Adet1, Lo¨ıg Jezequel4, C´esar Rodr´ıguez5, and Francis Hulin-Hubard6
1 Sorbonne Universit´es, UPMC Univ. Paris 06, LIP6 CNRS UMR 7606, F-75005 Paris, France
2 INRIA, Univ. Grenoble Alpes, LIG, F-38000 Grenoble, France
3 Univ. Paris Ouest Nanterre La D´efense, LIP6 CNRS UMR 7606, F-75005 Paris, France 4 Univ. Nantes, IRCCyN, UMR CNRS 6597, F-44321 Nantes, France
5 Univ. Paris 13, Sorbonne Paris Cit´e, CNRS, LIPN, F-93430 Villetaneuse, France 6 CNRS, LSV, Ecole Normale Sup´erieure de Cachan, F-94235 Cachan, France
Abstract. The Model Checking Contest (MCC) is an annual competition be-tween software tools that verify concurrent systems using state-space exploration techniques, either explicit-state or symbolic. The present article provides a com-prehensive account of the 2015 edition of the MCC. The principles of the contest are described, together with its underlying software infrastructure. The tools that competed in 2015 are listed and the results of the contest are summarized.
1
Goals and Scope of the Model Checking Contest
For more than a decade, one has seen the emergence of software contests that assess the capabilities of verification tools on complex benchmarks, so as to identify which theoretical approaches are the most fruitful ones in practice, when applied to realis-tic examples. Notable events that have significant impact on the involved communi-ties include: the SAT competition (nine editions since 2002), the Satisfiability Modulo Theories Competition (ten editions since 2005), the Hardware Model Checking Con-test (eight editions since 2007), the Verified Software Competition (four editions since 2010), the Rigorous Examination of Reactive Systems Challenge (five editions since 2010), the Timing Analysis Contest (one edition in 2011), and the Competition on Soft-ware Verification (four editions since 2012). The existence of long-lasting events is a clear indication of interest and usefulness.
The Model Checking Contest (MCC for short — five editions since 2011) belongs to this family of scientific contests. It aims at evaluating model-checking tools that analyze formal descriptions of concurrent systems, i.e., systems in which several processes run simultaneously, communicating and synchronizing together. Examples of such systems include hardware, software, communication protocols, and biological models. So far, all editions of the MCC used Petri nets to describe such systems, but there is a long-term goal to open the contest to other model-checking tools not primarily based on Petri nets.
Since the first edition MCC’2011 within the context of a workshop associated to the Petri Nets conference, the contest team has attracted key people with diverse knowl-edge, who are actively contributing to the selection of benchmark models, the
auto-mated generation of temporal-logic formulas, and all technical aspects related to per-formance measurements and tool assessment. Today, the MCC team gathers scientists from CNRS, Inria, Universit´e Pierre & Marie Curie, Universit´e Paris Ouest Nanterre La D´efense, Universit´e Paris 13, and Universit´e de Nantes.
The present paper reports about the fifth edition MCC’2015, which was organized in Brussels as a satellite event of the 36thInternational Conference on Application and Theory of Petri Nets and Concurrency. This is the first publication devoted to the MCC since its origins, and it will be followed by detailed presentations of the tools that reached the top-three podiums in June 2015. The paper is organized as follows. Sec-tion 2presents the collection of benchmarks on which the participating tools are as-sessed. Section3explains how temporal-logic formulas are automatically generated for the contest examinations. Section4details how tools are executed and how information is retrieved from their execution. Section5lists the participating tools, and Section6
summarizes the results of the contest. Finally, Section7gives some concluding remarks and suggests desirable enhancements for future MCC editions.
2
Collected Benchmarks
All tools participating in a given edition of the MCC are evaluated on the same bench-mark suite, which is updated every year. The yearly edition of the MCC starts with a call for modelsinviting the scientific community at large (i.e., beyond the developers of the participating tools) to propose novel benchmarks that will be used for the MCC. The benchmarks obtained this way are merged with those of the former years to form a growing collection (continuously expanded since 2011) that gathers systems from di-verse academic and industrial fields: software, hardware, networking, biology, etc. This collection of benchmarks1is a perennial result of the MCC organization work — should the contest halt, the collection would remain available to the scientific community. The usefulness of this collection is already witnessed by over thirty scientific publications2.
Models and Instances. The collection of MCC benchmarks consists of models, each corresponding to a particular academic or industrial problem, e.g., a distributed algo-rithm, a hardware protocol in a circuit, a biological process, etc. Models may be param-eterizedby one or a few variables representing quantities such as the number of agents in a concurrent system, the number of message exchanged and the like. To each param-eterized model are associated as many instances (typically, between 2 and 30) as there are different combinations of values considered for the parameters of this model; each non-parameterized model has a single associated instance. Each instance corresponds to a Petri net that will actually be submitted to all participating tools.
Models come from diverse sources: 34% of the models originate from high-level colored Petri nets, which are then automatically unfolded to P/T nets; 14% of the mod-els have been produced from formal descriptions written in LOTOS [18] or more re-cent process-calculi languages that translate to LOTOS, from which Petri nets can be
1The collection of benchmarks is available fromhttp://mcc.lip6.fr/models.php 2The list of publications is available fromhttp://mcc.lip6.fr
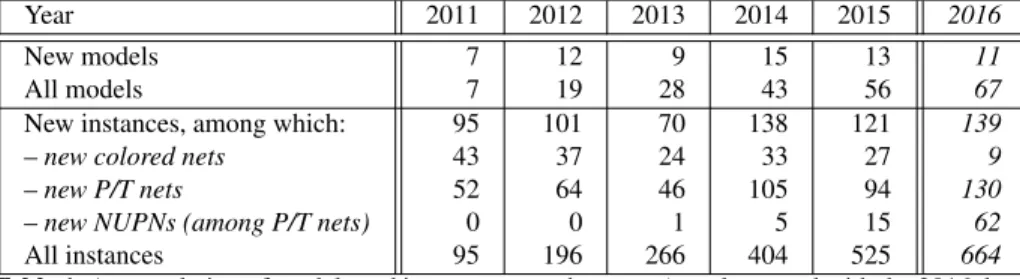
Year 2011 2012 2013 2014 2015 2016
New models 7 12 9 15 13 11
All models 7 19 28 43 56 67
New instances, among which: 95 101 70 138 121 139
– new colored nets 43 37 24 33 27 9
– new P/T nets 52 64 46 105 94 130
– new NUPNs (among P/T nets) 0 0 1 5 15 62
All instances 95 196 266 404 525 664
Table 1. Accumulation of models and instances over the years (supplemented with the 2016 data)
automatically generated using the CADP toolbox [17]; the remaining 52% have been manually specified as genuine P/T nets, e.g., using a graphical editor. Table1illustrates the growth of the collection since the first edition of the MCC; the notion of NUPN (Nested-Unit Petri Net) is discussed below.
All instances in the MCC benchmark collection are provided as PNML files [19]. After each annual call for models, the MCC model team examines all the files received to check their conformance to the PNML standard and, if needed, normalize their con-tents to avoid some known ambiguities of PNML — for instance, to give the same value to the id and name attributes of each place and each transition (thus ensuring unique naming conventions across all the participating tools), and to replace multiple occur-rences of arcs between the same place and the same transition by a unique arc with multiplicity greater than one.
Forms and Properties. Each MCC model is described in a form, which is a two- or three-page PDF document giving a high-level description of the model: origin, func-tionality, bibliographic references, and graphical representation (if available). The form defines the model parameters, if any, and their corresponding values, as well as the size (number of places, transitions, and arcs) of each instance of the model. The form also lists essential properties of the model, both structural (e.g., strongly connected, loop free, etc.) and behavioural ones (e.g., safeness, liveness, reversibility, etc.) — the truth value of a property being unknown for those instances too complex to be analyzed. Finally, the form gives information about the size of the reachable marking graph of each instance (number of markings, number of transition firings, maximal number of tokens per place and per marking) — possibly with unknown or approximate answers. The contents of the model forms evolve regularly, as new information and properties are added every year.
Basically, each form is a LATEX file to be manually written by the person who
submit-ted the model. This approach raises practical issues, as the numerical and Boolean an-swers provided for sizes and properties are sometimes incomplete or erroneous. More-over, the annual addition of new models in the collection and of new properties in the forms makes manual handling cumbersome and error-prone. To address this is-sue, an automated tool chain has been progressively developed by the MCC model team: each P/T net instance is processed in sequence by two tools, PNML2NUPN [10] and CÆSAR.BDD [1], to produce a LATEX file containing numerical and Boolean
an-swers that help checking and completing manually-written model forms. This tool chain works satisfactorily, although with three limitations: (i) it does not handle colored-net instances — but their structural and behavioural properties, as well as the size of their marking graphs, are expected to be the same as for the corresponding unfolded P/T-net instances; (ii) for P/T nets that are not one-safe, answers given for behavioural proper-ties may be approximate; (iii) for large and/or complex instances, behavioural properproper-ties also get approximate answers, as the symbolic (BDD-based) marking-graph exploration (done using the CUDD library [2]) is halted by a timeout after a few minutes.
Nested-Unit Petri Nets. A large proportion (43%) of the MCC models are one-safe P/T nets (also called elementary nets or condition-event systems). Even if such nets are simpler than colored nets or general P/T nets, most related verification problems are computationally hard, namely PSPACE-complete [15]; indeed, there are many one-safe P/T-net instances that no participating tool has been able to entirely analyze so far.
A plausible explanation for such difficulties is that verification is made harder be-cause relevant information about the real systems to be modelled has been lost when formalizing these systems as low-level Petri nets: preserving such information all along the modelling and analysis steps would hopefully make verification easier. This is the motivation behind Nested-Unit Petri Nets (NUPN for short) [16], a P/T-net extension that retains structural and hierarchical information by recursively expressing a net in terms of parallel and sequential compositions.
In 2015, the NUPN paradigm was adopted by the MCC team to foster progress in the analysis of large models. A PNML tool-specific extension3has been defined to in-corporate NUPN information in PNML files, and 8 models (totalling 21 instances) have been enriched with NUPN information. At present, 4 model checkers (CÆSAR.BDD, ITS-Tools, LTSmin, and pnmc) are already able to exploit the NUPN information.
3
Formulas
Tools competing in the MCC are evaluated over four categories of verification tasks: state-space generation, reachability analysis, LTL analysis, and CTL analysis. To maxi-mize tool participation, we further divided the three latter categories into subcategories containing only formulas with a restricted syntax. In 2015, we progressed in the con-solidation of these formula languages and provided simplified BNF grammars for each (sub)category, still preserving backward compatibility with previous MCC editions.
Each tool developer may choose in which categories/sub-categories the tool partic-ipates. For each model instance and each subcategory, 16 formulas are automatically generated and stored into a single XML file (of which a textual version is also provided for the convenience of tool developers). Each tool participating in the corresponding subcategory is requested to evaluate, on the corresponding instance, all or part of the formulas contained in the XML file.
One of the main criticisms about the formulas generated for MCC’2014 was that many of these formulas were trivially true or false, or could be decided immediately
by examining only the initial state or a small fragment of the state space. Generating formulas that are “harder” to model check (not to say realistic verification goals) is a difficult problem, at least because: (i) we need a large amount of formulas (in 2014, we used about 40 000 formulas), and (ii) we usually have little knowledge about the expected properties of the MCC models gathered over the years (namely, only a few models come with associated “meaningful” properties).
To improve the quality of formulas, in 2015 we adopted a new strategy for their generation. Using the grammar of each category, we generated random formulas of up to certain depth (7 operators). We subsequently filtered all generated formulas, in two steps. First, we used SAT solving to filter out formulas being equivalent to true or false independently of the model. Each formula passing the SAT filter was then submitted to SMC [12], a CTL bounded model checker that we developed ad-hoc for the competi-tion. If SMC was able to decide the satisfiability of the formula by examining only the first 1000 reachable states (computed using BFS exploration), then we discarded the formula. Otherwise, we considered the formula to be hard enough and included it in the XML file. The process continued until either we found 16 hard formulas or we had examined 320 (= 20 × 16) random formulas. In the latter case, we completed the file with (up to 16) random formulas, which might be fairly easy to solve; such a situation mainly happened for small nets having less than 1000 reachable states, or when the for-mula syntax in a given category made it difficult to find hard forfor-mulas — the particular grammar chosen for formula has an impact in this respect, and this is indeed something to work on for the next editions of the MCC.
Among the formulas submitted to SMC, 33.0% were declared satisfiable, 57.4% unsatisfiable, and 9.6% hard. In other words, less than 10% of the generated random formulas were actually retained. About 11.3% of the XML files had to be completed with at least one random formula, leading to a proportion of 8.7% non-hard formulas.
The generation-and-filtering strategy took about two days of CPU to produce the 65 490 formulas used in the 2015 edition. The higher quality of this generation process is confirmed by the increase of CPU time required to process all examinations on all models for all tools. Compared to MCC’2014 (157 days of CPU time), we observed a ten-time increase for MCC’2015 (1541 days of CPU time) where only a two-time increase was expected, based on the new models and larger set of formulas introduced in 2015. Such a larger increase, which actually matches the aforementioned filtering rate (9.6%), clearly indicates that the new strategy produces more demanding formulas that better exercise the capabilities of model checkers.
4
Monitoring Environment and Experimental Conditions
Due to, at least, the growth of the MCC collection of benchmarks, the number of re-quired executions to evaluate tools is increasing every year. From 54 293 in 2013, it grew to 83 308 in 2014, and to 169 078 in 2015. Such a number of executions thus requires a dedicated software environment that can take benefits from recent multi-core machines and powerful clusters. Moreover, we need to measure key aspects of computation, such as CPU or peak memory consumption, in the least intrusive way.
Since the second edition of the Model Checking Contest in 2012, we have been confident that relying on virtual machines to operate tools is a suitable solution. To achieve this in an automated way, we developed BenchKit [20], a software technology (based on QEMU) for measuring time and memory during tool execution. First used during MCC’2013, BenchKit was then enhanced for MCC’2014 with new management facilities to ease its operation and, for MCC’2015, with the possibility to assign several cores to virtual machines.
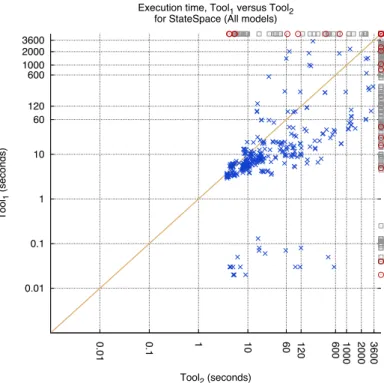
BenchKit is operated using configuration files that define consistent sets of runs. Each run represents an execution, i.e., one tool performing one examination on one (instance of a) model. To cope with the ever-increasing need for CPU, we used several machines in 2015, namely: 0.01 0.1 1 10 60 120 600 1000 2000 3600 0.01 0.1 1 10 60 120 600 1000 2000 3600 Tool 1 (seconds) Tool2 (seconds) Execution time, Tool1 versus Tool2
for StateSpace (All models)
Fig. 1. Example of comparison chart between Tool1and Tool2. Each point represents an
execu-tion and, if below (resp. above) the diagonal, indicates that Tool1(resp. Tool2) has won. Faulty
executions are displayed on the top and right lines. The grey color means the missing tool did not compete, and the red color means the tool was disagreeing with the majority of other tools.
– bluewhale03 (Univ. Geneva), a 40-core, 2.8-GHz machine with 512 GB of RAM, – ebro (Univ. Rostock), a 64-core, 2.7-GHz machine with 1024 GB of RAM, – quadhexa-2 (Univ. Paris Ouest Nanterre), a 24-core, 2.66-GHz machine with 128
– small (Sorbonne Univ., UPMC), a portion of a cluster consisting of five 24-core, 2.4-GHz nodes with 64 GB of RAM each.
These powerful computing machinery (152 cores in total) enabled each tool to be run in a 64-bit virtual machine with 16 GB of memory and either one core (for sequen-tial tools) or four cores (for parallel tools).
To enable relevant comparison of executions between tools, we divided the set of runs into several consistent subsets. Within each subset, all the examinations related to a given model have been executed on the same machine for all the tools. Then, from the raw data produced by BenchKit (execution time, total CPU, memory peak, sampling of memory and CPU usage), we automatically generated summary charts in HTML format. Fig. 1 provides an example of such a chart comparing two tools in a given examination. Such charts are produced for all the possible tool comparisons and tell how well the verification techniques implemented in the tools scale with the benchmarks under study.
The post-analysis scripts that aggregate data, generate summary HTML pages, and compute scores for the contest are implemented using 15 kLOC of Ada and a bit of bash. BenchKit itself consists in approximatively 1 kLOC of bash.
5
Participating Tools
Ten tools were submitted in 2015: Cunf [3], GreatSPN-Meddly [4], ITS-Tools [5], LoLA 2.0 [6], LTSmin [7], Marcie [8], pnmc [9], PNXDD [11], StrataGEM 0.5.0 [13], and TAPAAL [14] (four variants, two of them using parallel computing).
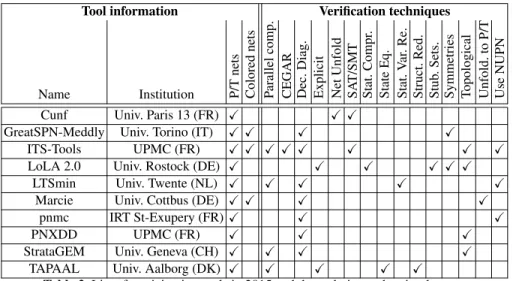
Tool information Verification techniques
Name Institution P/T nets Colored nets P arallel comp. CEGAR Dec. Diag. Explicit Net Unfold SA T/SMT Stat. Compr . State Eq. Stat. V ar . Re. Struct. Red. Stub . Sets.
Symmetries Topological Unfold.
to
P/T
Use
NUPN
Cunf Univ. Paris 13 (FR) X X X
GreatSPN-Meddly Univ. Torino (IT) X X X X
ITS-Tools UPMC (FR) X X X X X X X X
LoLA 2.0 Univ. Rostock (DE) X X X X X X
LTSmin Univ. Twente (NL) X X X X X
Marcie Univ. Cottbus (DE) X X X X
pnmc IRT St-Exupery (FR)X X X
PNXDD UPMC (FR) X X X
StrataGEM Univ. Geneva (CH) X X X X
TAPAAL Univ. Aalborg (DK) X X X X X
Table 2. List of participating tools in 2015 and the techniques they implement.
Table2 lists the participating tools, and indicates which classes of Petri nets and which verification techniques are supported by each tool: parallel computing, CEGAR,
use of decision diagrams (symbolic approaches), explicit model checking, unfolding, use of SAT/SMT solvers, use of state-compression techniques (other than decision di-agrams), exploitation of state equations, static variable reordering, use of structural re-ductions, use of stubborn sets, exploitation of symmetries, use of topological or struc-tural information, unfolding transformation into equivalent P/T nets (for colored nets), and use of Nested-Unit Petri Net (NUPN) information when available.
6
Results
All examinations on the models were processed in the following way. First, tools were invoked on the “known” models (i.e. those of past years). Then, they were confronted with the “scrambled” models that are the “known” ones but presented as new ones. Fi-nally, they had to process the new “surprise” models (those submitted by the community in 2015). This led to 169 078 runs, from which we extracted a much larger number of computed values (e.g., size of the state space, maximum number of tokens per marking, result of a given formula) that were stored and compiled in order to : (i) evaluate the reliability of the tools, and then (ii) compute an overall score.
Computation of the Reliability of the Tools. Ensuring the reliability of a verification tool is important. We thus decided to use the Model Checking Contest for this purpose too. However, determining if the answers issued by tools are correct is a difficult ques-tion, due to the lack of a reference verified result. So, we compare the results of each tool to those of other tools, relying upon a majority-based approach to compute the scores. This is done in three steps: (i) identifying the set of values for which a majority of tools agree; we need at least three agreeing tools to select such a value, (ii) identi-fying, for each tool, the c computed values that are produced within this set, and (iii) checking, within these c values, the n ones that are correct by the identified majority.
Table3 (central part) summarizes the reliability rate we computed for each tool. The four columns provide the following data: the computed rate, the number of correct values (C), the number of values in the selected set for the tool (S), and, as an indication, the number of examinations the tool participates in (i.e. provides at least an answer for one instance of a model). Then, the reliability is trivially the ratio C/S.
Some outcomes need an explanation. There are tools with a lower reliability rate such as GreatSPN-Meddly, ITS-Tools, LTSmin, or one of the TAPAAL variants. In fact, these tools exhibited bugs introduced in recent development (TAPAAL), or translation mistakes (in formulas for GreatSPN-Meddly and ITS-Tools, in the PNML import for LTSmin). Such bugs could not be identified by their developers before the full bench-mark was passed and compared to other tools outputs. We believe this is a valuable information for tool developers, helping them to increase the confidence when imple-menting new algorithms.
In some cases, we also have tools for which the reliability rate was computed on a very small dataset. Usually, these tools only participate in one examination. For PNXDD, we discovered too late a configuration problem in the virtual machine that was only standing for scrambled and surprise models. We regret this problem was not detected during the qualification procedure. StrataGEM, and pnmc also participated in
Reliability informations Examinations scores Tool Rate Correct Selected Nb State Reach. CTL LTL
Cunf 96.96% 4 728 4 876 3 – 17 894 – – GreatSPN-Meddly 62.30% 11 966 19 206 10 6 434 43 686 withdrawn – ITS-Tools 64.05% 10 890 17 003 4 10 6963rd 31 279 – – LoLA 2.0 97.80% 25 796 26 378 6 – 111 8691st – – LTSmin 79.13% 13 995 17 687 5 7 806 45 060 – – Marcie 92.52% 18 443 19 934 10 14 7141st 66 5793rd 33 3811st – pnmc 99.59% 741 744 1 12 5542nd – – – PNXDD 88.89% 56 63 1 562 – – – STrataGEM 100.00% 243 243 1 5 600 – – – TAPAAL (SEQ) 99.88% 22 880 22 907 7 6 132 79 5792nd – – TAPAAL (MC) 99.75% 23 247 23 306 7 5 966 76 256 – – TAPAAL-OTF (SEQ) 96.19% 19 001 19 733 7 3 872 66 316 – – TAPAAL-OTF (PAR) 88.43% 15 253 17 248 7 3 650 48 129 – – Table 3. Summary of results — grey cells mean that the tool was among the top-three winners. When there are several variants for a tool, only the best variant is considered for the podium.
only one examination, which probably makes the tool simpler, and thus easier to be more reliable.
We think the procedure is fair, even if rare cases where the majority of tools might be wrong cannot be excluded. Some tool developers have reported that they included the outputs of the MCC in their own built system to increase the reliability of their tool, which will most probably lead, next year, to a better reliability rate.
Computation of the Overall Score for Each Tool. All computed values were then used to elaborate scores. Only correct values were considered and one wrong value dis-qualifies the tool for the considered examination on the instance of the model. When results were uncertain (i.e., only two distinct answers), the respective reliabilities of the tools were compared to decide which tool was right. We also discarded lonely answers from tools whose reliability was less than 0.9. Then, outputs were weighted: ×1 for “known” models, ×2 for “scrambled” ones and ×3 for “surprise” ones. Finally, points were summed up for each tool and for each examination category: state-space genera-tion, reachability formulas, CTL formulas, and LTL formulas.
The right part of Table3summarizes this result. First, no tool did compete on the LTL formulas, which is unfortunate. Marcie won the state-space generation, followed by pnmc and ITS-Tools, which scaled well but exhibited low reliability in many cases. LoLA won the reachability examination, followed by TAPAAL (the “classical” sequen-tial version), and Marcie. For CTL formulas, Marcie is the only participant (and winner) because a bug was signaled too late by the GreatSPN developers in the CTL translation; they preferred to withdraw the tool from this competition.
We are aware that a single table cannot express all details4found in the hundreds
of thousands charts and tables generated automatically from execution runs. However,
we believe such results are useful for the community to: (i) recognize the great effort of building prototype tools and use them for the verification of real systems, (ii) identify the forces and weaknesses of these tools, and (iii) participate in their improvement. In particular, we note that most of the winning tools share a particularity: they combine several techniques, as shown in Table2.
7
Conclusion — Future Evolutions
All in one, the fifth edition of the Model Checking Contest was successful and ran smoothly, despite the many novelties introduced in 2015: support of Nested-Unit Petri Nets (to open the contest to verification tools operating on concurrent state machines), new XML syntax for temporal-logic formulas, enhanced techniques to automatically generate non-trivial formulas, and virtual machines with multiple cores in BenchKit. The main disappointment for the MCC team was the absence of submitted tools partic-ipating in the LTL category: this could perhaps be interpreted as a sign of decreasing academic interest in linear-time formulas and, if confirmed over the coming years, a pragmatic answer to the longstanding linear-time vs branching-time dilemma.
The following developments are planned for the next editions of the Model Check-ing Contest:
– Concerning the models: future calls will enrich the collection with new models; the forms will be made more detailed by adding a few missing model properties (e.g., extended free choice); an online repository is being developed, which will offer easy access (using web browsing or programming interfaces) to the collection of models; the proportion of NUPN models is expected to grow, as work is going on to automatically synthesize a NUPN structure for “flat” 1-safe nets.
– Concerning the formulas: the community will be actively encouraged to submit properties together with the surprise models, so as to have more “semantically meaningful” formulas associated to each model; the grammar used to describing the syntax of certain categories of formulas will be improved; the generation algo-rithms will be improved to produce “higher-quality” formulas, even at the cost of discarding some contest categories if necessary.
– Concerning the contest itself: new procedures will be added for an early detection of issues similar to that discovered too late with the PNXDD tool (see Sec.6); also, if tool developers agree, negative scores could be introduced to penalize tools giving incorrect verdicts.
Acknowledgments. The MCC team heartily thanks all scientists who proposed new models in 2015 and the tool developers for their participation effort. Acknowledgments are also due to the Universities of Rostock, Geneva, Paris Ouest Nanterre La D´efense, and Pierre & Marie Curie for giving access to the powerful computers needed to operate the contest. We are grateful to Hugues Evrard for proof-reading the present paper.
References
1. CÆSAR.BDD,http://cadp.inria.fr/man/caesar.bdd.html. 2. CUDD,http://vlsi.colorado.edu/˜fabio/CUDD. 3. Cunf,https://github.com/cesaro/cunf. 4. GreatSPN-Meddly,http://www.di.unito.it/˜greatspn/index.html. 5. ITS-Tools,http://ddd.lip6.fr. 6. LoLA 2.0,http://www.service-technology.org/lola. 7. LTSmin,http://fmt.cs.utwente.nl/tools/ltsmin. 8. Marcie,http://www-dssz.informatik.tu-cottbus.de/DSSZ/Software/Marcie. 9. pnmc,http://ahamez.github.io/pnmc. 10. PNML2NUPN,http://pnml.lip6.fr/pnml2nupn. 11. pnxdd,https://projets-systeme.lip6.fr/trac/research/NEOPPOD/wiki/pnxdd. 12. SMC,https://github.com/mcc-petrinets/formulas/tree/v1.0-mcc2015/smc. 13. StrataGEM 0.5.0,http://sourceforge.net/projects/stratagem-mc. 14. TAPAAL,http://www.tapaal.net.15. A. Cheng, J. Esparza, and J. Palsberg. Complexity Results for 1-safe Nets. Theoretical Computer Science, 147(1–2):117–136, 1995.
16. H. Garavel. Nested-Unit Petri Nets: A Structural Means to Increase Efficiency and Scalabil-ity of Verification on Elementary Nets. In 36th International Conference on Application and Theory of Petri Nets and Concurrency (PETRI NETS’15), Brussels, Belgium, volume 9115 of LNCS, pages 179–199. Springer, June 2015.
17. H. Garavel, F. Lang, R. Mateescu, and W. Serwe. CADP 2011: A Toolbox for the Con-struction and Analysis of Distributed Processes. Springer International Journal on Software Tools for Technology Transfer (STTT), 15(2):89–107, Apr. 2013.
18. ISO/IEC. LOTOS — A Formal Description Technique Based on the Temporal Ordering of Observational Behaviour. International Standard 8807, International Organization for Stan-dardization — Information Processing Systems — Open Systems Interconnection, Geneva, Sept. 1989.
19. ISO/IEC. High-level Petri Nets – Part 2: Transfer Format. International Standard 15909-2:2011, International Organization for Standardization — Information Technology — Sys-tems and Software Engineering, Geneva, 2011.
20. F. Kordon and F. Hulin-Hubard. BenchKit, a Tool for Massive Concurrent Benchmarking. In 14th International Conference on Application of Concurrency to System Design (ACSD’14), Tunis, Tunisia, pages 159–165. IEEE Computer Society, June 2014.