(?
Département de géomatique appliquée
Faculté des lettres et des sciences humaines
Université de Sherbrooke '
MEMOIRE DE MAÎTRISE
Cartographie des éricacées {Kalmia angustifolia, Ledum) en forêts
d'épinette noire (Picea mariana) : Cas de la Côte-Nord.
Janvier 2009
Résumé :
L'établissement et la croissance de l'épinette noire en régénération après une coupe en forêts boréales sont fréquemment affectés par la prolifération de plantes éricacées telles le Kalmia angustifolia. La compétition éricacées-épinette noire est fréquente au point d'entraîner une baisse significative du potentiel forestier dans la forêt boréale de l'est du Canada. Il est toujours difficile de proposer des scénarios sylvicoles qui garantissent la résilience des peuplements propices à l'envahissement. Ceci découle du manque de connaissance des impacts de l'aménagement sur la dynamique des éricacées à l'échelle du paysage ; ainsi que du manque de compréhension des mécanismes écologiques qui font qu'une pessière coupée se transforme en pessière à éricacées et non en pessière dense. L'objectif général de cette étude est de cartographier la distribution spatiale des éricacées au niveau régional. Après l'acquisition des données et de leur
prétraitement, une interprétation experte a permis de produire les polygones pour l'entraînement des algorithmes de classification pour les images IKONOS. Deux séries de polygones
(couverture de surface et strate arborescente) découlent de ces opérations. Chaque série est
associée à l'une des deux stratifications et contient toutes les classes thématiques de cette
stratification. Une première segmentation fut appliquée sur une mosaïque de sept images IKONOS pour créer des objets spatiaux. Ces objets ont ensuite étés assignés à une classe
thématique en faisant appel à la logique floue disponible dans le logiciel eCognition. Deux types de cartes thématiques (strate arborescente et couverture du sol) sont créés à l'aide des sites d'entraînement issus de la photo-interprétation experte. Les résultats furent validés à l'aide des
placettes de sondage terrain (précision globale de 80 % pour les deux thématiques). 70% de
l'étendue des cartes produites sur la mosaïque IKONOS furent ensuite utilisée pour son
application à la classification de l'image Landsat-TM qui couvre toute la zone d'étude. Le 30%
non utilisé des cartes de la mosaïque IKONOS ont servi à valider les résultats cartographiques de la classification de l'image Landsat-TM (précision globale de 88.0% pour la carte arborescente et de 78.4% pour la carte de la couverture du sol). Les méthodes et cartes résultantes seront utiles
pour la gestion de la ressource forestière, en particulier pour la productivité de l'épinette noire
dans les régions nordiques.
Mots-clés :
Table des matières
Liste des figures iii
Liste des tableaux iv
Avant-propos v
1. Introduction 1
1.1 Contexte 1
1.2 Problématique 4
1.3 Objectifs et hypothèse 6
1.4 Motivation pour le choix de la méthode 7
2. Manuscrit scientifique 9
Abstract 9
2.1 Introduction 10
2.2 Materials and methods 12
2.2.1 Study area 12
2.2.2 Image datasets 13
2.2.3 Ancillary and validation data 14
2.2.4 Mapping - général approach 15
2.2.4.1 Mapping - data pre-processing 16
2.2.4.2 Mapping - land cover stratifications 17
2.2.4.3 Mapping - understory végétation from the IKONOS mosaic 18 2.2.4.4 Mapping - understory végétation from the Landsat-TM image 19 2.2.4.5 Mapping - overstory végétation at both resolutions 20
2.3. Results and their interprétation 21
2.3.1 Maps of understory from the IKONOS mosaic 21
2.3.2 Maps of understory from the Landsat-TM image 23
2.3.3 Maps of overstory 26
2.4. Discussion 28
2.5. Conclusion 31
Référencés 32
3. Précisions sur la méthode 36
3.1 Le protocole de mise en place de placette de sondage 36
3.2 La photo-interprétation numérique 41
3.3 L'approche orientée objet 44
4. Discussion 47
5. Conclusion 49
Références supplémentaires 51
Liste des figures
Fig. 1. La placette-échantillon (MRNF, 2008) 2
Fig. 2. La carte écoforestière (Gillis et Leckie, 1993) 3
Fig. 3. Semis d'épinette noire envahis par le Kalmia angustifolia et le Ledum 5 Fig. 4. La coupe avec protection de la régénération et des sols (MRNF, 2008) 6
Fig. 5. Study site and spatial coverage of data 13
Fig. 6. Methodological flow chart 16
Fig. 7. Subset areas of (a) the understory map and (b) the overstory map made using the IKONOS mosaic; and of (c)
the understory map and (d) the overstory map made using the Landsat scene 21 Fig. 8. Distribution quantitative des placettes de sondage terrain 40
Fig Fig Fig Fig Fig Fig
9. Distribution spatiale des placettes de sondage terrain sur la couverture de la mosaïque 41 10. Distribution quantitative des polygones issus de la photo-interprétation 43 11. Distribution spatiale des polygones issus de la photo-interprétation sur la couverture de la mosaïque 43 12. Paramètres du processus de segmentation (Definiens, 2006) 44 13 Fonctions discriminantes pour les classes thématiques 46 II-l. Contenu sommaire des placettes-échantillon permanentes (Noël et Rouleau, 1979) 54
Liste des tableaux
Table 1. Understory land cover classification systcm 18
Table 2. Errer matrix for the rcsulting understory map made with the IKONOS mosaic, assessed
by Project spécifie ground sample plots 23
Table 3. Error matrix for the rcsulting understory map made with the Landsat-TM image,
assessed by IKONOS map remainder (30%) 25
Table 4. Error matrix for the rcsulting understory map made with the Landsat-TM image,
assessed by project spécifie ground sample plots 26
Table 5. Error matrix for the rcsulting overstory map made with the Landsat-TM image, assessed
by IKONOS map remainder (30%) 27
Table 6. Producer's accuracy, commission and omission errors for the rcsulting overstory maps made with the IKONOS mosaic and the Landsat-TM image; both assessed by classes extracted
from the provincial stand maps and by project spécifie sample plots 28 Tableau 7. Légende des classes arborescentes et couverture de surface 37
Avant-propos
Structure du mémoire
Le présent mémoire est présenté en cinq chapitres. Le premier chapitre contient des informations sur le contexte du projet; la problématique qui a motivé cette recherche, les objectifs visant à combler les insuffisances évoquées par la problématique ainsi que la
motivation du choix de la méthode. Le deuxième chapitre présente le manuscrit décrivant le
projet et les résultats soumis au International Journal of Earth Observation and Geoinformation.
Parallèlement, on tient à mentionner que les méthodes et les résultats de cette étude ont
également été présentés lors d'une présentation d'un affiche au cours du Carrefour de la
recherche forestière à Québec le 19 au 20 septembre 2007 ainsi qu'à une présentation orale le 1"
novembre 2007 à Ottawa lors de la 29® session du Canadian Remote Sensing Society / American
Society for Photogrammetry and Remote Sensing 2007 Specialty Conférence (Résumé en annexe I). Le troisième chapitre traite de détails liés à la méthode non inclus dans le manuscrit. Enfin, le chapitre quatre élabore sur les discussions du manuscrit et le cinquième, les conclusions.
1. Introduction 1.1 Contexte
Avec raccroissement de la population humaine et l'amélioration de la qualité de vie, il n'y a
jamais eu une si grande pression sur les ressources naturelles que maintenant (Norton, 2002). Les
conflits entre la conservation et l'exploitation sont multiples et particulièrement évidents dans le
domaine des ressources forestières. Dans le monde entier, les paysages changent, les forêts sont vulnérables aux actions humaines et aux forces de la nature. Ils peuvent facilement être détruits
par l'urbanisation et perturbés par les feux, la eoupe, ete. Au Québec, la couverture forestière
s'étend sur une très grande superficie totalisant près de la moitié du territoire québécois soitenviron 402.1 million d'hectares (Resources Naturelles Canada, disponible sur
http://www.nrcan-mcan.gc.ca/stat/forest-eng.php, visité le 4 janvier 2009).
Étant donné l'importance d'assurer le fonctionnement correct des taux de croissanee des forêts en régénération, la cartographie détaillée des écosystèmes forestiers est nécessaire pour la
gestion durable des forêts. La donnée spatiale en foresterie est de différents ordres : de la placette
terrain à la carte écoforestière (e.g. 400 m^ vs 1 : 20 000, respectivement). Selon le Ministère des
Ressources Naturelles et de la Faune (2000), le Québec compte près de 200 000 sitesgéoréférencées, répartis sur l'ensemble du territoire forestier et étant définis comme des unités
d'échantillonnage. Ces sites, nommés placettes-échantillon (Fig. 1), sont visités et examinés attentivement par les forestiers. Seulement cinq pourcent de ces placettes-échantillon sont considérés comme étant permanentes (PEP), ceci implique que les forestiers planifient revisiter ces sites. Les 195 000 placettes-échantillons restantes sont dites temporaires (PET) et ne servent normalement qu'à un seul programme d'inventaire.
11.29 m vt. m
?
v-^ ijfT -i«r Fig. 1. La placette-échantillon (MRNF, 2008).Une placette-échantillon temporaire est un endroit spécifique dans un peuplement forestier où les caractéristiques de ce dernier et sa végétation sont mesurées une seule fois. Elles sont établies pour prendre des mesures sur la dynamique de la forêt, de l'arbre et du peuplement (e.g. espèces,
hauteur, diamètre, densité, volume) (Noël et Rouleau, 1979). Les attributs principaux mesurés dans les PET sont dormés en annexe IL La PEP diffère de la PET puisque les caractéristiques de
ce peuplement et sa végétation sont mesurées périodiquement. Elle fournit un répertoire des changements temporels des arbres et peut être utilisée pour représenter un peuplement avec des caractéristiques similaires (Noël et Rouleau, 1979). Les PEP sont établis dans des peuplements naturels pour pouvoir mesurer le taux de croissance et de mortalité, les changements dans la structure du peuplement et leur développement (Perron et Morin, 1999). Les données recueillies peuvent dès lors être utilisées pour développer des modèles de croissance et de rendement, pour valider les courbes d'indice de qualité de station, pour servir de base à d'autres études scientifiques ainsi que pour fournir de la documentation écologique aux photo-interprètes lors de la production des cartes écoforestières (Perron et Morin, 1999).
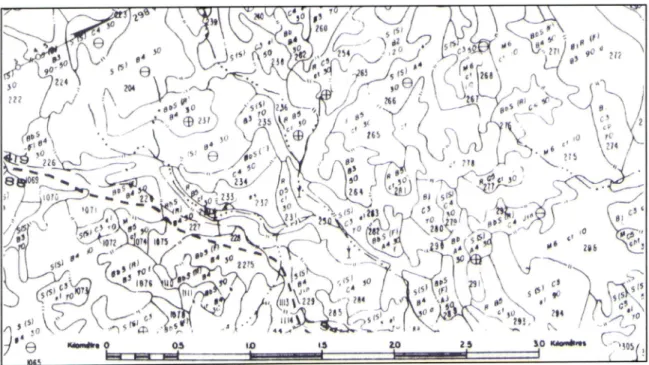
La carte écoforestière quant à elle, permet aux forestiers de mieux connaître l'état des forêts et de suivre leur évolution en tenant compte de l'historique des peuplements, des dépôts de
surface et du régime hydrique (Létoumeau, 2000). Les cartes écoforestières sont confectionnées à partir de l'interprétation des photographies aériennes et inclut les données forestières, écologiques et territoriales sous une même banque de données (Fig. 2). Elle est donc le moyen le plus utilisé dans la pratique pour synthétiser l'information spatiale des écosystèmes forestiers. Cette banque de données est utile en gestion forestière puisqu'elle permet d'estimer le volume
ligneux d'une région d'intérêt, d'en établir la problématique d'aménagement et d'y planifier les
interventions à long terme (Bérard et Côté, 1997). Elle permet également un transfert efficace etrapide des informations entre les gestionnaires, améliorant ainsi la communication et la prise de
décisions lors de la planification des travaux sylvicoles ainsi que lors du suivi de l'état des forêts. La carte en format vectoriel permet l'exploration et l'analyse des variables de distribution et deproximité qui étaient auparavant trop coûteuse et trop longue à produire avec les méthodes
conventionnelles. Beaucoup d'avantages sont associés au format vectoriel de la carte : la précision spatiale du produit au niveau de la prise de donnée facilite sa mise à jour.Avec l'avènement des systèmes d'informations géographiques (SIC), les intervenants
forestiers ont maintenant les outils nécessaires pour mieux planifier leurs activités forestières. À
mesure que s'intensifient leurs activités forestières, les forestiers ont besoin de données de plusen plus fiables et précises, ce qui présente un défi étant donné la grande superficie de nos forêts.
La photo-interprétation a été l'intermédiaire à la production des cartes forestières pour plus de 30
ans au Service des Inventaires Forestiers (Bérard et Côté, 1997). Cette expérience a démontré
qu'une méthode de production rigoureuse incorporant la donnée de télédétection aérierme est
essentielle afin d'obtenir un travail de bonne qualité.
CT 260 ■ W 2» m 5" 0 iti
V
ta !«• \ n ^ 226 ?T| é^069 ^ X 234 - C 50^ 264 233 lOlG M3 !«LVc' ' 0 1,, 2»0\ 7î? 107 'câ 074 1176 2 296 t • 5161 2275 y) 676 rr 264/I
22s '•.i\ «' «0 2 266 ^ 10 03,n
0» 10 ta uu rrFig. 2. La carte écoforestière (Gillis et Leckie, 1993).
Les méthodes de cartographie forestière nécessiteront toujours l'interprétation des
photographies aériennes puisqu'elles offrent une grande résolution spatiale à un prix raisormable.
Les photographies aériennes ont étés et continues à être la donnée de télédétection la plus utilisée
en foresterie, plus particulièrement dans l'évaluation des ressources naturelles à des fins d'inventaire et de suivi. Leur usage en foresterie a été anticipé à décroître avec l'avènement destechnologies avancées dans le domaine numérique et de télédétection satellitaire puisque les
données numériques (satellites et aériennes) offrent une meilleure résolution spectrale et radiométrique, et sont en format prêtes à être analysées. Malgré les prévisions que les appareils de photographies numériques élimineraient les photographies aériennes analogues, aucun autre
système ne peut offrir une résolution spatiale aussi fine que ces derniers. La résolution spatiale
offerte par ces images aide à l'identification d'objets ou caractéristiques d'un paysage lors de la
photo-interprétation.
Avec la venue du capteur satellitaire Earth Resources Technology Satellite en 1972, plus tard renommé Landsat-1, la donnée de télédétection satellitaire a établi son usage dans la détection et le suivi des ressources forestières. On l'utilise pour inventorier les régions éloignées, faire la mise à jour des inventaires conventionnels ainsi que pour faire le suivie des coupes et de la
régénération. On tire profit de l'utilisation de ces images puisque leur nature numérique offre la
possibilité d'automatiser (partiellement ou complètement) l'interprétation sous différentes
thématiques pour des grandes surfaces à l'intérieur des logiciels de traitement d'images.1.2 Problématique
Les gestionnaires des forêts boréales de Test canadien sont préoccupés par l'influence des
éricacées (Ledum, Kalmia angustifolia, et autres Vaccinii es.) sur la croissance de la régénérationde Tépinette noire {Picea mariana) (Franklin et al. 1994a; Wang 1994; Titus et al. 1995;
Yamasaki et al. 2002; Thiffault et al. 2005ab). Les éricacées, particulièrement le Kalmia,
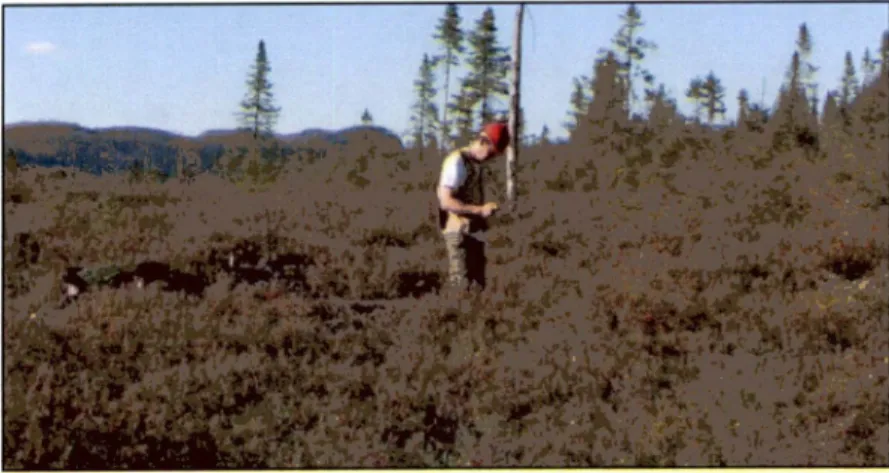
peuvent envahir un site rapidement suite à une coupe forestière ou un feu (Fig. 3). Cette situation
a pour conséquence une réduction du taux de croissance des semis d'épinettes, qu'ils soient
établis naturellement ou plantés. La compétition entre ces deux espèces végétales est fréquente au point d'entraîner une baisse du potentiel forestier (Wallstedt et al. 2002).Les éricacées sont des plantes opportunistes, relativement résilientes, tirant profit d'une grande variété de conditions de croissance. En effet, elles s'établissent à travers une vaste gamme de conditions environnementales. On les retrouve sur les marais de tourbe au sud, jusqu'aux sites
les plus secs au nord de la forêt boréale (Titus et al. 1995). Les plantes les plus âgées peuvent
avoir un système racinaire pénétrant à plus d'un mètre de profondeur, permettant leur survie pendant les périodes de grande sécheresse. Leur présence sur un site en régénération entraîne parfois une raréfaction des nutriments nécessaires à la croissance des jeunes épinettes (Titus et al. 1995; Wallstedt et al. 2002) et nuit aux entreprises d'exploitation forestière.
?
%
* îif »V '4^ VS
\ sa fi^ mm
vuFig. 3. Semis d'épinette noire envahis par le Kalmia angustifolia et le Ledum.
Thiffault et Grondin (2003) concluent qu'il est à ce jour impossible de proposer des scénarios sylvicoles promettant la résilience complète des semis propices à l'envahissement des éricacées. Cette difficulté provient du manque de compréhension des impacts des aménagements forestiers sur la dynamique des éricacées, ainsi que du manque de connaissance concernant les mécanismes écologiques d'interaction qui transforment une pessière perturbé en pessière à éricacées. Cependant, Boulanger (2005) démontre que l'invasion par les éricacées dans un semis d'épinettes dépend de la fertilité du sol ainsi que de la disponibilité de la lumière, deux facteurs étant significativement affectés par les pratiques sylvicoles. A ce sujet, Thiffault (2005b) compare les effets du scarifiage mécanique et de la fertilisation sur la croissance des semis d'épinettes. Il conclut que le scarifiage réduit la dominance du Kalmia et que la fertilisation augmente la croissance initiale des jeunes conifères réduisant ainsi la disponibilité de la lumière
pour les éricacées.
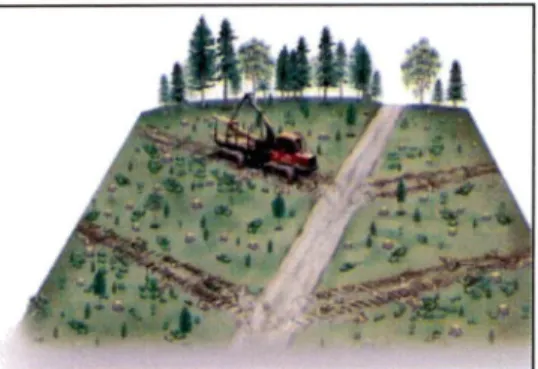
Les scénarios sylvicoles permettant d'assurer une croissance adéquate des semis doivent donc être définis, et ce, sans favoriser la croissance des éricacées. Les anciennes méthodes de coupe (coupe totale et partielle ; commerciale et pré-commerciale) semblent aggraver la prolifération des éricacées sur les parterres de coupe (Thiffault et al. 2005b). L'avènement en 1994, par le gouvernement du Québec, de la coupe avec protection de la régénération et des sols (CPRS) visait à préserver les jeunes pousses d'arbres et à éviter la détérioration des sols (MRNF, 2008).
La CPRS (Fig. 4) permet une plus grande intensité lumineuse au sol tout en laissant intacte une végétation arbustive parfois dominée par les éricacées. 11 est donc possible que cette pratique sylvicole entraîne la prolifération d'éricacées sur certains parterres de coupe.
«
*
k-I / I f
4l'- "5^
Fig. 4. La coupe avec protection de la régénération et des sols (MRNF, 2008).
Les baisses de productivité forestière dues à la présence d'éricacées ne font pas seulement l'objet d'études au plan écologique (Titus et al. 1995; Wallstedt et al. 2002; Yamasaki et al. 2002; Thiffault et Grondin, 2003; Thiffault et al. 2005ab) mais aussi au plan géomatique (Franklin, 1994ab; Wang, 1994; Joshi, 2004). L'application des technologies de la télédétection
permet de cartographier plusieurs attributs des espèces envahissantes (Franklin et al. 1994; Wang
1994; Joshi et al. 2004). À ce jour, la présence d'éricacées sur un site est prise en note seulement lors de l'échantillonnage forestier et écologique (placettes-échantillons permanentes et temporaires; points d'observations écologique). Au delà de ces sites d'échantillonnage, le Québec ne consacre aucun effort sur la cartographie de cette problématique. Il est donc intéressant d'entreprendre le développement d'une méthode de cartographie par télédétection satellitaire de la distribution spatiale des éricacées au niveau du paysage pour une région
nordique du Québec.
1.3 Objectifs et hypothèse
L'objectif général de cette étude est de cartographier la distribution spatiale des zones
d'envahissement par les éricacées au niveau régional. Quatre objectifs spécifiques visent à combler les insuffisances évoquées par la problématique: (/) produire une carte thématique des
zones de présence d'éricacées par télédétection satellitaire à très haute résolution spatiale (3.2
m)
; {il) valider la carte thématique en s'appuyant sur des placettes de sondage du terrain
spécifiques au projet ; {ni) définir une méthode de cartographie thématique de la distribution
d'espèces dans le paysage à partir d'images satellitaires à haute résolution spatiale (30 m) et (/v) valider la méthode de cartographie en s'appuyant sur les résultats cartographiques provenant
d'images à très haute résolution ainsi que par les placettes de sondage spécifique au projet. Nous émettons donc l'hypothèse que les zones de présence d'éricacées peuvent être détectées et cartographiées à l'aide de la télédétection à très haute et haute résolution spatiale (Franklin et al.
1994ah; Wang 1994).
1.4 Motivation pour le choix de la méthode
Les étapes menant à la production cartographique peuvent être résumé comme suit. Après l'acquisition des données et de leur prétraitement, une photo-interprétation experte a permis de
produire les polygones pour l'entraînement des algorithmes de classification pour les images
IKONOS. Deux séries de polygones (couverture de surface et strate arborescente) découlent de ces opérations. Chaque série est associée à l'une des deux stratifications et contient toutes les classes thématiques de cette stratification. Une première segmentation fut appliquée sur une mosaïque de sept images IKONOS pour créer des objets spatiaux. Ces objets ont ensuite étés
assignés à une classe thématique en faisant appel à la logique floue disponible dans le logiciel eCognition. Deux types de cartes thématiques (strate arborescente et couverture du sol) sont
créés à l'aide des sites d'entraînement issus de la photo-interprétation experte. Les résultats ont été validés à l'aide des placettes de sondage terrain. 70% de l'étendue des cartes produites sur la
mosaïque IKONOS
fut ensuite utilisé pour son application à la classification de l'image
Landsat-TM qui couvre toute la zone d'étude. Le 30% non utilisé des cartes de la mosaïque IKONOS a
servi à valider les résultats cartographiques de la classification de l'image Landsat-TM.
Katoh (2004) a suggéré que le niveau de détails disponible en combinant les photographies aériennes avec des images IKONOS peut potentiellement améliorer la classification. L'option d'utiliser les polygones issus de l'interprétation de photographies aériennes a donc été utilisée dans le contexte de notre projet. De plus, Kayitakire et al. (2002) ont démontré que l'information
généralisée au niveau de la parcelle à l'aide de l'approche orientée-objet appliquée sur l'imagerie
IKONOS peut servir à améliorer la précision d'une classification d'un écosystème forestier. Une
approche orientée-objet (avec le logiciel eCognition) a donc été adoptée afin de maximiser le
potentiel de nos données de haute résolution. Cette approche nous a permis d'abord de bénéficier
discriminantes établies sur les critères spectraux (bandes multispectrales, indices de végétation) et contextuels (relations aux objets voisins).
2. Manuscrit scientifique
Le manuscrit décrivant le projet et les résultats a été soumis au International Journal of Earth Observation and Geoinformation le 8 août, 2008.
A multi-resolution satellite imagery approach for large area mapping of ericaceous shrubs
in Northern Quebec, Canada.
Olivier R. van Lier'^, Richard A. Foumier', Robert L. Bradley^, and Nelson Thiffault^
' Centre d'Applications et de Recherches en Télédétection, Département de géomatique appliquée. Université de Sherbrooke, Sherbrooke, QC, Canada, JIK 2R1
^ Centre d'Étude de la Forêt, Département de biologie. Université de Sherbrooke, Sherbrooke,
QC, Canada, J1K2R1
^ Direction de la recherche forestière. Ministère des Ressources Naturelles et de la Faune du Québec, Québec, QC, Canada, GIP 3W8
Submitted 8 August 2008
^Corresponding author: olivier.van.lier@usherbrooke.ca
Abstract
Invasive ericaceous shrubs (e.g. Kalmia angustifolia, Rhododendron groenlandicum, Vaccinium spp.) may reduce the régénération and early growth of black spruce (Picea mariana) seedlings, the most economically important boréal tree species in Quebec. Dur study focused, therefore, on developing a method for mapping ericaceous shrubs from satellite images. The method intégrâtes very high resolution satellite imagery (IKONOS) to guide classifiers applied to
high resolution satellite imagery (Landsat-TM). An object-oriented image classification approach
was applied using Definiens eCognition software. An independent ground survey revealed 80% accuracy at the very high spatial resolution. We found that the partial use (70%) of classified
polygons derived from the IKONOS images were an effective way to guide classification
algorithms applied to the Landsat-TM imagery. The results of this latter classification (78.4%
overall accuracy) were assessed by the remaining portion (30%) of unused very high resolutionclassified polygons. We further validated our method (65.5% overall accuracy) by assessing the correspondence of an ericaceous cover classification scheme donc with a Landsat-TM image and results of our ground survey using an independent set of 282 sample plots. Discrimination of ericaceous shrub cover from other land cover types was achieved with précision at both spatial resolutions with producer accuracies of 87.7% and 79.4% from IKONOS and Landsat, respectively. The method is weaker for areas with sparse cover of ericaceous shrubs or dense tree cover. Our method is adapted, therefore, for mapping the spatial distribution of ericaceous shrubs and is compatible with existing forest stand maps.
Keywords: Multi-resolution, object-oriented classification, ericaceous shrubs, forestry
2.1 Introduction
Forests cover nearly half of Canada's land area (402.1 million hectares) and play a vital rôle in its socio-economic development. Forest management is predicated, therefore, on the sustainability of this resource for future générations. In northeastem Canada, foresters are increasingly preoccupied by the growth check of black spruce {Picea mariana (Mill.) BSP) seedlings induced by ericaceous shrubs such as Kalmia angustifolia L., Rhododendron
groenlandicum (Oeder) Kron & Judd, and Vaccinium spp. that can quickly invade sites following
harvesting or wildfires. These shrubs interfère with black spruce growth through direct compétition for resources (e.g. Thiffault et al., 2004) and by modifying soil properties such as
pH, litter décomposition and nutrient mineralization rates (e.g. Joanisse et al., 2007). The
transformation of productive forest stands into heaths poses a threat to the sustainability of Canada's forest sector; adéquate monitoring tools must be developed to assess the magnitude ofthe problem. It is thus essential that we develop a method to map ericaceous swards, as this
would give us an indication of which conditions favor their encroachment on disturbed forest
sites.
Remote sensing technologies offer many options which are compatible to détection, mapping,
and monitoring of invasive species (Wang, 1994; Joshi et al., 2004). Mapping the presence of
ericaceous shrubs on regenerating forest sites bas already been achieved with 96% overall accuracy through the interprétation of high resolution Compact Airbome Spectrographic Imager
(CASI, 2.5 m spatial resolution) images (Franklin et al., 1994a). Likewise, Franklin et al. (1997) were able to distinguish three différent classes of ericaceous shrub cover (low, moderate, and heavy) on disturbed sites with high accuracies (87-99%) using high spatial resolution imagery (CASI). The use of very high spatial resolution imagery is, however, costly and time-consuming for large-scale détection purposes. Kalmia angustifolia can be detected with lower resolution images (i.e. Landsat-TM), but with a concomitant lower overall accuracy of 82% (Franklin et al., 1994b). The studies from Franklin et al. were limited to the détection of these shrubs at a local scale mapped on one image and confmed to disturbed sites. There is, therefore, a need to develop
a method to detect the abondance of ericaceous shrubs for more diverse forest conditions and to
expand the application to mapping ericaceous shrubs on a régional scale consistent with forest
management plarming.
We now face the interesting situation of selecting images from many alternative technologies
varying in ail spatial and spectral resolutions. Very high resolution aerial photographs continue
to be the most used remotely sensed data in forestry, specifically in evaluating natural resources for inventory and monitoring purposes (Howard, 1992). Sometimes, aerial photographs have been used to defme a posteriori sample sites derived from an unsupervised classification's
spectral clusters (Kindscher et al., 1998). Research has also shown high resolution IKONOS satellite imagery to be relevant for the extraction of forest stand information and mapping
(Kayitakire et al., 2002). Katoh (2004) concluded that information on individual trees can be
acquired by combining aerial photographs with IKONOS images. This same principle was
applied to defme the data used to train classifiers for the thematic classification of the IKONOS
mosaic.Object-oriented based image classification has sometimes been found to be superior in
accuracy to traditional pixel-based classification approaches (Rego and Koch, 2003; Oruc et al.,
2004), specifically for high resolution image analysis (Xiaoxia et al., 2004). If surface texturesare complex, polygon-based multi-resolution segmentation can be bénéficiai for an initial
delineation of différent land cover types (e.g., Hess et al., 2003). The segmentation process is abottom-up region-merging procédure which begins with single-pixel segments (Defmiens, 2006).
The multi-resolution segmentation allows for object création at différent scales, thus facilitating the thematic classification of larger objects (i.e. forested areas, disturbances, waterbodies, etc...)
to fmer objects (i.e. ericaceous shrub dominated sites). The need for an ericaceous shrub
mapping method which takes advantage of very high spatial resolution information applied at a super-regional level on high spatial resolution information is essential to further understand the spatial distribution of these species. The complexity of the species' distribution forces, however,
the use of a classification method beyond the traditional classification techniques (i.e., pixel-based supervised maximum likelihood).
The aim of this study was to provide a method of mapping the percent land cover of ericaceous shrubs at a régional scale which could be applied to larger eastem boréal régions of Canada. We integrated multi-resolution data as this approach bas proven to be bénéficiai for mapping large areas (Yang et al., 2003). The mapping method was designed for two spatial resolutions: (1) very high spatial resolution (with pixel of ~ 3 m) for detailed maps at the local scale, and (2) high spatial resolution (with pixel of ~ 30 m) for régional maps. In so doing, we developed a new procédure to use very high spatial resolution images to guide the thematic classification of a high spatial resolution image. The method is compatible with procédures and
datasets used in the existing forest inventory.
2.2 Materials and methods
2.2.1 Study area
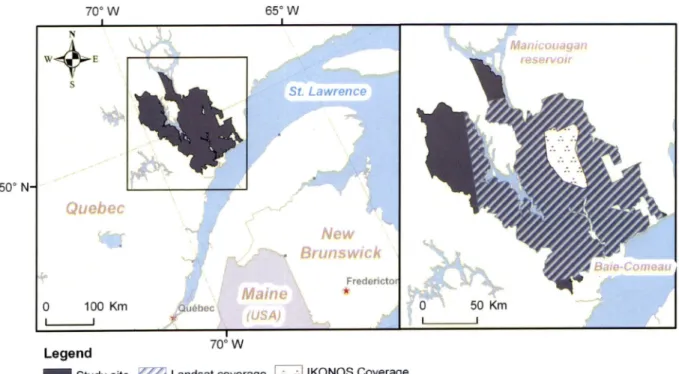
The study area (19,178 km^)
is located on the North shore of the St. Lawrence River, 350 km
Northeast of Quebec City and 105 kilometers North of the Town of Baie-Comeau, Quebec,
Canada (Fig. 5). It is situated in the boréal shield ecozone (Lowe et al., 1994) comprising many
lakes, rivers, peatlands and bogs in a rolling topography of pre-Cambrian Canadian Shield. Rock
outbreaks occupy approximately 40% of the land area, especially présent on vast tabular peaks,
along major waterbodies and on steep slopes. A thin layer of glacial till material often covers
moderate slopes and certain low rising hills, while thick till can be found in thalwegs and along
easy sloped interfluves (Robitaille and Saucier, 1998). Fluvioglacial deposits occupy the larger
valleys of the area (Robitaille and Saucier, 1998). The climate is classified as Subpolar
Subhumid Continental (Robitaille and Saucier, 1998) and species diversity is much lower than inany temperate deciduous forests further south. The growing season is but 140 days and annual
average températures range between -2.5 to 0.0 °C. Précipitation is abvmdant with an annual
average of 1, 300 mm,
of which 35-40% fall as snow. The major tree species are black spruce
(Moench.) Voss), white birch (Betula papyrifera Marsh.), aspen {Populus tremuloides Michx.) and jack pine (Pinus banksiana Lamb.). The study area has been logged for a century and is subject to a natural fire disturbance cycle of 270 years (Bouchard et al., 2008). Ericaccous shrubs dominate many disturbed sites within the study area.
70° W 65° W 50° N-Mantcouagan SI Lawrence m"
m
« Quebecm
New Brunswick àaie-Coineâ Fredenctor Maine 50 Km 0 100 Km 1 I Legend .Québec \ s f i^SA) V 70° WStudy site Landsat coverage I "1 IKONOS Coverage
Fig. 5. Study site and spatial coverage of data.
2.2.2 Image datasets
The multi-resolution image dataset for this project is composed of 152 aerial photographs, seven adjacent IKONOS images and one Landsat-TM image which covers 15,580 km2 of the
study site (Fig. 5). Black and white aerial photographs (1:15,000) were taken between July and
September 1999 using a WILD caméra with a focal length of 151.413 mm. The photographs
were available in printed format, were digitized at 1200 dpi and conform to forest surveying standards set by the provincial govemment. Aerial photographs were taken to facilitate stereoscopic interprétation with 60% overlap within the continuons flight line. The large areas made available for stereoscopic digital interprétation (327.64 km2) offered great potential for the sélection of homogeneously pure and disperse spatially distributed sample sites.Seven IKONOS images were joined in a mosaic to cover a continuons area of 1,397 km2 within the study site. Ail IKONOS images were taken around nadir with scan azimuth ranging
from 180.05° to 180.07° in reverse, and 0.06° in forward, scan directions. These images were
acquired on either July 8, 13 or 16, 2005 at Greenwich Mean Times varying from 15:48 to 16:06 (i.e.l 1:48 to 12:06 local time). AU images have a spatial resolution of 3.2 m per pixel throughout their four spectral bands (1: 0.45 - 0.52; 2: 0.52 - 0.60; 3: 0.63 - 0.69; 4: 0.76 - 0.90 m). No processing was applied to the radiometric values beyond what was applied by the image provider's algorithm to reduce sensor anomalies. AU images were purchased with géométrie correction made by the image provider and this proved to be accurate enough with error well
within 5 m when it was linked with other spatial products. The mosaic was created with
Geomatica OrthoEngine® software (©PCI Geomatics, Richmond Hill, Ontario, Canada) to facilitate image manipulation and interprétation. In this process, histogram color balancing (©PCI Geomatics) was computed using the overlap area between images while cutlines were drawn using a combination of minimum grey and gradient values to détermine its optimum location.
The Landsat-TM image was acquired on the 15th of July 2005 (path 12, row 25). It was made available with five spectral bands (1: 0.45 - 0.52; 2: 0.52 - 0.60; 3: 0.63 - 0.69; 4: 0.76 - 0.90; 5: 1.55 -1.75 -"m) at a spatial resolution of 30 m per pixel. Neither radiometric nor géométrie normalizations were applied beyond what was already done by the image provider for the image product at level IG (Systematic Correction).
2.2.3 Anciilary and validation data
Ancillary data were acquired from forest stand maps (1:20,000), 71 permanent and temporary sample plots as well as 138 ecological observation points (Saucier, 1994) established by the Quebec Ministry of Natural Resources and Wildlife. The stand maps and sample plots informed us on stand âge and tree species composition whereas ecological observation points included détails on topography, soil taxa, geological parent material, drainage class and understory végétation (including the presence of ericaceous shrubs). We established 282 supplementary validation plots (minimum area of 0.09 ha) with variable land cover. AU of these plots were
located 50 to 300 m from the roadside, and at least 50 m away from a river, a lake or a recently
disturbed stand (i.e., clearcut, bum or windthrow). Spectrally homogeneous polygons were delineated on the IKONOS mosaic using a segmentation algorithm from eCognition software (©Defmiens, Mvmich, Germany) with a 'scale' parameter set at 15. The centroid of each polygon
was then used as a potential point to establish a plot. Points were located in the field with a GPS with 3-9 m accuracy. For each plot, we noted latitude and longitude, understory and overstory
végétation, and we estimated the percent cover of these végétation groups. Five photographs of each plot were taken, one of the ground cover and one in each cardinal direction.
2.2.4 Mapping - général approach
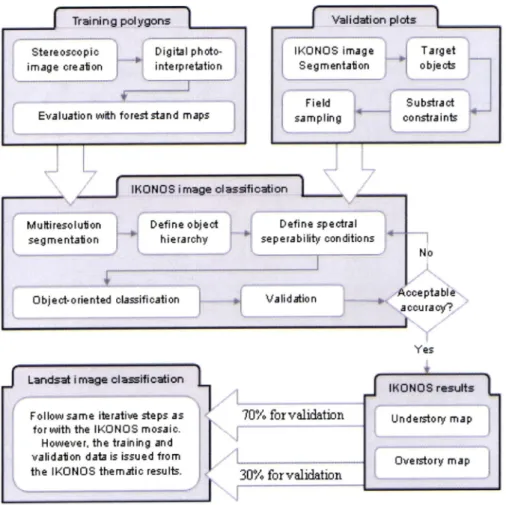
The methodological flow chart depicted in Fig. 6 illustrâtes the important steps followed for mapping ericaceous shrubs. Training datasets in the form of polygons for ail thematic classes identified for mapping were produced with the assistance of an independent expert in aerial photo-interpretation. The polygons created from this interprétation were used as training areas for the object-oriented classification of the IKONOS mosaic. Once validated with ground-truthing plots, the resulting thematic map was randomly divided in two groups of polygons: 70%
were used to train the classifiers for the Landsat-TM imagery; the remaining 30% were then used
to validate the mapping results derived from the Landsat-TM dataset. This proportion for polygon division was équivalent in ail map classes. The Landsat-TM image classification followed the same itérative procédure applied to the IKONOS mosaic, using différent training data. The validation plots were also used to assess the results from the classification of the Landsat-TM image. Four maps were created at two resolutions, that is, one map of the understory and one map of the overstory for each of the IKONOS and Landsat-TM resolutions.
Irai ni n g polygons
Stereoscopic Image creaton
Digital photo-intecp relation
Evaluation with forest stand maps
\ Validation plots IKONOS image Segmentation Target objecte ! Field sampling Substract constrainte M uiti résolut on segmentaton
H
IKONOS image classification
hierarchy |~ seperability conditions
^ rr
Object-oriented classification Validation
No Accepta biè--. accuracy?/ _J > Y
Landsat i mage classification
Follovusame itérative steps as
forvuith the IKONOS mosaic.
Hcwever, the train in g and
validaton data is issued from the IKONOS thematic resuite.
70% for validation .-1
Jm
30% forvalklationS
Yes ... IKONOS results 1 Understory map Overstory mapFig. 6. Methodological flow chart.
2.2.4.1 Mapping - data pre-processing
The use of several image and data types of différent sources and seales imposed careful data
pre-processing to ensure proper spatial referencing. Ail spatial data were georeferenced to the
same cartographie projection system and same datum (Universal Transverse Mercator zone 19; North American Datum 1983) to insure proper géographie eompatibility between the datasets.Aerial photographs were used to ereate 54 digital stereoscopic models within DVP-GS' software (©Groupe Alta, Quebee City, Canada). Eaeh model comprised two digitized
photographs in which we defmed (1) the interior orientation: reconstrueting the interior
perspective with respect to the projection eenter; (2)
the relative orientation: defming the spatial
relationship between two photographs having a central area in common; and (3) the absolute orientation: establishing the correspondence between the stereoscopic model and its géographieThe seven IKONOS images were created as a mosaic to enable analysis on one data entity. No atmospheric or radiometric distortions were visually apparent on any of the satellite imagery. Végétation indices were calculated for both tbe IKONOS mosaic and Landsat-TM image and
were added as a band to tbe original image dataset. Normalized différence végétation index (NDVI) was first calculated (Jensen, 2004). Next, tbe second Tasseled Cap component (TCC),
often called tbe Greeness component, was calculated from tbe IKONOS imagery as suggested by Home (2003) and Navalur (2007). Tbe TCC, previously used for multi-resolution image segmentation and involved in tbe object-oriented classification process of tbe mosaic, is defmed
as follows;
U2 = - 0.31 IXblue - 0.356Xgreen - 0.325Xred + 0.819Xnir
(Home 2003)
wbere Ua is tbe second Tasseled Cap band, and for a spécifie pixel, let Xi for / = blue, green, red, and near infra-red represent tbe DNs in eacb of tbe respective bands of tbe IKONOS sensor.
2.2.4.2 Mapping - land cover stratifications
Available land cover stratifications of stand cover types usually deal witb tbe dominating
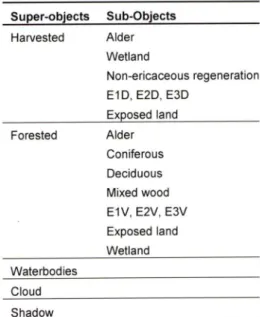
tree-level components of tbe landscape only; tbey do not include tbe understory layers (e.g. Friedl et al., 2002; Wulder et al., 2003). As a resuit, we needed to define two separate sets of classes for tbe Project associated witb two resulting maps: understory and overstory. Overstory classes (Table I) were an aggregated set of classes selected from tbe current provincial forest service's stand map stratification scbeme (Létoumeau et al., 2003). For understory classes, a new stratification scbeme was devised witb particular attention to ericaceous sbmb cover (Table I). Tbis stratification comprised mutually exclusive classes, exhaustive cover of potential land cover classes and bierarcbically consistent cartographie strata (Jensen, 2004). Some classes for tbe understory map were similar from tbe one adopted by tbe provincial Ministry of Natural
Resources and Wildlife, namely for tbe forested impervious and wetland classes. However, as
tbeir stratification excluded ericaceous strata, we added seven classes to tbis scbeme. Classes
EID, E2D and E3D identify percent cover of ericaceous sbmbs in barvested areas of 76-100%, 51-75% and 25-50%, respectively. Similarly, tbe same percent cover of ericaceous sbmbs found in tbe understory of forested or fully vegetated areas were represented by classes EIV, E2V and
E3V. The seventh class, NER, denoted regenerating sites with no ericaceous shrubs. Although both understory and overstory maps were produced, this paper focuses primarily on the
validation and interprétation of the understory map.
Table 1. Understory land cover classification System.
Super-objects Sub-Objects
Harvested Aider Wetland
Non-ericaceous régénération
E1D, E2D, E3D Exposed land
Forested Aider
Coniferous
Deciduous MIxed wood
EIV, E2V, E3V
Exposed land
Wetland Waterbodies
Cloud Sfiadow
Note 1: ElD, E2D and E3D identify percent cover of ericaceous shrubs in harvested areas of 76-100%, 51-75% and 25-50%, respectively. Similarly, EIV, E2V and E3V identify the same
percent cover of
ericaceous shrubs found in the understory of forested or fully vegetated areas.
2.2.4.3 Mapping - understory végétation from the IKONOS mosaic
Polygons of uniform land cover classes for both the understory and overstory thèmes, which
served as training data for the IKONOS thematic classification, were produced by an expert
aerial photo-interpreter using digital stereoscopic models. The interprétation was guided by the
available ancillary data excluding forest stand maps. To ensure the mutual exclusiveness of each
class, the photo-interpreter selected only homogeneous samples associated (i.e. there was to be
no visible ericaceous understory in any forested samples). Selected polygons ranged from 0.5 to 12 ha. A cross-reference with the forest stand map validated the training data. The interprétation
generally showed little to no différences with the forest stand map.
A
first large-scale image segmentation was carried out solely on the second component of the
Tasseled Cap transformation, enabling the classification of large bodies of water. Unclassified
objects were merged and re-segmented using the blue, green, red and near-infrared bands of the mosaic (weighed 0.3, 0.3, 0.3 and 0.9 respectively) permitting the classification of smaller waterbodies, disturbance sites, exposed land, forested terrain, cloud and shadow. The classification of these groups within eCognition software was refined by itérative manual editing and segmentation at finer levels using ail six weighted bands (four multispectral, NDVI, TCC) together with software utilities (discriminatory functions, feature view, 2D feature space plot). The training polygons from the photo-interpretation were then imported to guide the standard nearest-neighbor classifier to classify the sub-objects in relation to their super-objects (Table 1).
We used the error matrix to assess the accuracy of our results and to characterize the errors
(Congalton, 1991; Congalton and Green, 1993; Foody, 2002; Wu and Shao, 2002). A nearest-neighbor classification was then performed and error matrix derived from the validation plots serving as ground truth. Class descriptions for which the accuracies were low were re-examined and addition, subtraction, or définition of new threshold parameters on object features were redefined according to the class's respective sample space. This was done recursively until satisfactory results were achieved.
2.2.4.4 Mapping - understory végétation from the Landsat-TM image
The classification process for the high resolution Landsat-TM imagery followed the same itérative steps as for the very high resolution IKONOS mosaic (Fig. 2). However, since statistical
variance of pixel spectral values decreases with poorer resolution (increasing the proportion of
mixed pixels), there was a need to increase sample dimension. The training and validation data
for this classification and accuracy assessment were therefore polygons produced from the IKONOS mosaic instead of the aerial imagery. This involved separating training from validationpolygons automatically from the resulting thematic IKONOS derived map. A random sélection
of 70% of polygons of each mapping class was applied to the mosaic's classification results and
imported as a training mask to the Landsat-TM image classification. Fine polygons were also
generated from the segmentation of
the Landsat-TM image. Sample polygons were selected from
the Landsat-TM image when a minimum overlap of 80% was obtained between the Landsat-TMpolygon and the corresponding polygon area from the training mask. The remaining 30% of the
polygons from the mosaic's classification were imported to be used for accuracy assessment. A
supplemental évaluation of the results was donc using an errer matrix between the classification
results and the validation plots made specifically for this project.
2.2.4.5 Mapping - overstory végétation at both resolutions
The methodological steps involved in the overstory mapping followed the same protocol as for the understory mapping. Additional accuracy assessments were made by comparing these maps with the forest inventory and sample plots. Provincial forest management inventory stand maps were used to generate land cover reference data. The stand maps did not include classes which were defmed through our stratification and needed to be labelled accordingly. Seven
classes were extracted directly from the inventory maps and used in the accuracy assessment
process (water; wetland, aider, coniferous, deciduous, mixed wood and exposed land). For our purposes, accuracy was first assessed by the IKONOS map (remainder of 30%). In support of this validation, an assessment was carried ont by comparing the overstory map pixel value directly to the label of the inventory polygon. Further validation of the results was assessed by comparing the classification results with the validation plots. Only sample plots associated to one thematic class were used (e.g. a plot of class EIV and coniferous was not taken in account) otherwise biasing the validation by over sampling forested classes; namely coniferous.
a
b)
&
it: 41 C r ILegend 76-100% ericaceous cover on harvested Coniferous HIIH Water
51-75% ericaceous cover on harvested | | Deciduous mi Wetland
25-50% ericaceous cover on harvested mm Mixed wood mB Impervious 76-100% ericaceous cover on forest [. | Non-ericaceous régénération
51-75% ericaceous cover on forest ||^| Aider g 25-50% ericaceous cover on forest |H^[| Harvested '—
500 Meters
_J
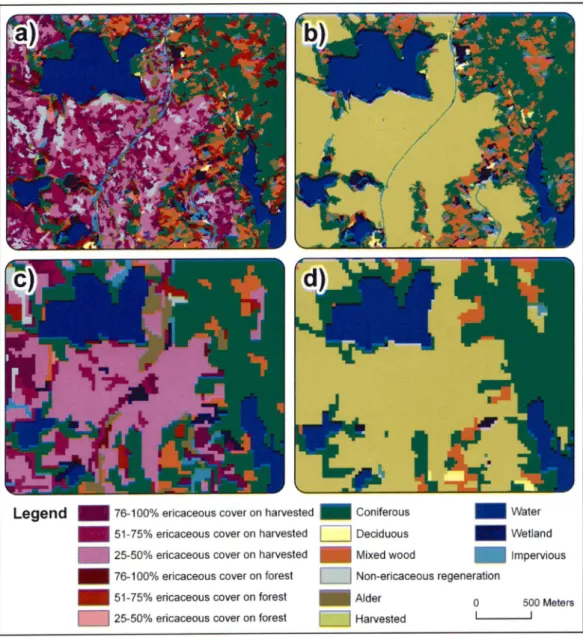
Fig. 7. Subset areas of (a) the understory map and (b) the overstory map made using the IKONOS mosaic; and of (c) the understory map and (d) the overstory map made using the Landsat scene.
2.3. Results and their interprétation
2.3.1 Maps of understory from the IKONOS mosaic
Fig. 7a illustrâtes a subset area of the understory map derived from the IKONOS mosaic. The
error matrix of this classification (Table 2) was derived through a comparison with the validation
plots and gave an overall classification accuracy of 69.9% with a Kappa coefficient (K)
of 0.67
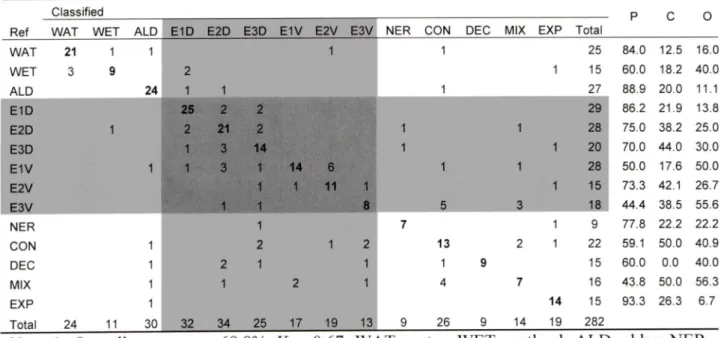
for the most detailed understory classes. The overall classification accuracy was 79.8% (K of0.72) when ericaceous shrub density classes were generaiized to a single ericaceous elass. Spectral confusion is noticeable between ericaceous shrub cover classes. Ericaceous shrub cover was classified with producer's class accuracies ranging from 44.4% (E3V) to 86.2% (ElD). Confusion was apparent between density classes and supported by the higher overall accuraey of merged density classes (i.e. generaiized). The discrimination level between EIV and E2V is
lower than the one between classes E2V and E3V. For elass EIV, we note that 33% of the 18.2% commission error and 43% of the 50.0% omission error are associated to its neighboring cover
class E2V. Similarly, for class E2V, we note that 75% of the 42% commission error and 25% of
the 27% omission error are related to elass EIV. Overestimation of class E3D is apparent. Small errors were observed between ElD; E2D, EIV, E2V, E3V, coniferous forest, deciduous forest,
non-ericaceous-regeneration sites and the E3D class. The error matrix therefore shows that ericaceous shrubs ean generally be identified from other classes with a high level of accuraey (i.e. producer's accuraey of 87.7% with commission and omission errors below 15%). However, it is observed that most of the confusion in the density classes occurs between parented classes of the général ericaceous eategory (e.g. EIV with E2V; or ElD with E2D).
Ericaceous shrubs found in the forest's understory were difficult to spectrally discem from other classes from the proposed stratification since tree types found in these areas varied in density and essence as the understory varies in land cover (e.g. mosses, ericaceous shrubs,
impervious outbreaks, aider, fallen trees and/or débris). Hence, there is some spectral confusion
with other classes of the proposed land cover stratification. The errors in the ericaceous shrub discrimination (shaded in Table 2) are mainly a resuit of eonfusion with forested classes (i.e. coniferous, deciduous and mixed forest) accounting for 68% of the 13% commission error and65% of the 12% omission error. Therefore, the confusion between ericaceous shrubs and forested
Table 2. Error matrix for the resulting understory map made with the IKONOS mosaic, assessed by Project spécifie ground sample plots.
Classified
Ref WAT WET ALD IËÏd"E2D E3D EIV E2V E3V NER CON DEC MIX EXP Total
WAT 21 1
A
1 1 25 84.0 12.5 16.0 WET 3 91 2
1 15 60.0 18.2 40.0 ALD 24 1 1 1 27 88.9 20.0 11.1 E1D i 25 2 2 86.2 21.9 13.8 E2D 1 ■i 2 21 2 ' ■4PU 1
1 28 75.0 38.2 25.0 E3D1 ^
3 14 1 20 70.0 44.0 30.0 E1V 1 i 1 3 1 14 6 1 1 28 50.0 17.6 50.0 E2V 1 1 11 1 1 15 73.3 42.1 26.7 1 T'* ' „ 8 «i S. ift 44.4 38.5 55.6 NER 1 7 1 9 77.8 22.2 22.2 CON11
2 1 2 13 2 1 22 59.1 50.0 40.9 DEC 11 2 1 1 1 9 15 60.0 0.0 40.0 MIX11
1 2 1 4 7 16 43.8 50.0 56.3 EXP 1 14 15 93.3 26.3 6.7 Total 24 11 30 32 34 25 17 19 13 9 26 9 14 19 282Note 1: Overall accuracy = 69.9%. K = 0.67. WAT, water; WET, wetland; ALD, aider; NER, non-ericaceous régénération; CON, coniferous; DEC, deciduous; MIX, mixed wood; EXP, exposed land; ElD, E2D, E3D, EIV, E2V, E3V are ericaceous shrub densities; F, producer's accuracy (%) for the class; C, commission error (%) for the class; O, omission error (%) for the
class.
Note 2: Merged shaded area represents the more général ericaceous land cover. Overall aceuracy
= 79.8%. K = 0.72%.
2.3.2 Maps of understory from the Landsat-TM image
Subset areas of the understory map made from the Landsat-TM image is illustrated in Fig. 7c.
The comparison of the Landsat-TM classification results with the 30% validation polygons of the
IKONOS mosaic (Table 3) gave an overall classification accuracy of 70.8% (K of 0.58) for the
more detailed land cover classes. As with the IKONOS classification, ericaceous density classes
were generalized to a single ericaceous class resulting in a higher overall classification accuracy of 78.4% (K of 0.67). The class spécifie discriminations are more sparsely distributed than the IKONOS classification results due to the larger validation dataset; i.e. greater commission and
omission errors were observed. Ericaceous shrub percent cover classes are classified with higher
producer's accuracies than for the IKONOS mosaic with values ranging here from 44% (E3V) to 56% (ElD, E3D). Small errors are observed speckled across the matrix with no major class diserimination problems. Significant confusions are seldom in occurrences with most being acceptable and understandable as such is between mixed and coniferous forests. Table 3 also informs us of the degree of confusion between ericaceous shrub density classes within its respective generalized class (shaded). We note that discriminations errors assoeiated with the generalized ericaceous shrub class are largely due to confusion with the coniferous class (54% of
the 23% commission error; 32% of the 21% omission error).
The second évaluation resulted in an error matrix which compares the final classification and the validation plots taken as ground truth (Table 4). The overall classification accuracies were (a) 53.5% (K of 0.44) for the detailed understory classes and (b) 65.5% (K of 0.55) when ericaceous density classes were generalized to a single ericaceous class. Similar to the assessment based on the IKONOS map remainder, omission errors assoeiated with the generalized ericaceous shrub class are largely due to confusion with the coniferous class (71% of the 30% omission error). Conversely, the majority of the commission error is assoeiated with the aider class (46% of the 12% commission error). This assessment reveals ericaceous shrub cover classified with class accuracies ranging now from 16% (E3V) to 75% (E3D). An over estimation of the E3D cover is noted and accounts for such a high individual class producer's accuracy. Again, confusion in the density classes occurs mainly between parented classes of the général ericaceous category and of second importance, the coniferous class.
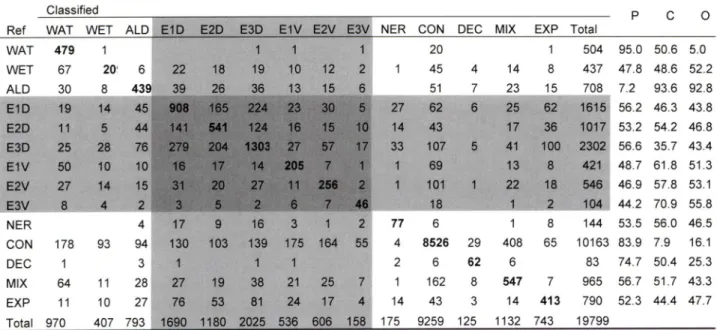
Table 3. Error matrix for the resulting understory map made with the Landsat-TM image,
assessed by IKONOS map remainder (30%).
Classified
Ref WAT WET ALD E1D E2D E3D EIV E2V E3V|NER CON DEC MIX EXP Total
WAT 479 1 1 1 1 j 20 1 504 95.0 50.6 5.0 WET 67 20 6 22 18 19 10 12
2 1
1 45 4 14 8 437 47.8 48.6 52.2 ALD 30 8 439 39 26 36 13 15 6 ^ 51 7 23 15 708 7.2 93.6 92.8 E1D ' "19'" 14 45 908 165 224 23 30 5 '^25'"e/ T615 56.2 46.3 43.8 E2D 11 5 44 141 541 124 16 15 10 14 43 17 36 1017 53.2 54.2 46.8 E3D 25 28 76 279 204 1303 27 57 17 33 107 5 41 100 2302 56.6 35.7 43.4 EIV 50 10 10 16 17 14 205 7 1 1 69 13 8 421|:48.7 61.8 51.3 E2V 27 14 15 31 20 27 11 256 2 1 101 1 22 18 5461 46.9 57.8 53.1 E3V ■8 4»îj5■"p 2 i '. 3 5 2 6 7 46 4 44.2 70.9 55.8 NER 4 17 9 16 3 1 2 77 6 1 8 144 53.5 56.0 46.5 CON 178 93 94 130 103 139 175 164 55 4 8526 29 408 65 10163 83.9 7.9 16.1 DEC 1 3 1 1 1 2 6 62 6 83 74.7 50.4 25.3 MIX 64 11 28 27 19 38 21 25 7 1 162 8 547 7 965 56.7 51.7 43.3 EXP 11 10 27 76 53 81 24 17 4 14 43 3 14 413 790 52.3 44.4 47.7 Total 970 407 793 1690 1180 2025 536 606 158 175 9259 125 1132 743 19799Note 1: Overall accuracy = 70.8%. K = 0.58%.WAT, water; WET, wetland; ALD, aider; NER,
non-ericaceous régénération; CON, coniferous; DEC, deciduous; MIX, mixed wood; EXP, exposed land; ElD, E2D, E3D, EIV, E2V, E3V are ericaceous shrub densities; F, producer's accuracy (%) for the class; G, commission error (%) for the class; O, omission error (%) for the
class.
Note 2: Merged shaded area represents the more général ericaceous land cover. Overall accuracy
= 78.4%. K - 0.67%.
An overview of Tables 2 and 3 reveals high producer's accuracies assessed between polygons
classified as ericaceous and their respective validation data (88% from IKONOS and 79% from
Landsat-TM). Comparing the accuracies for the density classes with their generalized one, we
confirm that the residual confusion is essentially confmed to within similar classes. Results were
lowest (producer's accuracy of 44% at both spectral resolutions) where ericaceous shrub percent
cover was between 25% and 50% of a forested or fully vegetated area's understory.
Table 4. Error matrix for the resulting understory map made with the Landsat-TM image, assessed by project spécifie ground sample plots.
Classified p c
0 Ref WAT WET ALD E1D E2D E3D EIV E2V E3V NER CON DEC MIX EXP Total
WAT 14 3 8 25 56.0 30.0 44.0 WET 5 6 1 1 1 1 15 40.0 40.0 60.0 ALD 14 1 4 -, 5 1 26 19.2 68.8 80,8 E1D rTf ■ "2" 2 1 1 29 51.7 0.0 48.3 E2D r 11 13 1 2 27 40.7 35.3 59.3 E3D • Ift ' 11 15 1 2 2 20 75.0 69.4 25.0 E1V 1 ■■■ r 1 2 12 2 g 1 28 42.9 20.0 57.1 E2V 1 7 4 2 15 46.7 30.0 53.3 E3V 2 3 ma 16.7 0.0 83.3 NER 1 8 9 88.9 11.1 11.1 CON 1 1 18 20 90.0 76.0 10.0 DEC 1 3 8 1 13 61.5 0.0 38,5 MIX 1 1 11 3 16 18.8 57.1 81.3 EXP 1 13 14 92.9 38.1 7.1 Total 20 10 16 15 17 49 15 10 3 9 75 8 7 21 282
Note 1: Overall accuracy = 53.5%. K = 0.44%.WAT, water; WET, wetland; ALD, aider; NER, non-ericaceous régénération; CON, coniferous; DEC, deciduous; MIX, mixed wood; EXP, exposed land; ElD, E2D, E3D, EIV, E2V, E3V are ericaceous shrub densities; P, producer's accuracy (%) for the class; G, commission error (%) for the class; O, omission error (%) for the
class.
Note 2: Merged shaded area represents the more général ericaceous land cover. Overall accuracy
= 65.5%. K = 0.55%.
2.3.3 Maps of overstory
A subset area of the overstory maps at both spatial resolutions are presented in Fig. 7b and 7d
and are made from the IKONOS mosaic and the Landsat-TM image, respectively. These
correspond with the same subset areas illustrated for the understory in part b) of both figures.
Classification accuracies vary depending on the validation approach. For the Landsat-TM map, an overall accuracy of 88.0% (K of 0.64) was observed when assessed from the IKONOS map remainder (Table 5); 77.9% (K of 0.46) from provincial stand maps and 57.0% (K of 0.48) from sample plots (Table 6). Variability of the overall accuracy was also présent for the overstory map derived from IKONOS. Here, we note an overall accuracy of 79.4% (K of 0.76) when assessed
from sample plots and of 62.9% (K of 0.32) when assessed from the stand maps. Overestimation of the coniferous class is apparent through ail validation schemes and significant confusion exits between the latter and the mixed wood class (45% of the commission error; 56% of the 1.5% omission error). Other significant confusion is présent between water and the coniferous class accounting here for 40% of the coniferous class' 10.5% commission error.
Table 5. Error matrix for the resulting overstory map made with the Landsat-TM image, assessed by IKONOS map remainder (30%).
Ref
Classified
P C 0
WAT WET ALD CON DEC MIX EXP Total
WAT 105 2 6 113 92.9 7.1 78.0 WET 57 151 2 14 1 10 3 238 63.4 36.6 34.1 ALD 10 1 48 1 60 80.0 20.0 28.4 CON 260 70 13 6129 9 322 43 6846 89.5 10.5 1.4 DEC 1 2 5 21 3 32 65.6 34.4 36.4 MIX 39 4 2 49 2 425 4 525 81.0 19.0 44.6 EXP 7 12 7 183 209 87.6 12.4 21.5 Total 478 229 67 6216 33 767 233 8023
Note: Overall accuracy = 88.0%. K = 0.64%. WAT, water; WET, wetland; ALD, aider; NER, non-ericaceous régénération; CON, coniferous; DEC, deciduous; MIX, mixed wood; EXP,
exposed land; F, producer's accuracy
(%)
for the class; C,
commission error (%)
for the class; O,
omission error (%) for the class
The accuracies of Table 6 compare the overstory map pixel value directly to the extracted
inventory polygon label and furthermore to the sample plot label. Similar trends can be observed
within accuracies and errors at both resolutions, specifically for results derived from forest standmaps. Results obtained from the sample plots show similar trends with the exception of the
mixed wood class. The table therefore shows that the mapping procédure is expandable to a différent theme and is produced with an acceptable level of accuracy. However, it is observed that confusion exists and is présent with classes having lower producer's accuracy throughout ailvalidation schemes (e.g. wetland; mixed wood).
Table 6. Producer's accuracy, commission and omission errors for the resulting overstory maps
made with the IKONOS mosaic and the Landsat-TM image; both assessed by classes extracted
from the provincial stand maps and by project spécifie sample plots.
IKONOS Landsat-TM
from stand maps from sample plots from stand maps from sample plots
Class P C 0 P C O P C 0 P C 0 Water 79.5 21.1 20.5 84.0 12.5 16.0 81.1 28.1 18.9 56.0 30.0 44.0 Wetland 15.7 93.4 84.3 69.2 10.0 30.8 5.0 89.3 95.0 53.8 30.0 46.2 Aider 8.3 99.7 91.7 90.9 23.1 9.1 0.8 99.7 99.2 66.7 14.3 33.3 Coniferous 67.8 14.9 32.2 80.0 38.5 20.0 89.5 16.8 10.5 94.1 65.2 5.9 Deciduous 18.0 94.0 82.0 81.8 10.0 18.2 15.8 53.3 84.2 54.5 0.0 45.5 Mixed wood 25.9 86.3 74.1 57.1 20.0 42.9 10.0 78.5 90.0 7.1 0.0 92.9 Exposed land 9.6 92.1 90.4 92.3 14.3 7.7 1.9 91.1 98.1 75.0 0.0 25.0 Overall Acc. 62.9 ... ... 79.4 ... ... 77.9 ... ... 57.0 ... -. Kappa 0.32 ... ... 0.76 ... — 0.46 ... — 0.48 ...
Note: P, producer's accuracy (%) for the class; C, commission error (%) for the class; O,
omission error (%) for the class.
2.4. Discussion
The method presented here was established to be compatible with familiar and accessible datasets (i.e. IKONOS and Landsat-TM satellite imagery, aerial photographs, forest stand maps,
permanent and temporary sample plots) while integrating and expanding on knovra data analysis
algorithms (i.e. digital stereoscopic photo-interpretation, object-oriented and nearest neighbor
classification). The high overall accuracy (-80%) of generalized classes for the Landsat-TMimage classification also demonstrated the advantages of using a fmer spatial resolution image
(in our case the thematically classified IKONOS imagery) to improve classification results on a
coarser image and for extended spatial extent.
Spécifie low class accuracies for the IKONOS classification may be related to
misinterpretation during the digital photo-interpretation stage and to the flexibility in personal
interprétation of class density thresholds. Though the interprétations were done by an
experienced photo-interpreter, the intégration of digital stereoscopy within DVP software was
new to our expert and thus could constitute a significant source of error. Also, since the project
could not validate the interprétation of ericaceous shrub dominated sites or the pereent cover
thereof.
Wulder et al. (2006) suggest that caution is needed when making comparisons between raster and vector datasets, more precisely pixel and polygon; or overstory maps and forest inventory. Their research recommends validation approaches which would aecount for the heterogeneity of land cover classes within a forest inventory polygon. They concur that when possible, the use of
Project spécifie data is recommended for the validation of maps derived from remote sensing
data. A high overall accuracy of 78.4% for the Landsat-TM classification (79.8% at the IKONOSlevel) using the IKONOS polygons demonstrated that our method is valid for large area
mapping. However, the 30% polygons set aside for validation was not totally independent from
the training dataset. The use of polygons from higher spatial resolution images (IKONOSmosaic) is particularly useful as it provides much samples for each thematic elass, which is
otherwise difficult to achieve with traditional training data (both sample plots and/or aerialphoto-interpretation derived polygons). A second évaluation of the classification with the
Landsat-TM image was donc with our validation plots to verify and assess the quality of the classification with a totally independent dataset. As expected, the results were lower than those with the first évaluation with an overall accuracy of 64.5%. But, these results remain satisfactoryto confirm the relevance of the proposed method.
Using our method, classification using a Landsat-TM image was guided by the availability of
a finer level classification using IKONOS images. We noted that the results for the Landsat-TMimage classification can only be as accurate as those obtained for the IKONOS classification.
The lower producer's aceuracies for individual classes of the Landsat-TM classificationeompared with the IKONOS classification are explained by the possible spatial misregistration
of sample polygon délimitations due to the différence in the spatial resolution of these two
datasets. Altematively, higher producer's aceuracies for individual classes of the IKONOS classification can be explained by the spectral homogeneity and spatial explicitness of its
sampling and validation datasets. Moreover, the training and validation datasets for the
Landsat-TM classification are limited in coverage to the mosaic's géographie extent. This possibly restrains the Landsat-TM sample space radiometric variability and classification validity to the IKONOS data coverage. The use of very high resolution images dispersed within the coverage ofthe high resolution imagery would be of interest as this would increase the spatial distribution of the samples and consequently, classification accuracy.
The use of the eCognition software provided several advantages. First, its segmentation tools provided the ability to define spatial objects suited for producing maps as well for producing validation polygons. eCognition also provided an expanded availability of class discriminatory functions defined through spectral criteria (e.g. multispectral data, végétation indices) and contextual criteria (e.g. relation to neighboring objects). The use of the eCognition software also added some limitations to the classification process. We found that the implementation of textural criteria or extensive définition of these discriminatory functions could not be used for
practical reasons as this monopolized hardware resources for long processing times. We also noted that the processing time increased with the number of discriminatory functions, which was particularly limiting with the use of very high spatial resolution images of large area.
Overall we demonstrated the usefulness of very high resolution images as a step towards
mapping ericaceous shrubs over large areas. This approach has been used in other studies to map varions landscapes (Yang et al, 2003; Arroyo-Mora et al, 2005). The proposed method is a cost-effective alternative to accurate large scale mapping with high resolution data. Dépendent on dataset size and the necessity for a smaller multispectral spatial resolution, the implementation of data fusion algorithms such as pan-sharpening (Zhang, 2002) could be bénéficiai to thematic classification projects. Pan-sharpening was examined but overlooked in
this Project as analysis would be too time consuming. Moreover, a 3.2 m resolution appeared fine enough to fulfill the objectives of our study. Although the 15-m spatial resolution panchromatic
data was not available for the Landsat-TM dataset, it would be appropriate to test how it eould
improve the results. The possibility of implementing other high resolution sensors of différent
spatial resolutions (e.g. CASI, Quick Bird) is feasible guaranteed ail land cover types are exhausted in the high resolution imagery coverage. We think the methods presented here are
adaptable to other lower spatial and spectral resolutions (e.g. SPOT-5, ASTER)
and other large
area mapping thèmes. The expandability of the method has probably no longitudinal orlatitudinal limits. The idea behind the multi-resolution classification procédure is merely to
increase the spectral range of the sampling and validating thematic datasets applied to the lowest
spatial resolution image. However, we expect that expanding our method in another ecozone