Transformer Condition Assessment using
Fuzzy C-means Clustering Techniques
Key Words: Clustering, data analysis, diagnostic, fuzzy C-means, insulating oil, maintenance,
principal component analysis, transformers.
Introduction
For proper transformer management, maintenance managers must react quickly to uncover faulty feedback from investigation information which should be part of the general policy of operating power networks. In a production site, there are often several transformers and generators that contribute to the production of electrical energy. The requirement of continuity of service, that is to say of the availability of electrical energy depends on adequate responsiveness on the part of power plant managers. This means that planning, organization and execution of maintenance tasks must integrate all network management actions (load changes, various switchings, unplanned events, etc.). It is therefore necessary for the management system to take into account a certain amount of data useful for decision making at all levels of the maintenance management process. At the planning level it is often important to be able to have a view of all the devices, which are defective for an optimal organization of the various resources to be mobilized and of the periods of interruption. Some companies have set up a transformer selection organization for which maintenance actions must be programmed [1] [2]. For such a setup, the data from the diagnostic team must be interpreted and the transformers prioritized according to the actions to be performed as well as to other criteria related to the policy of the company. Knowledge on the reliability, aging, lifetime, and condition of the internal parts and insulation system of each equipment is important for general maintenance organization. In the case of fleet transformers, it is necessary to program the actions taking into account the urgency presented by the state of each unit.
Samuel EKE, Guy Clerc and Thomas
AKA-NGNUI
Univ. Lyon – Ampère (CNRS UMR 5005), Ecole Centrale Lyon, Univ. Claude Bernard Lyon 1, INSA de Lyon, France
I. Fofana
Research Chair on Aging Power Network Infrastructure (ViAHT), Université du Québec à Chicoutimi, Chicoutimi, QC, Canada.
Transformer management
Transformer management concerns all activities that enabling transformers to fulfill their role in the production of electrical energy. It is operationalized around a maintenance management process consisting of 5 phases [3]:
- Planning - Organization - Execution - Recording of data
- Optimization of maintenance.
Each phase is important and allows the manager to follow the life of transformers and take important decisions ensuring power availability. It is a question of allowing the implementation of any of the maintenance strategies: TBCM (Time Based Condition Monitoring), CBM (Condition Based Maintenance), OLCM (On-Line Condition Monitoring), TBM (Time Based Maintenance) and RCM (Reliability Centered Maintenance). An assessment of the actual condition of each unit is often made. It consists of characterizing the cumulative wear of each equipment through the evaluation of the number of faults and failures, and the net future value of each transformer. All these activities rely on electrical tests and oil analysis. References [2] and [3] give more details on the implementation of the transformer maintenance process. However, the examination of analysis results and the maintenance history operations are This paper proposes the use of the non-visible characteristics of oil analysis data to identify and cluster transformers with similar conditions. An unsupervised classification is then applied using the fuzzy C-means method. This method allows clustering tramsformers into classes by inserting the available data in a matrix. The data is grouped according to their similarity in terms of distance. Each cluster can therefore be interpreted and the actions to be taken prioritized.
used to identify the transformers on which it should be urgent to act.
Considering all the data at hand, the present study proposes a classification system whereby this data is set and the groups to be analyzed are determined. This tool can be used at the three levels of transformer management as implemented in [1].
M
ETHODOLOGYThe operational objective of this method is to identify from the data (population of transformers) made up from observations available at a given instant, groups of transformers which present similarities. The aim is to exploit hidden links in the data to make a classification.
As a first step, it is advisable to assess the importance of each characteristic in the data. In the field of pattern recognition and machine learning, the literature presents some feature selection tools. Using these tools, it is possible to classify and select subsets of characteristics according to their degree of relevance or importance as to user requirement. In unsupervised classification, feature selection is rather complex because of the lack of class labels which can guide the search for relevant information. Techniques such as unsupervised Graph Filter (Inf-FS) [4] [5] , Multi-Class Feature Selection (MCFS) [6] and Laplacian Score (LS) [7] still provide results that can be used to accelerate the classification process, reduce dimensionality and improve data understanding. Because of its simple implementation, the Laplacian Score technique is used in this work. The identification of the parameters that carry the most relevant information in class construction is obtained after sorting the LS values. Once the relevant characteristics are identified, the least important features can be removed before moving on to the second stage of the methodology.
For the second step, principal component analysis is used to identify a new observation structure. New variables are obtained, consisting of the linear combination of the starting observation variables. Depending on these new variables which are in fact the main components, an observation space and the amount of information it carries are identified.
In the third step, unsupervised classification is applied through the Fuzzy C-means algorithm. Clusters are formed based on non-visible links in the data.
The fourth and last step is the interpretation of each cluster, according to the technical and economic criteria. The expertise of the managers is then used to prioritize the groups whose transformers request urgent action.
Laplacian Score (LS)
According to [8], the basic idea of LS is to evaluate the features according to their locality preserving power. So, let be X ∈ ℝ𝑛×𝑝 t he data matrix, where 𝑛 is the number of in-stances and d is the number of features. 𝑓1, … , 𝑓𝑝 denotes the 𝑝 features, and f1,...,fp are the corresponding features vectors, where fi ∈ ℝ𝑛 and X = (f1,...,fp)T. For the given 𝑛 instances
𝑥1, … , 𝑥𝑛, the pairwise similarity among them can be present-ed as a symmetric matrix K ∈ ℝ𝑛×𝑛. Let 𝑮(V, E) denote the undirected graph constructed from K, where V is the vertex set, and E is the edge set. The i-th vertex of 𝐺 corresponds to 𝑥𝑖, and there is an edge between each vertex pair (𝑥𝑖, 𝑥𝑗), whose weights 𝑘𝑖𝑗 allows to build the affinity matrix of 𝑮 called K. Let d denote the vector: d = (𝑑𝟏, … , 𝑑𝒏), where 𝑑𝑖= ∑𝑛𝑗=1𝑘𝑖𝑗. The degree matrix D of the graph 𝑮 is defined by: Dij = 𝑑𝑖 if 𝑖 = 𝑗, and 0 otherwise. According to [7], 𝑑𝑖 can be interpreted as an estimation of the density around 𝑥𝑖, the larger value of 𝑑𝑖.
So, Laplacian score select features that retain sample local-ity specified by an affinlocal-ity matrix K, its corresponding degree matrix D and Laplacian matrix L such defined as:
L = D - K (1) The Laplacian Score of the feature f is calculat-ed in the following way:
𝐿𝑟𝐟= f ̃T𝐋f̃ f ̃T𝐃f̃ (2) where f̃ = f −𝐟T𝐃𝟏 𝟏𝐓𝐃𝟏
Principal Component Analysis (PCA)
Let X∈Rn×p be a matrix containing nobservations (in-stances). Each observation is described by p variables or parameters, and can thus be considered as a point in a observation space. The aim of PCA is to explore the links between the p variables and the similarities between the n observations. This tool allows to construct an Euclidean space consisting of principal components, a linear combination of the p initial variables with the goal of building up a Euclidean space with features most adaquately summarizing the data structure in this space. Indirectly, a reduction of the variable dimensionality is obtained. The principal components that constitute the axes of this space are obtained by calculating the vectors and eigenvalues of the correlation matrix R. X X R t p 1 (3) Where t
X is the transpose of matrixX.
The inertia of the data is evaluated by calculating the variance. For each variable, the ratio between the eigenvalues of R and the total number of variables are characterized, providing the amount of information carried by each principal component . The inertia is calculated by the following relation: p I i i (4) where, i1,...,p are the eigenvalues of matrix R.
Fuzzy C-means
Unsupervised classification consists in grouping data
Code de champ modifié
Code de champ modifié Code de champ modifié Code de champ modifié Code de champ modifié
without the contribution of an expert. Clustering techniques are used to partition data into multiple groups so that the de-gree of association is strong within one group and low be-tween different groups. Observations from a same group (called a cluster) are then closer to each other than those from other clusters, in terms of a criterion of (dis) similarity. In other words, any observation is assigned to the cluster for which it is closer to its center of gravity. The similarity crite-rion is generally based on distance. In the literature, however, there are several unsupervised classification methods that apply the coalescence technique [10] [11]. For example, the fuzzy C-means technique uses fuzzy logic to define the de-gree of belonging to a class. For every group, each point is assigned a membership degree between 0 and 1. The mem-bership values indicate the probability of each point to belong to the different groups.
Given a number of clusters C, the Fuzzy C-means tech-nique will classify the X=
{
x ,...,1 xn}
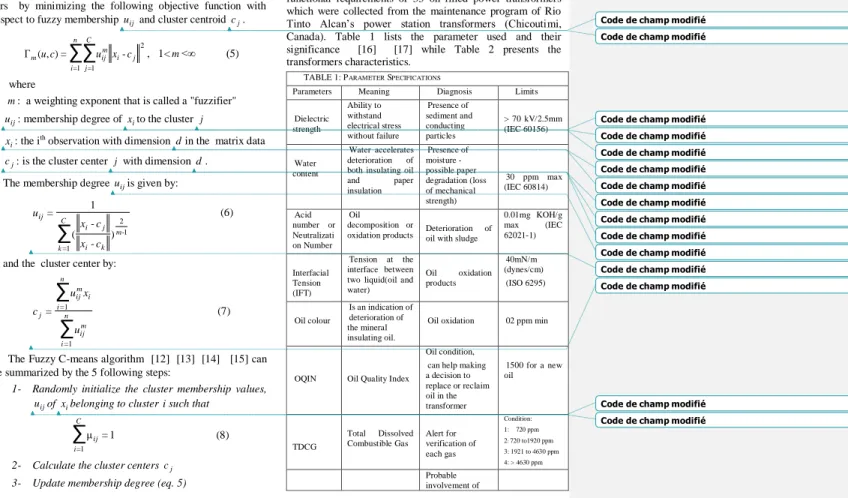
data into C fuzzyclus-ters by minimizing the following objective function with respect to fuzzy membership uij and cluster centroid cj.
∑∑
1 = =1 2 -= ) , ( Γ n i C j j i m ij muc u x c , 1<m<∞ (5) wherem: a weighting exponent that is called a "fuzzifier"
ij
u : membership degree of x to the cluster i j
i
x : the ith observation with dimension d in the matrix data
j
c : is the cluster center j with dimension d . The membership degree uijis given by:
∑
1 = 1 -2 ) -( 1 = C k m k i j i ij c x c x u (6)and the cluster center by:
∑
∑
1 = 1 = = n i m ij n i i m ij j u x u c (7)The Fuzzy C-means algorithm [12] [13] [14] [15] can be summarized by the 5 following steps:
1- Randomly initialize the cluster membership values,
ij
u of x belonging to cluster i such that i
1 = μ
∑
1 = C i ij (8)2- Calculate the cluster centers cj
3- Update membership degree (eq. 5)
4- Calculate the objective function Γm(u,c) (eq.4) 5- Repeat steps 2 to 4 until the convergence of
algorithm.
Convergence can be considered achieved if the relative value of theΓcriterion (3) falls below a predetermined small threshold or if the maximum number of prefixed iterations has been reached. It is possible to adjust the amount of fuzzy overlap when performing the fuzzy c-means clustering.
Application and results
It is supposed that during the maintenance process, the transformer managers have gathered data on some oil-filled transformers including some parameters and basic maintenance or oil treatment actions to be planned.
Description of the case under study
The data analyzed in this study are derived from the functional requirements of 33 oil-filled power transformers which were collected from the maintenance program of Rio Tinto Alcan’s power station transformers (Chicoutimi, Canada). Table 1 lists the parameter used and their significance [16] [17] while Table 2 presents the transformers characteristics.
TABLE 1: PARAMETER SPECIFICATIONS
Parameters Meaning Diagnosis Limits
Dielectric strength Ability to withstand electrical stress without failure Presence of sediment and conducting particles > 70 kV/2.5mm (IEC 60156) Water content Water accelerates deterioration of both insulating oil
and paper insulation Presence of moisture - possible paper degradation (loss of mechanical strength) 30 ppm max (IEC 60814) Acid number or Neutralizati on Number Oil decomposition or
oxidation products Deterioration oil with sludge of
0.01mg KOH/g max (IEC 62021-1) Interfacial Tension (IFT) Tension at the interface between two liquid(oil and water) Oil oxidation products 40mN/m (dynes/cm) (ISO 6295) Oil colour Is an indication of deterioration of the mineral insulating oil.
Oil oxidation 02 ppm min
OQIN Oil Quality Index
Oil condition, can help making a decision to replace or reclaim oil in the transformer 1500 for a new oil TDCG Total Dissolved Combustible Gas Alert for verification of each gas Condition: 1: 720 ppm 2: 720 to1920 ppm 3: 1921 to 4630 ppm 4: > 4630 ppm Probable involvement of
Code de champ modifié Code de champ modifié Code de champ modifié
Code de champ modifié Code de champ modifié Code de champ modifié Code de champ modifié Code de champ modifié Code de champ modifié Code de champ modifié Code de champ modifié Code de champ modifié Code de champ modifié Code de champ modifié
Code de champ modifié Code de champ modifié Code de champ modifié
CO2/CO Carbon contents
of oil
paper in the fault < 3 or >10
Results
Let XRnp be the matrix containing nobservations
described by p variables composing the feature vector.In the case of this study, the following 8 parameters are used: TDCG, CO2/CO, Dielectric strength, Water content, IFT, Acid Number, Density, and Oil color,as shown in Table 1 above. The values of each of these parameters are recorded on the 33 transformers. Each observation (transformer) is
considered as a point in a p dimensional space.
As previously announced, our methodology is applied in 4 steps:
First step: Identification of the relevance of each parameter in the data structure constitution in the space representation.
By applying the LS, it can be observed that, without affecting the structure of the data, it is possible to ignore three variables (Acidity, Density and Color of Oil).
TABLE3.RESULTS OF LS APPLICATION
N° Feature 𝐿𝑓𝑟 1 TDCG 6927.9 2 CO2/CO 0.0000 3 Dielectric strength 0.2000 4 Water content 0.2000 5 IFT 0.0000 6 Acid Number 0.0000 7 Density 0.0000 8 Color 0.0000 Ranking 1 TDCG 3 Dielectric strength 4 Water content 5 IFT 2 CO2/CO 8 Color 6 Acid Number 7 Density
Figure 1. Data structure in the 3D space (three first variables), before applying LS.
Figures 1 and 2 present the data structure in the space consisting of the three first variables before and after applying LS, according to the results presented in table 3 bellow. The two figures are almost identical, although they removed three variables in the data matrix (the ones in bold in table 3)
Figure 2. Data structure in the 3D space (three first variables), after applying LS.
Second step: Characterization of the classification or rep-resentation space .
PCA is applied to obtain the principal components that characterizes the axes of the observation or representation space. After the application of the Laplacian score, the goal of the PCA is to identify the data representation space and the importance of each axis constituting this space.
Taking into account the variance of the data, this method allows to better distinguish the classes mainly responsible for this variance.
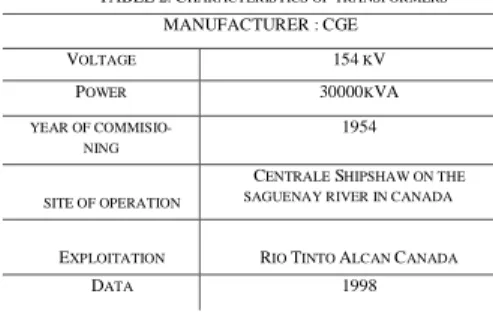
TABLE2.CHARACTERISTICS OF TRANSFORMERS
MANUFACTURER :CGE VOLTAGE 154 KV POWER 30000KVA YEAR OF COMMISIO-NING 1954 SITE OF OPERATION
CENTRALE SHIPSHAW ON THE SAGUENAY RIVER IN CANADA
EXPLOITATION RIO TINTO ALCAN CANADA
Table 4 shows the eigenvalues corresponding to matrix
R and the cumulative variances, which highlight the information contained in the observation space. The table 5 is derived from the calculation of correlation matrixR, according to Eq. 2.
The first three factors account for 89.20% of the information in the data set (cumulated variances inTable 4). The projection of the initial variables in the space constituted by these three main factors allows to identify the information that each factor carries, and characterizes the new variables. This projection of the variables (Fig. 3) is summarized in Table 5 below. Figure 3 shows the spatial distribution of each variable according to the first two principal components.
The application of the PCA shows that the 3 D space representative of the data to be analyzed consists in the axes carried by the water content (axis1), the TDCG (Axis 2), and the Dielectric strength (Axis3 ).
TABLE5.CORRELATIONBETWEENAXESANDVARIABLES
Variables Axis1 Axis 2 Axis 3 Axis 4 Axis 5
TDCG -0.2614 0.7448 -0.5626 0.2453 -0.0155 CO2/CO 0.5187 0.1080 0.2386 0.7524 -0.3104 Dielectric strength -0.4732 0.2049 0.6134 0.3127 0.5100 Water content 0.5510 0.0102 -0.2528 0.0268 0.7948 IFT -0.3676 -0.6257 -0.4317 0.5247 0.1079
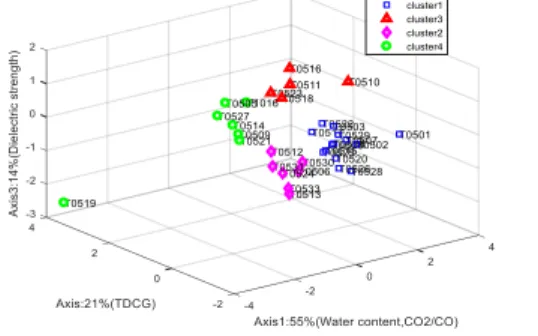
Figure 3. Correlation circle Third step: Obtaining clusters
The number and validity of classes can be discussed through existing tools. In this study, the optimal class number is held through the Davies-Bouldin and silhouette indexes [18] [19] [20] for the k-means algorithm and adopted for the fuzzy C-means algorithm applied here as a classification method.
Figure 4. Clustering by fuzzy C-means
Figure 4 shows the clustering obtained. The clusters are represented in the space identified from the PCA. It presents 4 clusters whose characteristics are analyzed in the procedure that follows.
Fourth step: Clusters interpretation
The analysis results of Table 6 displays the characteristics of each cluster.
Cluster 1: This cluster consists of transformers that have a doubtful quality of insulation, for which it is desirable to con-sider filtering action of the insulating oil. Cluster 2: This group presents transformers whose oil quality and insulation are acceptable. However, an individual gas control should be programmed for most transformers. The state of this cluster is quite close to that of cluster 4. Cluster3: The quality of oil and insulation of this group of transformers is questionable. The transformers whose maintenance actions include regeneration of oil belong to this group.
TABLE4.PRINCIPAL AXES, EIGENVALUES, EX-PLAINED VARIANCE AND CUMULATIVE VARIANCES
Factor Eigenvalues of R Explained variances (%) Cumulated variances (%) 1 2.7361 54.7214 54.6712 2 1.0356 20.7125 75.4339 3 0.6884 13.7679 89.2018 4 0.3421 6.8419 96.0437 5 0.1978 3.9563 100.0000
Cluster 4: The oil of these transformers is acceptable for in-sulation.
Discussion and conclusion
The classification methods used in this contribution allows extracting non-obvious relationships from transformer maintenance data (Appendix 1). In the management of transformers, all the possible observations are not always available. The maintenance planner must implement an operating procedure to ensure continuity of service and power. It is desirable to be able to quickly identify at-risk transformers to plan appropriate actions. In the present study, Machine Learning techniques were presented in a four-step procedure as support to transformer management. A pseudo code is proposed in Appendix 2. The case presented provides a quick assessment of the transformers condition, especially as concerns the oil data. The starting parameters have been restricted to those which carry the most relevant information for the analysis (feature selection). PCA allows visualizing the observation space according to the variance of the data. The classification obtained by the Fuzzy C-means algorithm provides four groups presenting quite different characteristics. However, it is important to note the outlier character of the T0519 transformer, whose TDCG parameter requires special attention (degassing) or more extensive investigation. Maintenance actions can be scheduled for obtaining such results. Anyway, the brainstorming provided by this method can be helpful. The expertise of the engineers must be used to better understand what each group gives as maintenance information.
The constraints and limitations of this work may well depend on the quality of data. In order to ensure such quality, it is important to have a group of transformers with the same characteristics and operating under the same conditions. Otherwise, the interpretation of the classes may not be consistent because the limiting values of certain parameters depend on the characteristics of the transformers (power, voltage, type, technology, etc.).
Acknowledgment
The authors gratefully acknowledge the cooperation of Rio Tinto in Canada, for providing maintenance data for the formers at one of their power plants, namely the GSU trans-formers of their Shipshaw power station in Canada. The au-thors also thank the University of Douala in Cameroon and the Faculty of Industrial Engineering for the funding of the thesis under which this work was carried out.
REFERENCES
[1] Lorin P. " Lifetime decisions, Optimizing lifetime costs for transformers through informed decisions ", Special Report, ABB Review.
[2] K. Carrander, L. Pettersson L. Melzer, N. Fantana, P. Lorin: " Methodology for life assessment on power transformers", TRAFOTECH 2002, Sixth International Conference on Transformers, 24–25 January 2002, Mumbai, India.
[3] Conseil international des grands réseaux électriques, Comité d’études A2. "Guide for transformer maintenance". Paris : CIGRÉ, 2011. [4] Roffo G. " Feature Selection Library (MATLAB Toolbox) ", 2016.
[5] Roffo G., Melzi S., Cristani M." Infinite Feature Selection ". 2015. p. 4202‑4210.
[6] Cai D., Zhang C., He X. "Unsupervised feature selection for Multi-Cluster data ". In : Proc. ACM SIGKDD Int. Conf. Knowl. Discov. Data Min. , 2010. p. 333‑342.
[7] He X., Cai D., Niyogi P. " Laplacian Score for Feature Selection" In : Proceeding Adv. Neural Inf. Process. Syst., 2005.
[8] Xiaofei He Deng Cai, Partha Niyogi, "Laplacian Score for Feature Selection", Advances in neural information processing, 2006. [9] Liu R. et al. "An Unsupervised Feature Selection Algorithm: Laplacian
Score Combined with Distance-Based Entropy Measure ", IEEE, 2009. p. 65‑68.
[10] Wu X. et al. " Top 10 algorithms in data mining ". Knowl. Inf. Syst.. Vol. 14, n°1, p. 1‑37, janvier 2008.
[11] M. Emre Celebi, Kemal Aydin, "Unsupervised Learning Algorithms" Springer, Cham, Switzerland, 2016. ISBN 978-3-319-24211-8. [12] F. Hoppner, F. Klawonn, R. Kruse, and T. Runkler, "Fuzzy cluster
analysis," Wiley Press, New York, 1999.
[13] Bezdek J. C., Ehrlich R., Full W. "FCM: The fuzzy c-means clustering algorithm ", Comput. Geosci., Vol. 10, n°2, p. 191‑2031 janvier 1984. [14] S.R.Kannan, R.Devi, S.Ramathilagam, K. Takezawa,
"Effective-FCM-noise-clustering-algorithms in medical images", Computers in Biology and Medicine, 2013.
TABLE 6. CHARACTERISTICS OF EACH CLUSTER Cluster Trs TDCG Dielectric strength Water content IFT CO2/CO C lu st er 1 T0501 79,53 20 28 35,70 10.67 T0502 807,00 25 29 36,40 10,39 T0503 857.30 27 31 28,40 8,53 T0504 946,00 23 35 28,20 7.16 T0507 920,20 19 26 31,50 9,82 T0508 975,40 18 28 28,20 7,76 T0515 839,60 22 21 32,90 7,71 T0517 1175 27 26 29,40 8,72 T0520 962,80 25 30 35,40 8,15 T0522 976,80 32 36 27,10 7,76 T0525 938,30 23 24 32,70 7,57 T0526 845,90 18 26 34,60 7,17 T0528 908,90 14 32 32,90 7,30 T0529 870,30 23 30 29,20 8,52 C lu st er 2 T0506 1023,50 23 16 35,50 5,93 T0512 436,80 41 7,30 37,10 3,53 T0513 1149,60 18 12 37,70 4,83 T0524 934,70 32 13 39,10 5,09 T0530 747,30 27 14 36,10 5,85 T0531 919,50 35 12 37,80 4,63 T0533 1044,40 30 27 36,5 3,00 C lu st er 3 T0510 946,00 18 37 14,50 10,38 T0511 903,50 39 23 22,20 8,35 T0516 1148,10 22 21 32,90 7,71 T0518 1200 32 22 21,20 8,05 T0523 1439,00 22 19 14,40 7,77 C lu st e r 4 T0505 1039,2 60 6,50 34,10 6,57 T0509 1095,00 51 11 35,90 5,25 T0514 1167,70 51 11 33,30 5,41 T0519 4369,9 50 6,2 36,60 3,87 T0521 952,00 49 9,90 35,60 4,13 T0527 1133,4 59 6,70 35,00 5,58 T01016 827,10 55 8,20 33,11 6,78
[15] A. Stetco, Xiao-Jun Zeng, John Keane, "Fuzzy-means++: Fuzzy C-means with effective seeding initialization", Expert Systems with Applications, 22 May 2015.
[16] IEEE Std C57.106-2006 (Revision of IEEE Std C57.106-2002): IEEE Guide for Acceptance and Maintenance of Insulating Oil in Equipment. IEEE, 2006.
[17] IEEE Std C57.104-2008. "IEEE Guide for the Interpretation of Gases Generated in Oil-immersed Transformers". 2 février 2009. [18] D. L. Davies and D. W. Bouldin: "Cluster Separation Measure", IEEE
Transactions on Pattern Analysis and Machine Intelligence, Vol. 1, No. 2, pp. 95-104, 1979.
[19] Peter J. ROUSSEUW, "Silhouettes: a graphical aid to the interpretation and validation of cluster analysis". Journal of Computational and Applied Mathematics 20(1987)53-65 North Holland.
[20] Dunn J., " Well Separated clusters and optimal fuzzy partitions ", journal of Cybernetics, 4, 95-104, 1974.
[21] Everton Z. Nadalin, Rodrigo . Silva, Romis Attux, João M. Romano, " Analysis of the Weighted Fuzzy C-means in the Problem of source Location" ,European Symposium on Artificial Networks, computational Intelligence and Machine Learning. Buges (Belgium), 23-25 April 2014.
Samuel EKE received his diploma of second level technical teacher in electrical engineering from the Advanced Technical Teachers College at the University of Douala Cameroon in 2002, and his Master of Science in 2007. After a long period of teaching in Technical High School in Cameroon, he is recruited in the Faculty of Industrial Engineering of the University of Douala as an assistant lecturer in 2008. He joined the Ampere laboratory in 2015 to do a Ph.D. He received his Ph.D. degree from the University of Lyon in 2018.
Guy CLERC was born in Libourne, France, on November 30, 1960. He received his bachelor’s degree in engineering and Ph.D. in electrical engineering from the École Centrale de Lyon, France, in 1984 and 1989, respectively. He is a professor in electrical engineering and teaches at the University Claude Bernard Lyon I in France. He has conducted research on the control and diagnosis of induction machines.
Thomas AKA-NGNUI received his physical engineering degree in 1995 from the Faculty of Science and Technology, University of Abidjan (Côte d’Ivoire), and the M.Sc. and Ph.D. degrees from the Ecole Centrale Lyon, France in 1996 and 2000, respectively. He is presently an associate professor at the Ecole Centrale Lyon where he teaches electrical engineering and is the Head of High Voltage Test Center (CEHT) at AMPERE Lab-CNRS UMR 5005. His main research interests include high-voltage phenomena, lightning, electrical insulation, dielectric materials, modeling, and computer simulation.
Issouf Fofana (M´05-SM’09) obtained his electro-mechanical engineering degree in 1991 from the University of Abidjan (Côte d’Ivoire), and his master’s and doctoral degrees from École Centrale de Lyon, France, in 1993 and 1996, respectively. He was a postdoctoral researcher in Lyon in 1997 and was at the Schering Institute of High Voltage Engineering Techniques at the University of Hanover, Germany from 1998 to 2000. He was a Fellow of the Alexander von Humboldt Stiftung from November 1997 to August 1999. He joined Université du Québec à Chicoutimi (UQAC), Quebec, Canada as an Associate Researcher in 2000, and he is now a professor there. Dr. Fofana has held the Canada Research Chair, tier 2, of insulating liquids and mixed dielectrics for electrotechnology (ISOLIME) from 2005 to 2015. He is actually holding the Research Chair on the Aging of Power Network Infrastructure (ViAHT), director of the MODELE laboratory and director of the International Research Centre on Atmospheric Icing and Power Network Engineering (CenGivre) at UQAC. Prof Fofana is an accredited professional engineer in the province of Quebec. He is currently a member of the IEEE-DEIS AdCom and member of the international scientific committees of few IEEE DEIS-sponsored or technically-sponsored conferences (ICDL, CEIDP and ICHVE). He is a member of the few Cigre working groups and ASTM D27 committee. He has authored/co-authored over 260 scientific publications, two book chapters, one textbook, and holds three patents. Prof Fofana was recently elected Fellow of the IET.
Appendix 1: Data table used
Equipment TDCG CO2/CO Dielectric Strength Water content IFT Acid number Density Color 'T0501' 79,52 10,66 20 28 35,70 0,018 0,87 2 'T0502' 807 10,39 25 29 36,40 0,025 0,86 1,50 'T0503' 857,30 8,536 27 31 28,39 0,07 0,96 2 'T0504' 946 7,16 23 35 28,20 0,11 0,86 2 'T0505' 1039,20 6,57 60 6,50 34,09 0,04 0,87 2 'T0506' 1023,50 5,937 23 16 35,50 0,054 0,87 2 'T0507' 920,19 9,82 19 26 31,50 0,06 0,86 1,50 'T0508' 975,40 7,76 18 28 28,20 0,09 0,87 2 'T0509' 1095 5,25 51 11 35,90 0,050 0,87 2 'T0510' 946 10,38 18 37 14,50 0,032 0,86 2 'T0511' 903,50 8,35 39 23 22,20 0,014 0,87 2 'T0512' 436,80 3,53 41 7,30 37,09 0,032 0,87 2 'T0513' 1149,60 4,83 18 12 37,70 0,03 0,87 2 'T0514' 1167,70 5,41 51 11 33,29 0,04 0,87 2 'T0515' 839,60 7,71 22 21 32,90 0,05 0,87 2 'T0516' 1148,10 8,76 31 27 13,50 0,04 0,87 2 'T0517' 1175 8,72 27 26 29,39 0,057 0,87 2 'T0518' 1200 8,05 32 22 21,20 0,10 0,87 2 'T0519' 4369,90 3,87 50 6,19 36,59 0,04 0,87 2 'T0520' 962,80 8,15 25 30 35,40 0,03 0,87 2 'T0521' 951,99 4,13 49 9,89 35,59 0,02 0,87 2 'T0522' 976,80 7,76 32 36 27,10 0,079 0,87 2 'T0523' 1439 7,77 22 19 14,39 0,10 0,86 1,50 'T0524' 934,70 5,09 32 13 39,09 0,02 0,87 2 'T0525' 938,30 7,57 23 24 32,70 0,06 0,87 2,50 'T0526' 845,90 7,17 18 26 34,59 0,09 0,86 2 'T0527' 1133,40 5,58 59 6,69 35 0,02 0,87 2 'T0528' 908,90 7,30 14 32 32,90 0,04 0,87 2 'T0529' 870,30 8,52 23 30 29,20 0,07 0,86 2 'T0530' 747,30 5,85 27 14 36,09 0,05 0,87 2 'T0531' 919,50 4,63 35 12 37,79 0,03 0,87 2 'T0533' 1044,40 3,00 30 27 36,50 0,04 0,86 2 'T1016' 827,10 6,78 55 8,2 33,10 0,05 0,86 2,50
Appendix 2: Pseudo code 1. Read Data File
2. Extract Variables = {'TDCG', 'CO2surCO', 'Dielectric strength', 'WaterContent', 'IFT'} 3. Compute Laplacian Score
3.1 calculation of the affinity matrix K for i = 1 to p, for j = 1 to p, 𝑘𝑖𝑗= 𝑒‖𝑥𝑖−𝑥𝑗‖2 𝑡 𝑑𝑖= ∑ 𝑘𝑖𝑗 𝑛 𝑗=1 Dij= 𝑑𝒊 if i = j else Dij = 0 end; end;
3.2 Calculation of Laplacian Matrix L = D-K
3.3 calculation of Laplacian Score 𝐿𝑟𝐟 f̃ = f −𝐟T𝐃𝟏 𝟏𝐓𝐃𝟏 𝐿𝑟𝐟= f̃T𝐋f̃ f̃T𝐃f̃ 4. Compute PCA
4.1. Calculation of correlation matrix
X X R t p 1 4.2. calculation of eigenvector of R U = XVɅ1/2
4.3. Sort and keep specific number of first component 4.4. calculate the inertia of each component
for 𝑖 = 1 to p, p I i i 5. Compute Fuzzy C-means [21]
5.1 Initialization of the membership matrix{Citation} 5.2 t = 0
5.3 Calculate the cluster center Do:
For 𝑗 = 1 until 𝑐 do: 𝑐𝑗(𝑡) =
∑𝑛𝑖=1𝑢𝑖𝑗𝑚(𝑡)𝑥𝑖 ∑𝑛 𝑢𝑖𝑗𝑚(𝑡)
𝑖=1
end;
5.4 Update the membership matrix: For 𝑗 = 1 until 𝑐 do: for 𝑖 = 1 until 𝑛 do:
𝑢𝑖𝑗(𝑡 + 1) = 1 ∑ (‖𝑥𝑖−𝑐𝑗(𝑡)‖ ‖𝑥𝑖−𝑐𝑘(𝑡)‖) 2/(𝑚−1) 𝑐 𝑘 end; end;