Science Arts & Métiers (SAM)
is an open access repository that collects the work of Arts et Métiers Institute of Technology researchers and makes it freely available over the web where possible.
This is an author-deposited version published in: https://sam.ensam.eu Handle ID: .http://hdl.handle.net/10985/15023
To cite this version :
Meihan JIN, Christophe CLARAMUNT A semantic model for human mobility in an urban region -Journal of Data Semantics - Vol. 7, n°3, p.171-187 - 2018
A Semantic Model for Human Mobility in an Urban Region
Meihan Jin, Christophe Claramunt
Naval Academy Research Institute Brest, France
Keywords: Urban trajectories; Spatio-temporal data modeling; Spatio-temporal databases
Author1
Email:
Meihan Jin
Address:
Naval Academy Research Institute BCRM Brest CC 600 - Lanveoc F-29240 BREST Cedex 9 Author 2 Email: Adress: Christophe Claramunt [email protected] Naval Academy Research Institute BCRM de Brest
CC 600 - Lanveoc F-29240 BREST Cedex 9
ABSTRACT
The continuous development and complexity of many modern cities offer many research challenges for urban scientists searching for a better understanding of mobility patterns that happen in space and time. Today, very large trajectory datasets are often publicly generated thanks to the availability of many positioning sensors and location-based services. However, the successful integration of mobility data still requires the development of conceptual and database frameworks that will support appropriate data representation and manipulation capabilities. The research presented in this paper introduces a conceptual modeling and database management approach for representing and analyzing human trajectories in urban spaces. The model considers the spatial, temporal and semantic dimensions in order to take into account the full range of properties that emerge from mobility patterns. Several object data types and data manipulation constructs are developed and experimented on top of an urban dataset testbed currently available in the city of Beijing. The interest of the approach is twofold: first, it clearly appears that very large mobility datasets can be integrated in current extensible GIS; second, significant patterns can be derived at the database manipulation level using some specifically developed query functions.
1. INTRODUCTION
Cities have always been very dynamic and complex environments whatever the scale of study, for that they encompass a lot of human activities and interactions whose exploration is far from being a straightforward task. In particular, modern large cities generate high displacements and traffic flows that still deserve the development of appropriate data modeling frameworks in order to provide urban planners a better understanding of displacement patterns.
Studying human mobility pattern has been a research issue dating back to the 80s (Huff & Hanson, 1986; Jiang et al., 2012; Pentland & Liu, 1999). One of the main reasons behind this trend is that the prediction of individuals’ travel behaviors is an essential component of urban transportation planning and policy analysis (Kitamura, 1988). An important objective of the search for a better understanding of human mobility is for instance to develop the capability to represent and predict how individuals respond to changes in their environments, and how such responses are temporally and spatially correlated. However, the understanding of individuals’ mobility patterns is still a difficult task, since this not only involves complex decision processes, but also includes several semantics, spatial and temporal constraints. Therefore, the development of conceptual model and data mining methods oriented to the analysis and discovery of the human mobility are still considered as a research challenge.
Researchers have been long developing methodological and modeling frameworks to interpret and analyze human behaviors (Alvares et al., 2007; Goodchild et al., 2007; Huff & Hanson, 1986; Renso et al., 2013). According to Andrienko et al. (2008), a movement behavior is a generalization of several geometrical and semantic primitives derived from individual trajectories and that can be analyzed at the general level in order to generate additional knowledge. At the conceptual level, a trajectory can be represented as a user defined record of the evolution of the position (i.e., represented as a punctual primitive) of an object that is moving in space during a given time interval in order to achieve a given goal (Spaccapietra et al., 2008). At the application levels, comprehensive taxonomies have been introduced to characterize movement patterns (Dodge et al., 2008).
Several approaches have been so far proposed to characterize moving patterns in urban environments. At a wide regional level, Inoue & Tsukahara (2016) introduced a hierarchical approach to analyze human movements and stays. Chen et al. (2014) developed a modified version of the density-based clustering algorithm, so-called T-DBSCAN, by considering the time-sequential characteristics of the GPS points along a trajectory. Tang et al. (2016) studied mobility patterns and travel times at urban network intersections using GPS raw data. Chen et al. (2016) introduced a conceptual spatio-temporal model based on Time Geography principles. A series of basic spatio-temporal operations have been identified and classified and implemented in a GIS software. Despite the interested and applicability of these recent works, there is so far a lack of integration of manipulation operations at the database level. In fact we believe that not only spatio-temporal conceptual models should characterize behind mobility patterns in urban environment, but a sound implementation should provide data manipulation operations and functions applied to the spatial, temporal and semantic levels to explore the patterns that emerge in space and time . Such exploration should reveal how do people usually travel from origins to
destinations and this at different levels of abstraction; what routes do they usually choose during at regular times? How these patterns aggregate at the level of the whole transportation network? These very few examples of research questions should be answered when delivering a sound spatio-temporal database framework and database manipulation operations oriented to the analysis of urban movement patterns. Our research is clearly oriented to the development of a conceptual and logical database modeling framework that combines a conceptual and semantic approach to represent human displacements in the city, with a computational implementation on top of an extensible geographical DBMS. The whole approach has been experimented and applied to a reference trajectory dataset from the city of Beijing in China.
The rest of the paper is organized as follows. Section 2 develops our conceptual modelling approach that represents human mobility into three complementary extensible modules. Section 3 introduces a series of semantic, spatial and temporal query principles that manipulate the conceptual model. Finally Section 4 develops the implementation principles and validation as experimented with the Geolife dataset available in the city of Beijing while Section 5 draws the conclusion and outlines further work.
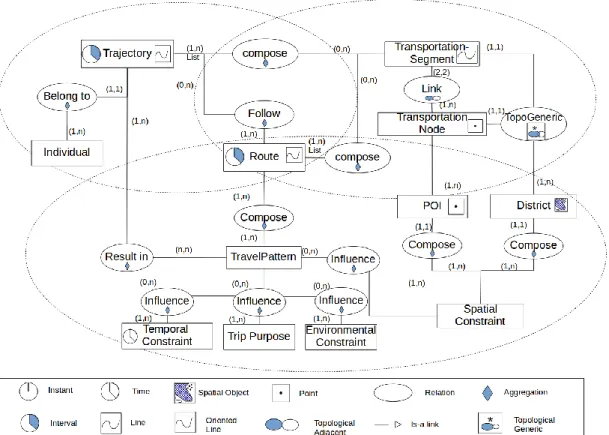
2. MODELING APPROACH
Our modeling objective is to design a generic semantic and spatio-temporal database model for human mobilities. The aim of the semantic part of the model is to abstract the notion of trajectory as reflected in the urban domain and project them into the information world. This implies to make a difference between the attributes of the objects of interest and also the spatial and temporal dimensions.
2.1 Human Mobility Model
The conceptual database schema of human mobility consists of several sub-schemas closely connected with each other (so-called modules hereafter). The construction of the model is designed according to the principles of the MADS (Modelling Application Data with Spatio-temporal Features) model developed by Parent et al., (2006). The three sub-schemas are as follows:
• The Trajectory module abstracts the movements of human beings in the city as performed on top of transportation network.
• The Transportation Network module represents all sorts of networks that facilitate human displacements in the city.
• In order to extract human travel patterns, the Travel Pattern module travel classifies possible factors that generate moving behaviors.
These three modules (Trajectory module, Transportation Network module, and Travel Pattern module) are not independent as parts of the entities identified are also related by specific relationships. The union of these modules gives the general Human Mobility Schema illustrated in Figure 1.
Figure 1 General Schema of the Human Mobility Model 2.2 Trajectory Module
The Trajectory Module models the displacements of human movements suggested by early concepts of Time Geography (Hägerstraand, 1970). As we consider that people’s movements in the city take place along a transportation network, a trajectory is indivisible of a transportation network. The object Trajectory models a human being movement. While early studies in human geography mostly considered transportation behaviors at the aggregated level, a conceptual shift appeared in the early 70s with the emergence of the theory of Time Geography (Hägerstraand, 1970). While studying human migrations in Sweden, Hägerstrand developed a conceptual foundation where human mobilities are modeled at the disaggregated level. Following some of the principles identified by Time Geography, a human hereafter denoted as an Individual is an object type representing one of the owners of a given Trajectory.
A Trajectory denotes a spatial and temporal object. The relationship Compose between
TransportationSegment and Trajectory is an aggregation of a type List. Therefore, a Trajectory is a
sequence of one-to-many TransportationSegments. A Trajectory contains a temporal attribute,
Duration, valued as an interval and derived from the time instant of the starting node of the first TransportationSegment TR1, and the time instant of the ending node of the last
Definition 1: Individual
An Individual denotes a human being who travels and performs some activities in the city along an urban transportation network. An Individual is modeled by several attributes that cover the identity and some social characteristics including Name valued as String, Age valued as Integer,
Gender valued as String and two possible values (i.e., Male or Female), Occupation valued as Enumeration (i.e., enumeration of possible current occupations), and FamilyRole valued as Enumeration (e.g., mother, father, child).
Definition 2 Trajectory
A Trajectory implicitly some users’ outdoor movements, including the transportation mode utilized. A Trajectory is explicitly represented by a sequence of time-stamped points (instant, latitude, longitude and altitude), and also designed as an ordered sequence of
TransportationSegments. This gives Trajectoryi=[TS1, TS2, … TSn] where TS1, TS2, …, TSn
denote a sequence of TransportationSegments. Note that a given TransportationSegment can be travelled by one to many individuals, which represents a primitive modeling unit of the human travel representation. A Trajectory has implicitly a starting node and an ending node given by the start node and ending node of the first and last TransportationSegments, respectively.
2.3 Transportation Network Module
The Transportation Network Module represents the urban network and contains the road and railway networks.
Definition 3: TransportationNode
A TransportationNode is a generalization of either a transportation line intersection or a POI. A transportation intersection denotes the junction between several TransportationSegment (at least two). A POI is a point of interest that approximates the location of a landmark in the network, a trajectory destination or starting location.
The object type TransportationNode has a spatial attribute Node defined as a geometry of type
Point which represents its location in the Transportation Network. A Boolean attribute IsStop
differentiates a TransportationNode that models a transportation intersection (i.e., valued as 1) or a
POI (i.e., valued by the Null value. IsRoad, IsMetro and IsRailway are three attributes that
differentiate the transportation network type a given node belongs to. Note that a
TransportationNode can denote TransportationSegments of different types including road, metro
or/and railway.
Definition 4: TransportationSegment
A TransportationSegment models a link between two TransportationNodes in the transportation network. A TransportationSegment is valued by a spatial attribute (i.e., of type line segment) along the Transportation Network, and ended by two TransportationNodes. The length of the geometry line is also recorded as an attribute. The attribute Type defines the different types of a
TransportationSegment, such as road, metro and railway. We assume that when TransportationSegments of different Types are overlapping they are represented as different
objects. The relationship between a TransportationSegment and a TransportationNode is also defined as a topological relationship Touch between a spatial line and a point. A given
TransportationNode is in relationship with one-to-many TransportationSegment while one given TransportationSegment should have two TransportationNode that denote the spatial origin and
destination of that segment, respectively.
Apart from the modeling constructs identified in the conceptual database schema presented in Figure 1, an additional spatio-temporal constraint is taken into account in order to reflect the complete semantics of the application. This constraint is as follows:
Spatial Constraint 1
All successive TransportationSegments that compose a given Route must be connected, that is, either the starting TransportationNode or the ending TransportationNode of that
TransportationSegment is either the starting or ending TransportationNode of another TransportationSegment of that Route.
2.4 Travel Pattern Module
TravelPatterns are considered as primitive components of the bilitiey model. We consider a
mobility pattern as an implicit aggregation of TravelPatterns. Definition 7: Route
A Route represents a path regularly chosen by one-to-many Individuals. Let use consider an
Individuali that travels along a transportation network and that generates a Trajectory. A Route is generalized from Trajectories that repeat routinely. Every Route starts at a Node and ends at a
Node. All the TransportationSegments and TransportationNodes passed through by are implicitly
temporally ordered. More formally a Route is modelled as a sequence of TransportationSegments. In order to represent the spatiality of a Route, we introduce the concept of Path defined as a sequence of TransportationSegments.
Pathi = [TransportationSegment1, TransportationSegment2,..., TransportationSegmentn];
In order to represent routine displacements we introduce a temporal regular interval that represents repetitive temporal patterns not pointing to a specific time in the calendar but a repetitive one.
TemporalCycle=<Regularity, Regular Interval>
An example of TemporalCycle is TimeSegment=<workdays, 08h-09h>. Then a route is defined as follows:
Routei=<Pathi, TemporalCyclei,TransportationMode>
In other words while an Individual can perform a Trajectory only once, he/she can follow the same Path many times, as well as he/she can make the same Route on a regular basis.
Definition 8: TravelPattern
A Route from a Node N1 to a Node Nm can be shared by several Individuals {i1,…,in}. A given
Route can be caused by different or similar Constraints (TripPurpose, TemporalConstraint...). A Routes can implicitly generate some TravelPatterns when performed on either regular or
non-regular frequencies.
Trajectories contain different Routes whose analysis reflects different TravelPatterns. While Trajectories and Routes are explicitly and precisely represented in space and time, TravelPatterns
are derived from Routes according to some frequency constraints.
TypeNumber>
A TravelPattern should reflect the different factors that influence an Individual’s travel decision. When selecting a TravelPattern, several factors influence a human decision. For example, when it’s raining in the morning on a workday, an Individual might choose to take a car to go to work, while he/her might walk and take a bus on a regular basis. The attributes of a TravelPattern contain the individual identifier, and the different constraints that influence them.
Overall, a TravelPattern is mainly generated and influenced by these external and internal constraints. These represent the basic mobility foundations of our modelling approach.
Human mobilities vary according to Individuals as the range of possible actions and activities is extremely large and reflect different socio-cultural backgrounds. Although our objective is not to develop an exhaustive model that will reflect all possible parameters that determine these patterns – this being surely unrealistic – we nevertheless decided to select a few objectives and individual attributes usually represented in social science studies such as gender, age, occupation, salary and role in the family. According to Hägerstraand (1970), human mobilty is often constrained by some social obligations. Therefore, it is reasonable to believe that these basic personal profiles can be used to depict some human categories that will reflect different backgrounds and then mobility patterns.
For example, by considering different economic conditions and occupations of a given family, travel modes might vary as a student is likely to take different travel decisions when compared to a full time adult employee. Moreover, since an Individual generally performs multiple travels and
Trajectories over a long period of time, an Individual itself is likely to influence several TravelPatterns during that period.
There are many factors that can influence Individual's travel decision that forms TravelPattern eventually. We generally classify these factors into five categories, which include
TemporalConstraint, TripPurpose, EnvironmentConstraint, SpatialConstraint. Indeed, individual
social characteristics as defined in the model also play an important role in the way a given individual mobilities in the city. Overall, an Individual is likely to own several Trajectories while each Trajectory reflects some TravelPatterns. These different types of constraint show different factors that can affect a travel pattern. In the Travel Pattern Module, some categories are spatial constraints and are denoted as SpatialConstraint and can include POIs and District. POIs might be for example a place where a given Individual plan to pass through when moving in the city (e.g., a supermarket), this place playing the role of a spatial constraint. Another example of spatial constraint might be given by the District where he/she lives or well known to him/her, that district being privileged when he/she moves in the city.
Regarding the impact of a TemporalConstraint over a TravelPattern, this represents different times such a day/night, rush hour/or not, weekday/weekend, holidays/or not. Indeed, the time of travel is likely to affect a TravelPattern. For example, if a girl travels walking and alone at night, she is likely to prefer a safer street. TemporalConstraint is made of different temporal granules that reflect the intervals mentioned above.
A TripPurpose is used to represent the purpose of a travel, including the things planned to be done by the Individual through traveling. For example, one plans to go to work at 8:00 am. In this case, “go to work” is the TripPurpose in the TravelPattern module. The activities of a human can be classified into sub-categories of PersonalActivity, FamilyActivity and BusinessActivity. Generally, different types of activities often result in different movement habits. For a BusinessActivity,
minimizing the time travel is often an important criterion to apply, while for a FamilyActivity this might not be the case.
The environmental context might also impact people's mind and decisions, that is, TravelPatterns when traveling. We specialise EnvironmentalConstraints into two categories, that is, the Social-
Environment and the NaturalEnvironment. The SocialEnvironment models some happenings close
to the travel environment, while the NaturalEnvironment includes some physical characteristics such as weather, landscape and so on. Overall, TemporalConstraints, EnvironmentalConstraints and TripPurpose are qualified by some specific attributes valued using some Tuple constructs and specific attributes. In the MADS model, a is-a link relates subtypes of Supertypes, and Supertypes attributes are inherited by their subtypes.
Last but not least, SpatialConstraint models the spatial properties that can impact the
TravelPattern of an Individual. As for the constraints previously introduced, SpatialConstraint
represents a category of factors influencing travel decisions. A SpatialConstraint can include points of interest (POI), districts people choose to travel and additional SpatialConstraints. Without loss of generality, POIs and District are taken as examples to illustrate a Spatial-
Constraint. A POI is a location of interest where someone find it useful or interesting and worth a
visit. A POI is spatially modeled as a point that denotes the location of this place people is interested in, such as a restaurant or a cultural monument. These places are most likely to become a source or a destination of a Trajectory. POI attributes may implicitly give some reasons for people to travel to this point of interest. District is another type of spatial object that can influence people's travel decisions. A city is usually divided in to several districts for administrative reasons. People’s movements in the city are indeed constrained by Districts. For example, in a city, people have tendency to go shopping in their own district for convenience. District is considered as a geometry Surface. These factors that can affect mobility patterns are denoted by appropriate spatial, temporal and spatial attributes, and spatial relationships that relate them to Trajectories. Constraint 2
The union of all the Districts forms a partition of the considered region of interest. 2.5 Relationships between Modules
Relationships are essential abstractions used to design the human mobility schema. Most often connections between the different modules are materialized by some specific relations that associate the different modeling abstractions identified. For instance, the Follow relationship between the object type Route and the object type Trajectory is a key abstraction of the
TravelPattern module, such as the temporal relationship between Route and
TransportationSegment. A TravelPattern is characterized by different factors in the TravelPattern
module. As for the relationship between the Travel Pattern Module and the Trajectory Module, multiple relationships have been modeled. The relationship between the Trajectory Module and the Travel Pattern Module denotes the indirect relation between TravelPattern and Individual, and finally represents the fact that every Trajectory belongs to an Individual. Indeed, the Individual abstraction plays a crucial role when modeling human mobilities, it can be seen as a dominant abstraction when modeling a travel pattern. One Individual can own one-to-many Trajectories and also can make more than one decision at different time, his/her travel decisions being the result of different constraints. A District is in spatial relationship with the Transportation Network. Considering the possible topological relationship between for instance TransportationSegments and Districts, it appears that possible relationships include Touch, Within and Intersect. These
relations are summarized in the database schema by the topological relation TopoGeneric (Figure 1). POIs play also an important role, as Trajectories, POIs reflect source, intermediate or destination nodes of a given travel. A POI is connected by an overlap topological relation with a
Node, but the respective POIs and Node sets being disjoint. Finally, POIs are likely to bring many
opportunities for further analysis when the whole model will be logically implemented and experimented with real data.
3. ANALYSIS OF Human Mobility in City Realm
3.1 Mobility Pattern Analysis Queries
Mobility pattern queries should provide explicit answers to questions related to the understanding of human's movements. Well-designed categories of queries applied to those data sets should facilitate a search for a better understanding of human mobility in the city realm. People’s travel patterns can be classified into three categories: spatial patterns, temporal patterns and spatio-temporal patterns (Dodge et al., 2008). The modeling approach developed by our research regarding the analysis of human mobility also considers the spatial, temporal and semantic levels as indeed the semantic dimension plays a significant role for human mobility pattern analysis. On top of the human mobility model suggested, one might expect some traveling analysis to be designed and performed. The queries involved all three dimensions of spatial, temporal and semantic levels.
(1) Semantic level
When considering the semantic level, queries usually deal with some generic dimensions that cover the “who”, “what”, “how” or “why” of the objects of interest(Claramunt & Thériault, 1996). Within the human mobility model, the semantic objects and attributes are mainly represented and described in the Travel Pattern Module, which reports the possible factors that can influence human mobility patterns. In this module, the semantic factors that denote some of the outcomes of people’s travel patterns are specified according to three complementary categories of properties:
Individual Profile, Trip Purpose and Environmental Constraint.
Although the Travel Pattern Module encapsulates most of the semantic data, or at least the richer part of the semantic data represented, there is still the opportunity to apply a few additional semantic queries on other modules. For instance, taking the object type Individual, it is possible to answer the basic question “Who is that individual?”. Qualifying and recognizing who is a moving individual should help to understand the reasons and regularities under which this individual makes such travel choices in the city. Overall, deriving a better knowledge of the individuals that travel in the city should provide a better view of the population dynamics in the city. By further analyzing the type of PointOfInterest and the types of Activity related to these trajectories, the character of a given individual can be roughly conjectured.
(2) Temporal level
The queries applied to the temporal level should help to discover regular or irregular patterns such as when some people start and stop when performing some trajectories and/or activities as well as the time spent (i.e., temporal interval) for performing that trajectory and/or activity. Indeed, temporal queries are essential to find out some routines or irregular human mobilities in the city, this being a valuable potential contribution transportation planning tasks in the city. Some of these temporal queries usually start with “When”, “How long”, “How often”. Such queries mainly should be preferably to the Trajectory Module.
(3) Spatial level
The queries of the spatial level mainly deal with data and attributes related to locations. The spatial entities have an explicit representation of their geometry. Apart from the very basic spatial query “Where is such individual?”, there are other queries of various types that can be performed. These queries might search for some specific geometrical properties such as metrics, directions or topological relationships.
(4) Spatio-temporal levels
Queries applied to the spatial and temporal levels combine spatial and temporal attributes of the objects represented by the human mobility model. They reflect questions related to the “Where and When”. “Where” usually refers to some trajectory spatial properties (e.g., origin and destination locations, path) or even some of the SpatialConstraints and TemporalConstraints introduced in the previous section. An interesting pattern that might be exhibited by such spatio-temporal queries is that they are likely to implicitly reflect some functional properties in the city. For instance, one might compare the trajectory footprints of a given Individual on a daily basis or the Trajectory that cross different neighborhoods on a given day. Further queries might even search for Trajectory clusters in space at different times. Some relevant examples can be “Search for daily differences and commonalities between the trajectories of a given individual.” and “Find all the trajectories that passed through a given road on the 6th Sept. 2009”. The “When” might refers to the start or end time of some Trajectories, or referring to the frequency of some human mobility’s occurrence. Travel patterns can be also studied at the aggregate level in order to reflect regular or irregular mobilities during a period of time.
(5) Semantic, spatial and temporal levels
In order to understand the mobility patterns of people in the city, queries should combine the semantic, spatial attributes and temporal attributes. The extent of semantic, spatial and temporal queries covers a large range of opportunities, they can be classified into queries referring either to individuals or sets of individuals. Queries applied at the individual level are likely to search for irregular or uncommon mobilities or specific searches to for instance explore a specific and personal travel planning task. For example, “Who are the individuals passed the specific road at a specific time?” and “What places does the individual usually visit in a specific time of a day?”
4. IMPLEMENTATION PRINCIPLES AND VALIDATION
The implementation of the human mobility model is performed on top of a spatial database system, PostgreSQL/PostGIS. PostgreSQL is an open source database that has the advantage of supporting user-designed extensions. PostGIS is the spatial extension of PostgreSQL object-relational database that provides spatial data types, spatial indexes and spatial data manipulation functions. We developed a PostgreSQL/PostGIS human mobility database based on the data model mentioned in the previous sections including entities modeled as trajectories, individuals, and relationships between them. As commonly done in database modelling, all entities identified by the human mobility model in the previous section are mapped to relational tables The Gist-Index and B-tree indexes offered by PostgreSQL/PostGIS have been applied to speed up both spatial and temporal queries. Data manipulation operations as well as spatial-temporal operations have been implemented as functions at the interface level.
Functions constitute basic and useful components of search queries. A spatial database should usually offer a series of operators and functions that mainly deal with location-based criteria, either quantitative (e.g., metrics) or qualitative (e.g., topological). Nowadays, many basic spatial operators and functions are most often available in current spatial database system, such as Oracle Spatial, PostGIS etc. These functions include metrics and geometry constructors (e.g., distance, length, buffer), topological operators (e.g., cross, within, touch). However, such operators and functions are not always sufficient for specific applications with high-level semantics such as for the analysis to be conducted by our study oriented to the analysis of human mobility patterns. At least, some specific functions should be derived and aggregated with some explicit semantics that will fit the functions required by our approach. Such functions should directly and explicitly search form some people’s mobility patterns, and should be built to deal with spatial, temporal and semantic data.
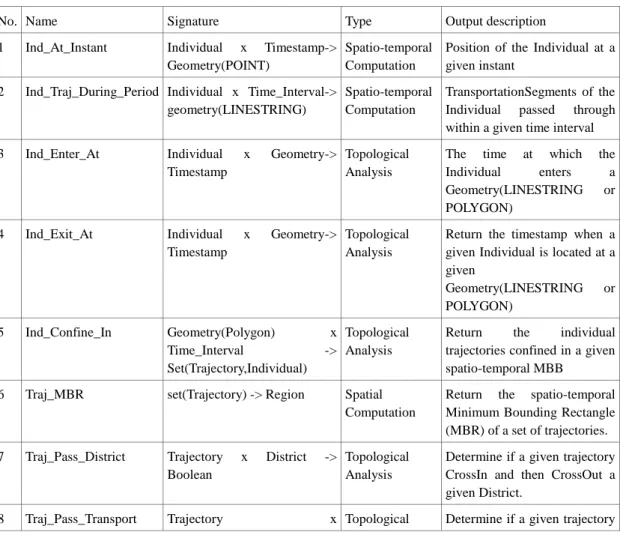
Taking the Human Mobility Model and the category of mobility pattern queries as the basic foundation of our approach, functions and queries are designed for discovering human mobility in the city. The design of these functions is based on the three categories discussed in the previous section. In order to take into account the complexity of the human mobility pattern analysis, most of the functions identified combine the spatial, temporal and semantic dimensions. Specific geometrical and topological operators have been derived from a categorization suggested in a related work (Wu et al., 2014). Table 1 gives a list of functions designed so far including the function signature and a brief description.
Table 1 List of Functions
No. Name Signature Type Output description
1 Ind_At_Instant Individual x Timestamp-> Geometry(POINT)
Spatio-temporal Computation
Position of the Individual at a given instant
2 Ind_Traj_During_Period Individual x Time_Interval-> geometry(LINESTRING)
Spatio-temporal Computation
TransportationSegments of the Individual passed through within a given time interval 3 Ind_Enter_At Individual x Geometry->
Timestamp
Topological Analysis
The time at which the Individual enters a Geometry(LINESTRING or POLYGON)
4 Ind_Exit_At Individual x Geometry-> Timestamp
Topological Analysis
Return the timestamp when a given Individual is located at a given Geometry(LINESTRING or POLYGON) 5 Ind_Confine_In Geometry(Polygon) x Time_Interval -> Set(Trajectory,Individual) Topological Analysis
Return the individual trajectories confined in a given spatio-temporal MBB
6 Traj_MBR set(Trajectory) -> Region Spatial Computation
Return the spatio-temporal Minimum Bounding Rectangle (MBR) of a set of trajectories. 7 Traj_Pass_District Trajectory x District ->
Boolean
Topological Analysis
Determine if a given trajectory CrossIn and then CrossOut a given District.
(TransportationSegment) -> Boolean
Analysis CrossIn and then CrossOut a given TransportationSegment. 9 Traj_Nearest_POIs StartTraj EndTraj(Trajectory)
x Distance -> set(POI)
Buffer Computation
Find the POIs within a given distance to a start or end point of the trajectory.
10 Traj_Direction Trajectory -> Bearing Spatial Computation
Return the bearing of a given trajectory.
11 Traj_Co-direction Trajectory x Trajectory -> Boolean
Spatial Comparison
Determine if two trajectories are heading a similar direction 12 Ind_Find_Route Individual x Time_Interval->
Set(Route)
Aggregation Find the route from the trajectories of a given Individual during a given time interval.
13 Traj_Fit_Route Trajectory x Route -> Boolean Spatio-temporal Comparison
Determine if the trajectory follows existing routes. 14 Ind_Share_Path set(individual) -> set(path) Aggregation Search for the paths shared by
given trajectories. 15 Trans_Avg_Speed set(TransportationSegments) x
Timestamp -> Speed
Spatio-temporal Computation
Return the average speed of a given TransportationSegment over a given time interval.
4.2 Trajectory dataset
The queries implemented are performed and executed based on a real trajectory dataset extracted from the city of Beijing. This GPS trajectory dataset was collected by the Geolife project (Microsoft Research Asia) (Zheng et al., 2008; Zhen et al., 2010; Zheng et al., 2009) by 178 users over a period of four years (from April 2007 to October 2011). A GPS trajectory of this dataset is represented by a sequence of time-stamped points, and whose attributes are latitude, longitude and altitude. This dataset contains 17,621 trajectories with a total distance of 1,251,654 kilometers and a total duration of 48,203 hours. These trajectories were recorded by different GPS loggers and GPS-phones, and have a variety of sampling rates. 91 percent of the trajectories are logged in a dense representation, e.g. every 1~5 seconds or every 5~10 meters per point.
This dataset recorded a broad range of users’ outdoor movements, including transportation modes. While some of the users have carried a GPS logger for a few years, others only have used a similar setup for few weeks. The names of the individuals in the database and the queries are simulated because the personal information of the users is not available. The transportation data and other spatial data of the city of Beijing City came from public domain spatial datasets, including the road and subway networks, districts, and a series of POIs extracted from the Baidu Map service. ( Lbsyun Baidu, 2016)
4.3 Trajectory pre-processing
In order to associate the trajectories extracted from the Geolife project with the transportation network a map matching process has been processed. The map matching algorithm implementation is mainly based on the constraint-based method proposed by Brakatsoulas et al. (2005). The principle behind this approach is to match the trajectories segment per segment and by taking into account graph connectivity and spatio-temporal constraints (i.e., distance covered by a
trajectory between two transportation segments should be plausible) applied to route segments. The whole process has been performed by specifically developed PL/PGSQL functions of PostgreSQL. TransportationSegments and TransportationNodes are identified and model the underlying transportation network. TransportationSegments that appear regular are candidate routes.
4.4. Implementation results
We introduce a series of queries that illustrate the potential of our modelling approach. These queries combine PostgreSQL/PostGIS language capabilities with the functions defined in the previous sections. Overall these queries show some queries that manipulate the semantic, spatial and temporal dimensions.
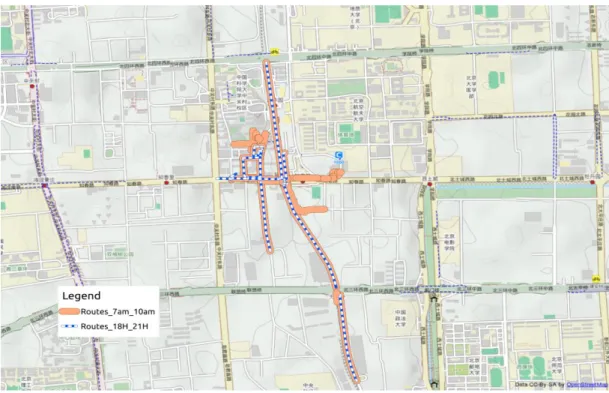
Query 1: What are the road segments that Li Lei performed during the time interval 7am to 10 am? And what are the road segments that Li Lei regularly repeated during the time interval 6pm to 9pm?
Select Ind_find_route(id, '7:00:00', '10:00:00') from IndividualTable where name = 'Li Lei' ; Select Ind_find_route(id, '18:00:00', '21:00:00') from IndividualTable where name = 'Li Lei';
The function Ind_Find_Route(IndividualId, StartTime, EndTime) is encapsulated in these two queries and whose results are illustrated by Figure 2. This function returns the Routes followed by Li Lei during the time intervals given. These two queries implicitly make a difference between routes performed by a given Individual early in the morning and late afternoon. It appears from the query results illustrated in Figure 2 that the routes performed in the late afternoon are more flexible than the ones performed in the early morning. This might reflect a relatively large set of activities performed by this individual after work, and on the other hand much less flexibility in
the morning and more regular route and trajectory patterns. This is an illustrative first example on how the exploration of trajectory patterns can implicitly reveal some human mobility and activities in the city.
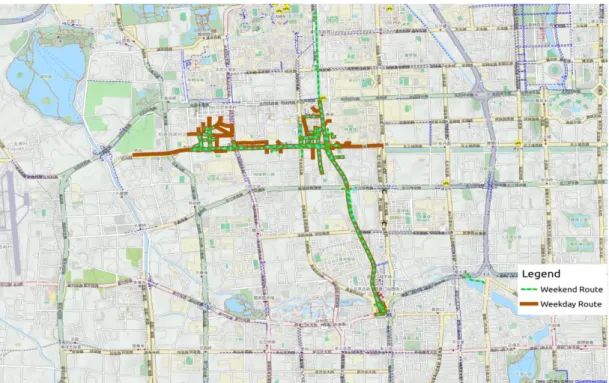
Query 2: What are the segments that Li Lei regularly repeated during weekdays and weekends? Select Ind_find_route(id, 'weekday') from IndividualTable where name = 'Li Lei' ;
Select Ind_find_route(id, 'weekend') from IndividualTable where name = 'Li Lei';
The function Ind_find_route is applied in these two queries and searches for the routes performed by this Individual during weekdays and weekends. They allow to make a difference between people’s habits in weekdays and weekends and to analyze people’s lifestyle differences. Figure 3 illustrates the range of routes follows. It clearly appears that the geographical range of the routes followed during weekdays is smaller than the range of the ones followed during weekends, this also shows regular activity patterns during weekdays and on the contrary less activity patterns during weekends but with a larger geographical extent.
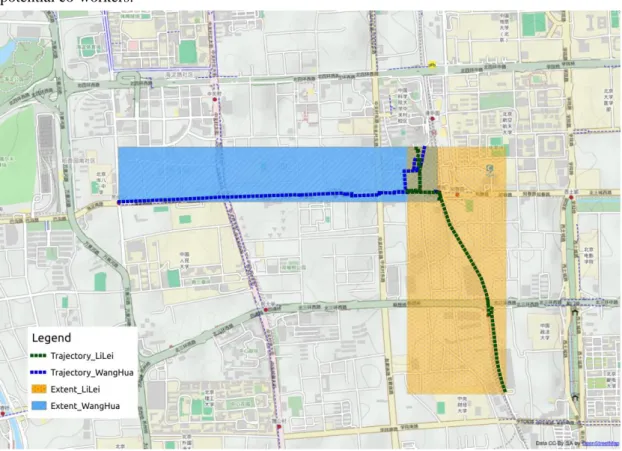
Query 3: What is travel extent covered by Wang Hua and Li Lei from 9am on Sept. 21 2008?
Select Traj_MBR(union(trajectory.id))from TrajectoryTable traj, IndividualTable indiv where traj.individualid = indiv.id and (indv.name = ‘Wang Hua’ or indiv.name = 'Li Lei') and extract(hour from starttime)>9;
The function Traj_MBR(TrajectoryId) is encapsulated in this query. This function returns the minimum bounding rectangle (MBR) of the given trajectories. The objective of this query is to
reveal the respective geographical extent of the trajectories performed by some given Individuals for a given time interval. Rather than comparing the exact geometry of the trajectories performed by this given Individual, the idea behind this function is to visually compare the overall regions covered, these regions being derived by a MBR. When some given Individuals share some geographical regions, this might reveal some noteworthy patterns and potential common interests when behaving in the city. Figure 4 shows the result of this query applied to two given Individuals. In this specific case the figures that appear show that the two individuals share a close location at the end of their trajectories in the morning. It might be then possible that the two individuals are potential co-workers.
Figure 4. Geographical range of trajectories performed by individuals during a given time
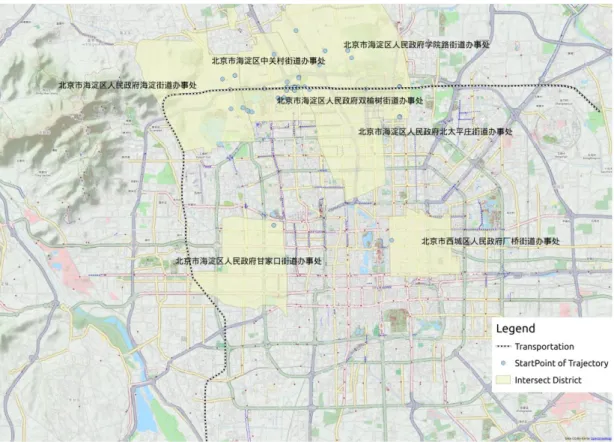
Query 4: Search for the districts some individuals that take the subway line 10 between 6am and 9am come from?
Select district.id, district.geom from district, TrajectoryTable trj, TransportationSegmentTable seg, TransportationTable trans where Traj_PassTransport (trj.id, seg.id) and extract(hour from trj.starttime) between 6am and 9am and seg.roadid = trans.id and trans.name = 'subway line 10' and st_within(trj.startpt,district.geom);
The function Traj_PassTransport(Trajectory.Id, TransportationSegment.Id) is applied to this query. This Boolean function returns True when a given Trajectory passes through a given
TransportationSegment. The aim of this query is to explore and search for the locations people
came from when taking the subway Line 10 in the morning. In the city of Beijing, this might allow to search for transportation crowd patterns, a potential valuable information for transportation planners. The result of that query is shown in Figure 5. It appears that the Individuals who take the subway Line 10 in the morning mainly came from locations in the North West of the city.
Query 5: Search for the most regular routes followed by individuals in the afternoon from 5pm to 7pm? And which are overall the most popular paths followed by most individuals in the afternoon from 5pm to 7pm?
Select rou.id, num, trans.name, trans.type, seg.geom from (select sum(array_length(trajs,1)) num, rou.segmentid from RouteTable rou group by segmentid order by num desc limit 15), TransportationTable trans, TransportationSegmentTable seg where rou.segmentid = seg.id and trans.id = seg.roadid;
18
Select rou.id, num_indiv, trans.name, trans.type, seg.geom from (select count(rou.individualid) indiv, rou.segmentid from RouteTable rou group by segmentid order by indiv desc limit 15), TransportationTable trans, TransportationSegmentTable seg where rou.segmentid = seg.id and trans.id = seg.roadid;
These two queries apply spatio-temporal aggregations. The results are illustrated in Figures 6 and 7. The aim of the queries is to find the most popular routes performed in the city for a given time interval as well as the busiest ones. This should reveal some aggregated travel habits. The query
results reveal the routes performed most regularly by individuals (first query, i.e., the top 15 routes) and the busiest ones (second query). Figure 6 shows the busiest routes while Figure 7 outlines the ones performed most regularly and might reveal some regular patterns when observing people’s routes. It appears that the most popular routes are relatively dispersed in the city, while routes repeated by most individuals are more concentrated in one region. The number of aggregated individuals in the Figure 7 is relatively small as a few people follow regular routes. This reflects the diversity of human mobility pattern in this city.
Query 6: Where does the individual named ‘Li Ming’ usually start and end its trajectories before 9:00 in the morning? What are the possible destinations?
Select Traj_Nearest_POIs((select endpt from TrajectoryTable traj, IndividualTable indiv where indiv.id = traj.individualid and indiv.name = ‘Li Ming’ and extract(hour from traj.starttime) < 9),50);
The function Traj_Nearest_POIs(Trajectory.StartPT/EndPT, Radium) is applied to this query. This function returns the nearest Point of Interests near either the Start or End of the Trajectory within a given distance. The query results illustrated in Figure 8 show that morning destinations are relatively restrained to a small region. One might conclude that this regular pattern in the
neighborhood of his/her home is likely to be a trajectory to his/her place of work. POIs close to this destination area might represent possible workplaces of this individual. One might even explore possible workplaces according to the POI categories present in this area. On the other hand trajectories performed in the morning to reach the potential workplace reflect a relative diversity, a possible reason being probable stops to breakfast stores. As for the previous queries, it appears that in most cases the straight analysis of trajectory patterns can reveal some social
activities and habits, and this with almost no incoming data and information on the social properties exhibited by the incoming trajectory dataset considered for this experimental evaluation.
The computing performance of the queries introduced above show that the implementation based on the Human Mobility model is capable of mining large human transportation data extracted from raw GPS data. All queries were executed on an Intel Core i7 processor with 8 GB RAM running Linux with 7.2.1 CentOS. Execution times range from a few milliseconds to a few hundred milliseconds this being always acceptable at the interface and user levels. For instance, execution times of the two queries of Query 5 are the faster ones (i.e., execution times are 6.325ms and 3.149ms). These very fast execution times are due to the fact that they manipulate semantic attributes only. Query 3 (i.e., execution time 426.244 ms) and Query 6 (i.e., execution time 608.800ms ) are slightly slower although still fast. This is due to the fact that they involve a table join encapsulated in the predefined functions Traj_MBR and Traj_Nearest_POIs, respectively. Conversely, Query 1 (i.e., execution time 1331.423 ms and 1094.187 ms), Query 2 (i.e., execution time 12707.713 ms and 6258.714 ms) and Query 4 (i.e., execution time 11704.87ms) are the slower queries as they involve functions that encapsulate spatial operators an several table joins. These execution times remain acceptable despite the fact that spatial, semantic and temporal operators are applied, and whose results are visually displayed at the interface level. Overall, it clearly appears that the extensibility of PostgreSQL/PostGIS has proven to favor the implementation of the Human Mobility model developed, as well as the specialized functions suggested.
5. CONCLUSION
The research developed in this paper introduces a spatio-temporal database conceptual approach whose objective is to model human trajectories in an urban environment and to provide some data manipulation and analysis capabilities. The Human Mobility data model developed integrates different modeling concepts at the semantic, spatial and temporal levels. The model identifies several primitive notions such as Individual, TransportationSegment, Trajectory and Route abstractions, as well as the relationship between them and the underlying spatial networks. In particular, the main properties of the urban and transportation networks are taken into account as well as a series of temporal and spatial constraints that apply. On top of the PostGIS and PostSQL database systems, several specific query functions have been identified and implemented. It appears from the implementation achieved that these functions developed to manipulate the semantic, temporal and spatial dimensions can be successfully implemented. The principles of the approach can be first extended to other generic and specific data manipulation operators, as well a possibility to be further distributed as an open source package.
The whole modeling approach has been implemented and applied to a large trajectory dataset available in the city of Beijing. The preliminary query results exhibited show that the implementation has proven to be robust and computationally efficient. A series of illustrative queries show the potential of the whole approach, particularly the capability to derive some social activities from a raw trajectory dataset. Further work will be oriented to the implementation of additional integrity constraints whose objective will be to strengthen the underlying database model, including activity constraints and environmental constraints. At the application level, we plan to extend the capabilities of the system developed so far by the design of a human mobility prediction models. To conclude we believe that such developments will provide additional perspectives for urban transportation and planning studies.
REFERENCES
Alvares, L. O., Bogorny, V., Kuijpers, B., de Macedo, J. A. F., Moelans, B., & Vaisman, A. (2007). A model for enriching trajectories with semantic geographical information. Proceedings of the 15th
Annual ACM International Symposium on Advances in Geographic Information Systems - GIS ’07, (i), 1. https://doi.org/10.1145/1341012.1341041
Andrienko, N., Andrienko, G., Pelekis, N., & Spaccapietra, S. (2008). Basic concepts of movement data. In Mobility, Data Mining and Privacy: Geographic Knowledge Discovery (pp. 15–38). https://doi.org/10.1007/978-3-540-75177-9_2
Chen, B. Y., Yuan, H., Li, Q., Shaw, S.-L., Lam, W. H. K., & Chen, X. (2016). Spatiotemporal data model for network time geographic analysis in the era of big data. International Journal of
Geographical Information Science, 30(6), 1041–1071.
https://doi.org/10.1080/13658816.2015.1104317
Chen, W., Ji, M. H., & Wang, J. M. (2014). T-DBSCAN: A spatiotemporal density clustering for GPS trajectory segmentation. International Journal of Online Engineering, 10(6), 19–24.
https://doi.org/10.3991/ijoe.v10i6.3881
Claramunt, C., & Thériault, L. (1996). Towards semantics for modeling spatiotemporal processes within gis. In Seventh International Symposium on Spatial Data Handling, SHD’96 (pp. 1–12). Dodge, S., Weibel, R., & Lautenschütz, A.-K. (2008). Towards a taxonomy of movement patterns.
Information Visualization, 7(3–4), 240–252. https://doi.org/10.1057/PALGRAVE.IVS.9500182
Goodchild, M. F., Yuan, M., & Cova, T. J. (2007). Towards a general theory of geographic representation in GIS. International Journal of Geographical Information Science, 21(3), 239–260. https://doi.org/10.1080/13658810600965271
Hägerstraand, T. (1970). WHAT ABOUT PEOPLE IN REGIONAL SCIENCE? Papers in Regional
Science, 24(1), 7–24. https://doi.org/10.1111/j.1435-5597.1970.tb01464.x
Huff, J. O., & Hanson, S. (1986). Repetition and Variability in Urban Travel. Geographical Analysis,
18(2), 97–114. https://doi.org/10.1111/j.1538-4632.1986.tb00085.x
Inoue, R., & Tsukahara, M. (2016). Travel Pattern Analysis from Trajectories Based on Hierarchical Classification of Stays. International Conference on GIScience, Short Paper Proceedings, UC Berkeley, 1. https://doi.org/10.21433/B3111WV9S715
Jiang, S., Ferreira, J., & González, M. C. (2012). Discovering urban spatial-temporal structure from human activity patterns. The ACM SIGKDD International Workshop, 95.
https://doi.org/10.1145/2346496.2346512
Kitamura, R. (1988). An evaluation of activity-based travel analysis. Transportation. https://doi.org/10.1007/BF00167973
Parent, C., Spaccapietra, S., & Zimányi, E. (2006). Conceptual modeling for traditional and
spatio-temporal applications: The MADS approach. Conceptual Modeling for Traditional and Spatio-Temporal Applications: The MADS Approach. https://doi.org/10.1007/3-540-30326-X
Pentland, A., & Liu, A. (1999). Modeling and Prediction of Human Behavior. Neural Computation,
11(1), 229–242. https://doi.org/10.1162/089976699300016890
Renso, C., Baglioni, M., de Macedo, J. A. F., Trasarti, R., & Wachowicz, M. (2013). How you move reveals who you are: Understanding human behavior by analyzing trajectory data. Knowledge
and Information Systems, 37(2), 331–362. https://doi.org/10.1007/s10115-012-0511-z
conceptual view on trajectories. Data and Knowledge Engineering, 65(1), 126–146. https://doi.org/10.1016/j.datak.2007.10.008
Tang, L., Kan, Z., Zhang, X., Yang, X., Huang, F., & Li, Q. (2016). Travel time estimation at
intersections based on low-frequency spatial-temporal GPS trajectory big data. Cartography and
Geographic Information Science, 43(5), 417–426.
https://doi.org/10.1080/15230406.2015.1130649
Zheng, Y., Li, Q., Chen, Y., Xie, X., & Ma, W.-Y. (2008). Understanding mobility based on GPS data. In Proceedings of the 10th international conference on Ubiquitous computing - UbiComp ’08 (p. 312). https://doi.org/10.1145/1409635.1409677
Zheng, Y., Xie, X., & Ma, W. (2010). GeoLife: A Collaborative Social Networking Service among User, Location and Trajectory. IEEE Data Eng. Bulletin, 33(2), 32–40.
https://doi.org/10.1.1.165.4216
Zheng, Y., Zhang, L., Xie, X., & Ma, W.-Y. (2009). Mining interesting locations and travel sequences from GPS trajectories. In Proceedings of the 18th international conference on World wide web -