HAL Id: hal-01009095
https://hal.archives-ouvertes.fr/hal-01009095
Submitted on 5 Jan 2019
HAL is a multi-disciplinary open access
archive for the deposit and dissemination of sci-entific research documents, whether they are pub-lished or not. The documents may come from teaching and research institutions in France or abroad, or from public or private research centers.
L’archive ouverte pluridisciplinaire HAL, est destinée au dépôt et à la diffusion de documents scientifiques de niveau recherche, publiés ou non, émanant des établissements d’enseignement et de recherche français ou étrangers, des laboratoires publics ou privés.
Use of structural monitoring for updating reliability
analysis: application on pile-supported wharves
Humberto Yáñez-Godoy, Franck Schoefs, Anthony Nouy
To cite this version:
Humberto Yáñez-Godoy, Franck Schoefs, Anthony Nouy. Use of structural monitoring for updating reliability analysis: application on pile-supported wharves. 4th International ASRANet Colloquium, 2008, Athène, Greece. �hal-01009095�
Athens, Greece, paper 74, 10 pages, proc. on CD-Rom.
USE OF STRUCTURAL MO NITORING FOR UP-DATING
RELIABILITY ANALYSIS : APPLICATION ON PIL E-SUPPORTED
WHARVES
H. Yáñez-Godoy, OXAND S.A., France
F. Schoefs and A. Nouy, GeM, Nantes Atlantic University, France ABSTRACT
Optimization of the maintenance of existing structures requires accurate models for describing their real behavior. The structural monitoring of complex structures is actually the only way for reaching as close as possible their real in-service behavior. We present here a reliability analysis of pile-supported wharves whose containers cranes are submitted to extreme storm loading. The modeling of in-service behavior of these structures in conjunction with structural monitoring allows assessing the level of loading and provides more realistic models. A stochastic modeling takes into account the large scatter of measured quantities. It lets to identify main random fields influencing mechanical behavior. A decomposition on polynomial chaos of random identified fields and wind loading acting on a container crane is then selected. A performance criterion, based on wharf displacement and in line with the so-called Service-Limit-States is suggested for reliability analysis.
1. INTRODUCTION
Optimization of the maintenance of existing structures requires accurate models for describing their real behavior. During these last decades, developments focus on the modeling of materials including the updating from inspections [1] [2]. The survey of structures (displacement) gives additional information but the updating of the modeling is a great challenge when a lot of influencing factors are involved. Thus, intrusive structural monitoring of complex structures is actually the only way for reaching as close as possible their real in-service behavior. We present here a reliability analysis of pile-supported wharves whose containers cranes are submitted to extreme storm loading.
First the reliability context and the considered safety margin are introduced. Then two instrumented wharves are presented. The instrumentation strategy and the analysis of results are then addressed. It allows introducing a simple but consistent mechanical modeling. It leads to identify main random fields influencing mechanical behavior. A decomposition on polynomial chaos of random identified fields and wind loading acting on a container crane is then selected. A performance criterion, based on wharf displacement and in line with the so-called Service-Limit-States is suggested for reliability
analysis. We make use of non-intrusive methods, particularly projection method and Monte-Carlo simulations. Projection method has a highly accuracy in representing the response distribution tails allowing to post-evaluate the probability of failure. A comparison with a great number of Monte-Carlo simulations is then accomplished to verify the accuracy. Finally, sensitivity studies are then performed to rank the set of basic variables and to analyze the effect of the choice of the critical value of the performance criterion.
2. RELIABILITY ANALYSIS
PROBLEM OF PILE-SUPPORTED WHARVES
The behavior of pile-supported wharves is conditioned by several hazards in particular because of the difficult conditions of building and uncertainties on extreme loadings (storms). Storm conditions play a dominant role as they act on cranes; they are of major importance for re-analysis of old structures which were designed without taking these situations into account. The updating of wind speed due to climate changes increases the need of suitable models. Reliability analysis gives efficient tools to perform such computations as long as boundary conditions of the structural model are known with a given uncertainty.
The owner (PANSN) requires a maximum displacement along each wharf of 0.015 m. In fact, wharf displacement produces a soil displacement, a soil decompression and then irreversible soil settling between platform and embankment. This situation can lead to the structure no more operational for several months. We consider a limit state performance criterion:
G = umax(X) – uc (1)
where umax is the maximum displacement along
the wharf, uc the critical or acceptable
displacement and X =
{
X1,X2,...,XM}
the vector of basic random variables. Characteristics of these variables are computed in section 5. Realizations of the random variable umax are estimated by a 2-Ddeterministic model based on Timoshenko theory (showed in section 5). Expert judgment provides a value of 0.015 for uc. The probability of failure is
calculated then as Pf = P(umax > 0.015 m).
Resultant wind loadings acting on a container crane for every wharf are applied to the 2-D model for the most critical situation: downstream zone for TMDC-4 wharf and upstream zone for Cheviré-4 wharf. 3. PILE-SUPPORTED WHARVES STRUCTURES AND INSTRUMENTATION 3.1 TECHNOLOGICAL DESCRIPTION OF THE WHARVES
The two in-service monitored pile-supported wharves presented here are located in the estuary of the river Loire, in the west of France. They are managed by the Port Authority of Nantes Saint-Nazaire (PANSN). Collaboration with the PANSN permitted the survey of the structures. These studies deal with the extension of the timber terminal of Cheviré, the station 4 (so called Cheviré-4 wharf) and the extension of the containers terminal of Montoir (so called TMDC-4 wharf). TMDC-4 and Cheviré-4 wharves are very similar structures; their detailed description is available in [3]. The first one is 250 m long and 43 m wide and the second one is 180 m long and 34.50 m wide. A sketch of a typical cross section and main components is presented on Figure 1.
Another main difference between TMDC-4 wharf and Cheviré-4 wharf is their technological anchoring device. In the case of TMDC-4, tie-rods are fastened to the back-wharf wall by a ball-joint;
during the laying down of the tie-rods, this anchorage device can present a gap that leads to very light loads in case of wharf displacement. In
the case of Cheviré-4, tie-rods are anchored in the back-wharf wall by means of a connecting rod.
Figure 1. Cross section of a pile-supported wharf
Main functions filled by wharves are:
• ship support for berthing and mooring;
• connection between ship and open area: support for operational charges and discharges from ships;
• ground support.
Each component plays a specific role in the functioning of the pile-supported wharf in a functional context.
3.2 STRUCTURAL INSTRUMENTATION
An original instrumentation strategy has been achieved: it aims following the global behavior of every wharf during at least 5 years after building with a view to improve prediction models. These validated models will allow basing the maintenance policy on a better understanding of the in-service behavior. Indeed, the large dimensions of these structures, the building hazards and the soil behavior imply the service behavior is very different from the expected design one induced by the choice of conservative and too theoretical hypotheses at the design stage.
We achieved this aim by monitoring key components of the structure which are hardly accessible after the building period and the sensitivity of which can be measured with the
paper 74, 10 pages, proc. on CD-Rom.
actual available accuracy of sensors. The objective being the understanding of the wharf behavior under horizontal loading − actions of the embankment, ship berthing and wind action on the cranes −, we chose then to monitor the tie-rods.
Each wharf has been instrumented on twelve tie-rods (regularly distributed along the length of the structure) in order to follow the normal load in the tie-rods cross-section. In the case of the TMDC-4 wharf, some sets of two vibrating wire strain gauges diametrically opposed and clamped by means of flanges screwed on the cylindrical steel bar have been used. In the case of Cheviré-4 wharf, resistive strain gauges have been used: two gauges bonded parallel to the axis of the rod and diametrically opposed, and two others bonded perpendicular to the rod, mounted in a full Wheatstone bridge acting as an elongation sensor and avoiding bending effects. For both instrumentations, the sensors were required not to affect the corrosion protection of the tie-rods. The two tie-rods at the ends of the TMDC-4 wharf have been monitored with 3 couples of vibrating wire sensors, instead of one, in order to study the evolution of the normal load and the moment bending along the rod.
In addition, sensors measuring the water level in the embankment (piezometers) are implanted behind the back-wharf wall and linked to a “Campbell Scientific CR10X” data logger; 3 piezometers on the Cheviré-4 wharf at both ends and in the middle and 2 on the TMDC-4 wharf at one end and in the middle. Finally, some tidal gauges (controlled by PANSN) measure the real tide level every 5 minutes. In the case of the TMDC-4, two tidal gauges are located in Donges (4 km upstream) and in Saint-Nazaire (2 km downstream), which permits to interpolate the water level in front of the wharf. For the Cheviré-4, a tidal gauge is located 1 km downstream the Cheviré bridge.
4. ANALYSIS OF THE MONITORING DATA
The analysis is performed at the tie-rods level. The main steps are:
• data collection provided by the data logger;
• analysis of the untreated data and their physical meaning;
• data processing in order to highlight relevant correlations.
The acquisition period is 30 minutes, ensuring to observe the tide effects on the landing. The untreated signals saved by the acquisition system provide the local physical measurements; these are frequencies in the case of the TMDC-4 and electric voltages in the case of the Cheviré-4. A classical pre-processing of the measurements must be made in order to deduce the normal load in the tie-rods [4]. Uncertainties of measurements are estimated: they are less than 20 kN for the TMDC-4 wharf and 10 kN for the Cheviré-TMDC-4 wharf.
All the measures taken into account for the present analysis are for non-operational service period (interval October 2002 to July 2003 for TMDC-4 wharf, interval January 2004 to October 2005 for Cheviré-4 wharf).
Two types of variations characterize the loads in the tie-rods:
• temporal: medium-term variations, where we
question the levels of loads during a month (period of the moon rotation) and short-term variations where we are interested in the amplitude of the loads during a tide with a period of approximately 12 hours;
• spatial: variations of the load along the wharf,
in each spatially distributed tie-rod.
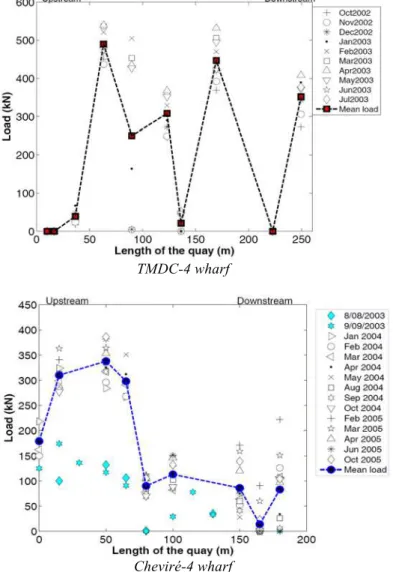
The medium-term load variations in the tie-rods studied for the two wharves show a small evolution [3]. They come on the one hand from the embankment loading and the service life conditions and on the other hand from the seasonal cycles of the tide. The analysis of the spatial load variations shows an important scatter from a tie-rod to another. These variations are presented in Figure 2 where a line joins the entire mean load measured in tie-rods. This spatial variation of load shows a very distinct behavior of the in-service structure in comparison to the hypothesis assumed at the design stage. The research on the reasons of this variability taught us to have a prompt survey during the phase of construction. It underlines the need to define well the way of laying down
tie-rods in order to keep an in-service behavior as close as possible to the assumed and computed one. We concentrate then on the modeling of the behavior of tie-rods in next section.
TMDC-4 wharf
Cheviré-4 wharf
Figure 2. Medium-term loading evolutions in each wharf
In the case of the short-term evolutions, we identified an essential cyclic component carried by the tide in order to study the sensitivity of the loads in the tie-rods to these evolutions. A survey of the effect of the tide on the load of the tie-rods allowed highlighting a phenomenon of stiffening of the complex soil-rod-anchoring plate in presence of tides of high coefficient [3]. Figure 3 shows, in the case of Cheviré-4, the sensitivity of loading variation ΔF (ΔF = F(xi, tmax, θk) – F(xi,
tmin, θ k)) to a given decrement of water ΔH (ΔH =
Hmax – Hmin) for high tide coefficients. Ranges RΔH
in Figure 3 are identified on the basis that the mean variation inside the range is less than 10%. We consider that the relationship between ΔF(xi,θ)
and the variation of the level of water ΔH(θ) in each range is piecewise constant. Figure 4, shows an example, in the case of Cheviré-4 wharf, for the short-term loading spatial variation in the range
RΔH = [4 m ; 4.6 m]).
Figure 3. Variation of the measured normal load in the tie-rods of Cheviré-4 wharf according to water level variation of
the river Loire during falling tides of high coefficient
Figure 4. Short-term loading spatial variation in the tie-rods of Cheviré-4 wharf during falling tides of high coefficient
5. MECHANICAL-PROBABILISTIC MODELING
In such a study where sources of uncertainty and hazards are various, major contributions of randomness should be identified [5]. The question is: which potential sources of hazards explain the big scatter of load distribution with space for each pile-supported wharf?
The sources of risk and uncertainty come mainly from the laying down of the tie-rods [4] [6]. On the other hand, stiffness k of the steel rod is very sensitive and can be increased or decreased by several phenomena [4] [6]: a gap in the
paper 74, 10 pages, proc. on CD-Rom.
technological anchoring device (example: TMDC-4 wharf), soil elasticity around the anchoring plate, soil-tie-rod interaction and a bending state of the tie-rod. The structure-soil interactions are very hard to determine. In fact, a fine model should integrate, on one hand, several soil properties (by nature random variables) which are hard to quantify for service behavior, and on the other hand, several load and bending measures along different tie-rods.
In order to model the passive tie-rods behavior in embankment, we choose a simple elastic model with only one mechanical parameter k(x, θ). This variable can represent the soil-tie-rods-anchoring plate interaction (STRAP interaction) and justifies loading variability along the wharf [4] [6]. This parameter is very sensitive to both building uncertainties (placing of the tie-rods) and natural hazard of the embankment. For the TMDC-4 wharf, additional parameter δ0(x, θ) represents the laying down of tie-rods. This uncertainty is eliminated for the Cheviré-4 wharf due to its connecting rod device. These random variables are considered as independents.
5.1 MECHANICAL MODELING
Reliability analysis suggests carrying out uncertainty and sensitivity studies before and during modeling in order to provide robust probabilistic models as input to limit state functions. We analyze effects of randomness around the main mechanical model which describes accurately the wharf behavior by means of a finite element model.
We have developed two mechanical models in order to represent spatial behavior along the wharf subjected to horizontal loading: the first one is based on a 3-D finite-element meshing and the second one is an equivalent 2-D model. Both of 3-D wharf models are widely detailed in [4] [6].
The 3-D model is considered as the referential model, but it is convenient to choose a simpler model in order to decrease computation time. The 2-D model is based on Timoshenko beam theory. The parameters of this model are taken from the 3-D model [4] [6]. The platform is modeled by a Timoshenko beam; each row of piles in a
horizontal plane (ex
!
,e!y) is modeled by a e!y-axis spring; tie-rods are modeled with bar elements. The simplified model allows taking into account the shear effects which come from ship mooring or transverse crane loading due to wind action.
5.2 STOCHASTIC MODELING
Loading on the tie-rods (F) is characterized by the spatial and time dependant stochastic process: random loading in tie-rods at position x and time t,
F(x, t, θ). Measurements from sensors are discrete realizations F(xi, tj, θk) of this process. A time
interval is chosen where the field is stationary (with respect to time). The correlation seems important from one tie-rod to the other. However the fact of representing the stochastic process by only one variable k(θ) allows reducing complexity in order to concentrate efforts on a robust development of the method of identification of random variables in sub-section 5.4.
5.3 MEDIUM-TERM AND SHORT-TERM BEHAVIOR STUDY
In order to identify random variables k and δ0, we consider two behaviors of the wharf in function of embankment loading acting on the back-wharf wall: medium-term and short-term behavior. The first one let to estimate parameter δ0 and the second one, parameter k. In addition, estimate medium-term embankment loading is necessary by both reason of ignorance of lateral earth pressure and actual impossibility of his estimation with numerical models. On the one hand, limit state analysis cannot give a good upper bound to measured loads (see Figure 2) and on the other hand, finite element methods require testing a big number of unknown and non measurable parameters. This situation leads us to transfer all the hazard and uncertainty on the random variables k and δ0.
Inverse method is used to estimate embankment loading. Resolution principle is illustrated in Figure 5. Embankment loading is considered as uniform along each structure and is modeled by punctual loads in every anchorage point. We introduce an arbitrary value for the embankment loading to the 2-D model, we obtain then loads in
tie-rods and we evaluate a performance function (see next sub-sections). Finally, this performance function is minimized by simplex algorithm [7].
Figure 5. Resolution principle of the inverse method
5.3 (a) Medium-term embankment loading calculation
The optimization problem is given by the least square method:
( )
(
E)
F E F F E λ min arg = (2)where FE is the medium-term embankment
loading;
λ
( )
FE is the performance function given by:( )
(
( )
(
)
)
⎟⎟ ⎠ ⎞ ⎜⎜ ⎝ ⎛ − =∑
= n i d E i c e i mes e E F x F x F k F 1 2 , ' ', , λ (3)where xi’ denotes for TMDC-4 and Cheviré-4
mean loaded tie-rods where measures are available (see Figure 2); in fact, for Cheviré-4, we consider
two different loading embankment zones: upstream and downstream zones, due to a high soil settling recorded in upstream zone during the building phase;
(
i E d)
c
e x F k
F ', , is the computed load in the tie-rod xi’ with a design stiffness kd
(59.6 MN/m for TMDC-4, 61.9 MN/m for Cheviré-4); Fe,mes
( )
xi' is the mean measured load in tie-rods in abscise xi’. Embankment loadingsobtained are: 731 kN for TMDC and 640 kN (upstream zone) and 189 kN (downstream zone).
5.3 (b) Short-term embankment loading calculation
We estimate short-term embankment loading for each RΔH showed in Figure 3. The corresponding
optimization problem is given by :
(
)
(R )(
(
TL(
H)
)
)
F H TL R F R F H TL Δ Δ Δ λ Δ Δ Δ min arg = (4)where ΔFTL(RΔH) is the short-term embankment
loading or tide loading for each RΔH;
(
Δ
FTL(RΔH))
λ
is the performance function given by:(
)
(
)
∑
(
(
)
)
= − = n i H d H TL i c H TL R F x F R k F R F 1 2 ) ( ), ( , Δ Δ Δ Δ Δ Δ Δ λ (5) where xi denotes for TMDC-4 and Cheviré-4 meanloaded tie-rods where measures are available (see Figure 4);
(
i TL H d)
c k R F x F , ( ), Δ Δ Δ is the computed load in the tie-rod xi with a design stiffness kd;ΔF(RΔH) is the mean load for each RΔH showed in
Figure 3.
5.4 IDENTIFICATION OF THE RANDOM VARIABLES
In order to systematize the identification of random variables, a representation of every variable – wind loading, Fv, gap, δ0, in the
ball-joint device of TMDC-4 wharf and stiffness, k, of the STRAP interaction for both wharves – with polynomial chaos (PC) decomposition is chosen. The selected estimator of fitting is the maximum likelihood [8]. The aim of this procedure is to identify the coefficients xi of the one-dimensional
polynomial chaos decomposition for every random variable x
( )
θ
. The chaos decomposition of a random variable is written:( )
(
)
∑
(
)
= = = p i i iH x x x 0 ) ( ) (θ ξ θ ξ θ (6)where p is the order of the PC decomposition, ξ(θ) the Gaussian germ, i.e. a standardized normal variable and Hi the Hermite polynomial of degree i.
The problem is then to identify the coefficients from N samples
{
}
N j j x 1 )(θ = . By using the maximum likelihood method, coefficients xi are solutions of
the optimization problem: 2-D FE Model Computed Loads in tie-rods xi Performance function evaluation Simplex Algorithm Minimization Embankment loading
paper 74, 10 pages, proc. on CD-Rom. ) ( max arg χ χ χ L = (7)
where χ = [x0,…,xp] is the vector of coefficients
with dimension (p+1), and L is the likelihood function:
(
)
∏
= = N j j x x p L 1 ); ( ) (χ θ χ (8)The likelihood function (8) starts with values very close to the numerical precision. Then the problem (7) is modified into:
(
)
(
( ))
min arg χ χ χ L Log − = (9)The algorithm for solving the optimization problem (9) is detailed in [9] [10]. We make use of this algorithm to estimate coefficients xi for every
random variable. Distributions of every random variable are well represented by a PC of degree 3. Results are presented in the next sections.
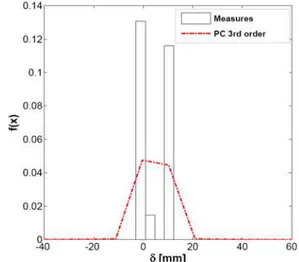
5.4 (a) Gap, δ0, in the ball-joint device of TMDC-4 wharf
We determine the gap in the ball-joint device from embankment loading on the 2-D model. This loading calculated by inverse analysis is 731 kN every 6.65 m. Figure 6 shows the final histogram and the probability density function (pdf) obtained by a PC of degree 3. The pdf presents practically two overall blocks representing two populations of tie-rods. This reflects the influence of building conditions on this wharf: one population of preloaded tie-rods before embankment building phase (negative gaps) and one population presenting positive gaps. Details of this estimation are available in [4].
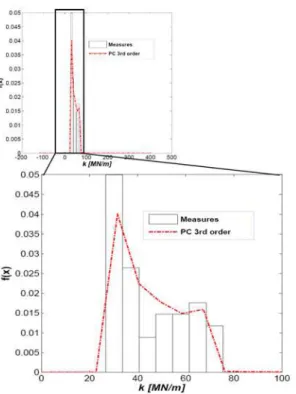
5.4 (b) Stiffness, k, of the STRAP interaction
We determine the stiffness of the STRAP interaction for every wharf from a winter falling tide loading on the 2-D model. Figures 7 and 8 show two histograms and their pdf obtained by a PC of degree 3 of both wharves. As we can see, the two populations of tie-rods of the TMDC-4 are included by the distribution. Details of this estimation are available in [4].
Even the modeling is very simple, it is interesting to observe that the distribution of stiffness is very
close from one wharf to the other (design stiffness
kd is 59.6 MN/m for TMDC-4 and 61.9 MN/m for
Cheviré-4).
Figure 6. Distribution of the gap, δ0, in the ball-joint device of TMDC-4 wharf; mδ
0 = 4.6 mm, σδ0 = 6.5 mm
Figure 7. Distribution of the stiffness, k, of tie-rods of Cheviré-4 wharf; mk = 61.2 MN/m, σk = 9.1 MN/m
Figure 8. Distribution of the stiffness, k, of tie-rods of TMDC-4 wharf; mk = 45.2 MN/m, σk = 14.5 MN/m
5.4 (c) Wind loading
The stochastic field of wind velocity is based on both a statistical analysis of wind velocity data at a height of 10 meters (reference velocity) during 33 years of measurements, and the knowledge of the profile function of velocity with respect to the height z, knowing the reference velocity. Weibull distribution, which fits the distribution tail quite well, is selected. The crane is overall 63 meters high, the jib, 40 meters long and the distance between legs d is about 20.8 meters. The resultant of loading applied by wind on a one-dimension structural component between nodes N and P is given by a physical response surface [11]:
(
)
∫
= P N v x p dz C S F α (10) with 2 2 1 z v Up = ρ ; where S is the projected area of component cross section onto the wind direction, Cx the drag coefficient, pv, the wind
pressure, α the wind direction versus wharf axis (here 45°), ρ the air density [kg/m3] and Uz the
kinematics field of wind velocity [12]. The deduced intensity distribution of the wind loading projected onto wharf plane and the pdf obtained by a PC of degree 3 is plotted in Figure 9. The two resultant wind loadings are correlated. Details are available in [4] [13].
Figure 9. Distribution of the wind loading intensity, Fv, in
the horizontal plan
6. COMPUTATION OF THE PROBABILITY OF FAILURE
6.1 PROJECTION METHOD
We are interested in maximal displacements umax
obtained by the determinist 2-D mechanical model. Loadings applied to the 2-D model are medium-term embankment loading and wind action loading. We can search an approximation of u~max(X) defined by:
{ }
(
)
∑
− = = = 1 0 1 1 1 max( ( ),..., ( )) ~ P j M k k j j M M u H X X u ξ ξ ξ (11)where
{
ξ
1,...,ξ
M}
are the standardized normal variables used to develop every input random variable X l{
M}
l, ∈ 1,..., , and
{
H0,...,HP−1}
isthe polynomial chaos (PC) basis. Here, the basis functions are chosen orthonormal, i.e.
(
HiHj)
ijE =δ . For a polynomial chaos of degree
p in dimension M, the number of basis functions is
1 ) ! ! ( )! ( + − = M p M p
P . The coefficients of the PC decomposition are defined by:
(
u H)
u X y H y( )
y dy E uj j j M M ϕ∫
= = R ) ( )) ( ( ~ ~ max max (12)paper 74, 10 pages, proc. on CD-Rom. where
( )
⎟⎟ ⎠ ⎞ ⎜⎜ ⎝ ⎛ − = − 2 exp ) 2 ( 2 2 / y y M M π ϕ is themultinormal probability density function.
Integral of the function in (12) can be obtained by Gauss quadrature [14]. The Gaussian quadrature formula writes: ≈
∫
u X y H y M y dy RM ( ( )) j( ) ( ) ~ max ϕ(
M) (
M)
M M i i j i M i i N i i N i y y H y X y X u w w ~ ( ),..., ( ) ,..., 1 1 1 1 1 max 1 1∑
∑
= = ⋅ ⋅ ⋅ ⋅ ⋅ ⋅ ≈ (13) where the(
y ,...,1 yN)
and(
w1,...,wN)
are theone-dimensional Gauss-Hermite integration points and weights. These integration points are the N roots of one-dimensional Hermite polynomial of degree
N, denoted HN . Integration weight wi can be
calculated as follows:
{
N}
i y NH w i N i 1,..., ) ( 1 2 1 ∈ ∀ = − (14)From integration points we can calculate by using the isoprobabilistic transformation the values of
{
( ),..., ( )}
1
1 yi XM yiM
X from which we calculate the
response distribution max
~
u . The number of
computations of the deterministic 2-D model is NM.
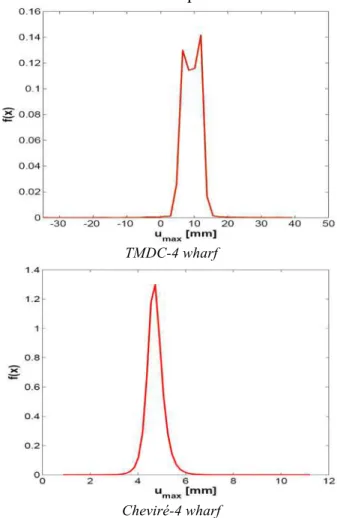
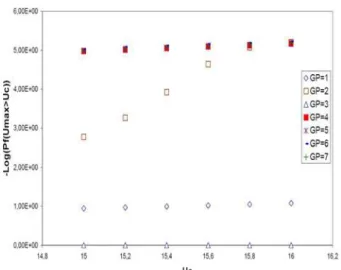
Once coefficients in equation (12) are calculated, we can represent the response distribution which allows post-evaluating the probability of failure (see Figure 10). Figure 11 shows the uc vs. the log
of the probability of failure for TMDC-4 wharf (interval [15 mm; 16 mm]) and Pf values for the
most critical situation (downstream wharf zone). Results show convergence for N = 4 Gauss Points (GP). For Cheviré-4 wharf, if we consider uc = 15
mm, Pf is quasi null. We have accomplished
several samples of Monte-Carlo simulations to verify the accuracy of the calculated Pf for
TMDC-4 wharf; for 1.105 samples, reference value for uc = 15 mm is Pf = 6.72e-3 ± 7.69% error,
either Pf = [6.2e-3; 7.2e-3]. Calculated value with
projection method, Pf = 6.79e-3, falls into this
interval. Taking into consideration values range of probability of failure considered in Euronorms for service limit states, the obtained level is lower [15]. For TMDC-4, sensitivity studies has shown that parameter k taken into account as deterministic is
more influential here for a uc = 15 mm: Pf =
7.05e-3. If uc is less than 15 mm, k taken into
account as random can become most influential. This underlines the effect of the choice of the critical value of the performance criterion.
For the phase of non exploitation of these wharves and thanks to their over sizing design, operation in service is not altered by extreme storm loading events. The ulterior modifications of these structures due to their exploitation will make primordial this analysis within a framework of maintenance and new qualification.
7. CONCLUSIONS
The complexity of wharves and their behaviour has been presented. The modelling of in-service behaviour in conjunction with structural monitoring of two structures has allowed assessing the level of loading and has provided more realistic models for mechanical behaviour and values for their mechanical parameters.
TMDC-4 wharf
Cheviré-4 wharf
Figure 10. Distribution of the wind loading intensity, Fv, in
Figure 11. Probability of failure for TMDC-4 wharf
A stochastic modeling has taken into account the large scatter of measured quantities and building hazards for these complex structures. A decomposition of random variables on polynomial chaos has been selected and has shown to represent well the basic variables when considering maximum likelihood estimate. It allows providing an automatic treatment of data for similar monitored structures. The probability of failure, based on a performance criterion, is deduced using non-intrusive methods and a determinist structural model. Both similar structures but with different technological anchoring device showed that mechanical stiffness
k of their loaded tie-rods is very similar. Loadings
measured in TMDC-4 are most important than Cheviré-4. This reason leads to a major Pf for the
first one. The probability of failure obtained is considered as acceptable for both wharves.
ACKNOWLEDGEMENTS
The authors would like to thank the Port Authority of Nantes Saint-Nazaire for their technical support and expert judgment.
REFERENCES
1. ROUHAN A, SCHOEFS F., 2003, ‘Probabilistic modeling of inspection results for offshore structures’, Journal of Structural Safety,
Vol. 25, pp 379-399.
2. FABER M.H., SORENSEN J.D., 2002,
‘Indicators for inspection and maintenance planning of concrete structures’, Journal of
Structural Safety, Vol. 24.
3. YÁÑEZ-GODOY H., SCHOEFS F., CASARI P., 2008, ‘Statistical Analysis of the Effects of Building Conditions on the Initial Loadings of On-piles Quays’, Journal Structural Health Monitoring (in press).
4. YAÑEZ-GODOY H., 2008, ‘Mise à jour de variables aléatoires à partir des données d’instrumentations pour le calcul en fiabilité de structures portuaires’, Thèse Sciences de l’ingénieur, Nantes, France : Université de Nantes, Institut de Recherche en Génie Civil et Mécanique.
5. VERDURE L., SCHOEFS F., CASARI P., YAÑEZ-GODOY H., 2005, ‘Uncertainty updating of an on-pile wharf after monitoring’, Proceedings
of the 9th International Conference on Structural Safety and Reliability (ICOSSAR 2005), Rome, Italy, pp 1347-1354.
6. VERDURE, L., 2004, ‘Cadre statistique du suivi en service des ouvrages de génie civil : application à un quai sur pieux’, Thèse Sciences de
l’ingénieur, Nantes, France : Université de Nantes, Institut de Recherche en Génie Civil et Mécanique.
7. LAGARIAS J.C., REEDS J.A., WRIGHT M.H., WRIGHT P.E., 1998, ‘Convergence Properties of the Nelder-Mead Simplex Method in Low Dimensions’, SIAM Journal of Optimization,
Vol. 9, No. 1, pp 112-147.
8. DESCELIERS C., SOIZE C., GHANEM R., 2007, ‘Identification of chaos representations of elastic properties of random media using experimental vibration tests’, Computational
Mechanics, Vol. 39, No. 6, pp 831-838.
9. SCHOEFS F., YÁÑEZ-GODOY H., NOUY A., 2007, ‘Identification of random material properties from monitoring of structures using stochastic chaos’, Proceedings of the 10th
International Conference on Applications of Statistics and Probability in Civil Engineering (ICASP10), Tokyo, Japan.
10. YÁÑEZ-GODOY H., SCHOEFS F., NOUY A., 2008, ‘Overall “soil-sod-anchoring plate” stiffness identification of a monitored pile-supported wharf by a polynomial chaos representation’, Journal Structural Safety (submited to Journal in August 2007).
11. SCHOEFS F., 2008, ‘Sensitivity approach for modeling the environmental loading of marine structures through a matrix response surface’,
Reliability Engineering and System Safety, Vol. 93, Issue 7, pp 1004-1017.
paper 74, 10 pages, proc. on CD-Rom.
12. CSTB, 1995, ‘Traité de physique du bâtiment,
Tome 1: connaissances de base’, Centre
Scientifique et Technique du Bâtiment, 832 p. ISBN 2-86891-240-0.
13. YÁÑEZ-GODOY H., SCHOEFS F., NOUY
A., CASARI P., 2006, ‘Extreme storm loading on in-service wharf structures: interest of monitoring for reliability updating’, European Journal of
Environmental and Civil Engineering, special edition « Fiabilité des matériaux et des structures, analyse des risques », vol. 10, no. 5, pp 565-581. 14. BERVEILLER M., 2005, ‘Éléments finis
stochastiques : approches intrusive et non intrusive pour des analyses de fiabilité’, Thèse Sciences de
l’ingénieur. Clermont-Ferrand, France :
Université Blaise Pascal – Clermont II, Laboratoire de Mécanique et Ingénieries.
15. CALGARO J.A., 1996, ‘Introduction aux
Eurocodes : sécurité des constructions et bases de la théorie de la fiabilité’, Paris : Presses de