ARC FAULT IN A CLOSED CONTAINER: CFD SIMULATIONS AND
EXPERIMENTAL TESTS ON REPRESENTATIVE SIMPLE
GEOMETRIES
P PONTELANDOLFO¹*, D GRECO
1, L FELBERBAUM
2, G THWAPIAH
2AND R
PUTZU
1¹University of Applied Sciences Western Switzerland, HEPIA, 1202, Geneva, Switzerland
²Sécheron SA, 1202, Geneva, Switzerland
*piero.pontelandolfo@hesge.ch
ABSTRACT
Computational Fluid Dynamics (CFD) calculations of electrical arc fault in a closed encapsulation are here compared with experimental data. The scope of the work is to understand the aerodynamic phenomena occurring when an electrical arc appears between two electrodes. The investigation focuses on both fixed and moving arc. The CFD analysis is used to identify the aerodynamic characteristics inside the encapsulation. A dedicated apparatus is designed and built to perform experimental tests. 1. INTRODUCTION
The understanding of the phenomena occurring in low-voltage switches generated during the switch-off process is a very challenging problem and the experimental simulation is very complex and expensive. Moreover, the visualization of the phenomena and the measurement of the various physical quantities can sometimes become prohibitive.
The objectives of this work are to evaluate the pressure rise due to an internal DC arc in electrical installation, investigate the dynamics of the fluid inside the installation when the internal arc occurs and model the interaction between electric arc and the pressure waves due to the encapsulation by the balance of pressure and self-induction Laplace forces.
CFD simulations of the pressure rise due to arcing faults are studied in literature [1]. In the present work, investigations performed with the commercial software ANSYS® Fluent® are presented for simple geometries. The calculation
of the magnetic field is performed by the commercial software COMSOL Multiphysics®. In order to validate the numerical results, experimental campaign are undertaken. The numerical simulations are performed by the "Groupe de Competence de MEcanique des
Fluides et procédés Énergétiques" (CMEFE),
HEPIA's laboratory and the experimental tests by "Sécheron SA".
The pressure rise inside an enclosed volume due to arc fault is determined by a portion of the electrical energy [2]. The ratio between the energy leading to the pressure rise and the total electrical energy, well known in literature as thermal transfer coefficient “kp”, is considered and implemented in the numerical simulations [3]. The simulations are based on the solution of the fundamental aero and thermodynamics conservation laws. Moreover, the arc is considered as a uniform thermal energy source. The presented results are calculated for different source configurations: fixed arc and moving arc. 2. SIMULATION SETTINGS
The numerical investigations are performed solving the basic fluid mechanics equations. The investigations are performed assuming air behaving as an ideal gas and adiabatic walls. The effects of the turbulence are neglected and the "Rosseland" [4] radiation model is used. The electrical arc is modelled as a cylindrical and uniform thermal source. The time dependent value of the arc energy is extrapolated from the experimental data and is introduced by a User Defined Function (UDF) into the code by using a
kp factor. The use of the kp fitting parameter
means that only the kp% of the total electrical
pressure rise. A SIMPLE (Semi-Implicit Methods for Pressure Linked Equations) is used for the pressure calculation.
In order to avoid anisotropic pressure waves numerical diffusion inside the volume, a tetrahedral mesh is preferred to a hexahedral one. 3. FIXED ARC: GEOMETRY 1
Two tests are performed for the enclosure, here presented as "geometry 1". For these cases, the experimental cell has an internal volume of 2.43 litres, see Figure 1. In this configuration, two copper electrodes are placed 100 mm far from the bottom of the volume. The arc is triggered by a thin metallic wire and the electrical discharge is provided by discharge electrolytic capacitors. A piezoresistive pressure sensor (KELLER, type PA-25) placed 200 mm far from the bottom of the volume is used to measure the overpressure levels. The tests are performed at initial ambient pressure.
The position of the arc remains fixed between the extremities of the two electrodes inside the volume. The kp used in the numerical simulations
is 0.3156. The electrical energy inserted at the electrodes ("E", see Figure 2) and the maximal electrical current ("imax", see Figure 3) of the two
different configurations analysed for the
geometry 1 are given in the Table 1.
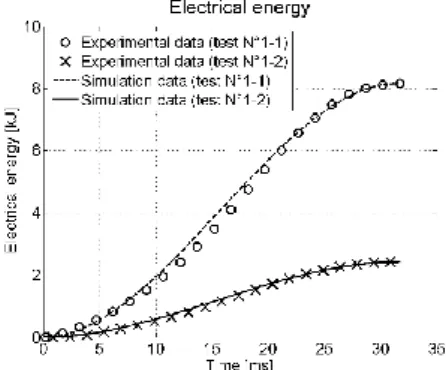
TEST N° E imax 1-1 8.2 kJ in 31.5 ms 2717 A 1-2 2.4 kJ in 31.5 ms 1166 A 2-1 197 kJ in 34.3 ms ~32000 A 3-1 18.2 kJ in 30.3 ms 2920 A 3-2 19.7 kJ in 22.3 ms 3840 A
Table 1: Main characteristics of the fixed arc test 1-1 and 1-2
As shown in Figure 4, a good agreement between experimental and numerical pressure rise is observed. The shift between experimental and numerical data here observed is due to the energy absorbed by the melting of the arc triggering wire.
Figure 2: Measured (circle and cross marks) and calculated (dashed and solid lines) time dependence of electrical energy inserted inside the volume, for fixed arc test 1-1 and 1-2
Figure 3: Measured (circle and cross marks) and calculated (dashed and solid lines) time dependence of electrical current, for
fixed arc test 1-1 and 1-2
Figure 4: Measured (circle and cross marks) and calculated (dashed and solid lines) energy dependence of pressure rise inside the volume, for fixed arc test 1-1 and 1-2
Electrodes
Pressure probe position Enclosure
volume
4. FIXED ARC: GEOMETRY 2
A quad-flanged geometry of 70 litres internal volume, here presented as "geometry 2", is numerically investigated to reproduce an experimental test conducted by Prof. Pietsch at Aachen University laboratory. For this geometry
2, the numerical domain does not reproduce the
experimental shape. In this case, the numerical field is a simplified cubic enclosure with the internal volume of 70 litres. This second numerical investigation, tailored on an experiment performed in the Aachen institute, is intended to give a more reliable validation of the numerical methodology. As in the other cases, the tests are performed at initial ambient pressure.
For this second case, a kp factor of 0.38 is taken.
The electrical energy inserted inside the volume ("E", see Figure 5) and the maximal electrical current ("imax") of the configuration analysed for
the geometry 2 are given in the Table 1.
As in geometry 1, Figure 2 shows a good agreement between experimental and numerical results in terms of pressure rise. Moreover, another outcome of this simulation is that, as shown in Figure 6, different encapsulation geometries with the same volume do not affect the value of the pressure rise.
Figure 5: Measured (diamond marks) and calculated (dashed line) time dependence of electrical energy inserted inside the volume, for fixed arc test 2-1
Figure 6:Measured (diamond marks) and calculated (dashed line) time dependence of pressure rise inside the volume, for fixed arc test 2-1
5. MOVING ARC: GEOMETRY 3
The enclosure here presented as "geometry 3" has an internal volume of 9.7 litres, see Figure 7. Two parallel round copper electrodes are placed 100 mm far from the bottom of the volume. The distance between the electrodes is 50 mm and their length is 115 mm. As for the previous cases, the electric arc is triggered by a thin metallic wire.
As for the "geometry 1", a piezoresistive pressure sensor (KELLER, type PA-25) placed 200 mm far from the bottom of the encapsulation is used to measure the overpressure. The tests are performed at initial ambient pressure. In order to capture the arc movement, a high speed camera (CASIO Exilim Pro EX-F1, operated at 1200 frames per second) is used with a lens' light filter. To allow the visualization, a part of the frontal enclosure wall is built in transparent polycarbonate material. Figure 8 and Table 2 show some snapshots and related experimental information taken during the test campaign. The electrical arc is modeled as a cylindrical uniform thermal energy source, moving from the bottom trigger to the top end of the electrodes. Arc radii of 5, 10, 15 and 20 mm are investigated in CFD simulations for each configuration. The arc movement is calculated by the equilibrium between the magnetic force and the pressure gradient on the external surface of the source. The force calculation leading to the arc motion is performed thanks to dedicated Fluent® User-Defined Functions (UDFs). The evaluation of the self-induced magnetic force acting on the arc is performed with COMSOL multiphysics® software. The simulation is performed with a kp
factor of 0.3156.
The electrical energy inserted inside the volume ("E") and the maximal electrical current("imax")
of the two different configurations analysed for the "geometry 3" are given in the Table 1. A good agreement between experimental and numerical results, in term of pressure rise inside the enclosure volume is observed as shown in
Figure 9. Notice that, for the test N°3-1
mentioned in Table 1, a security valve is used to vent the enclosure at 0.12 MPa of overpressure. Compared with the experimental data, the presented model overestimates the arc speed (see
Figure 10). Considering the parametric study
conducted varying the arc radius, the results of
Figure 10 show that the bigger the arc radius, the
lower the arc velocity. Finally, Figure 10 shows that the higher electrical current occurring in test 3-2 brings to a higher arc speed with respect to test 3-1.
Snapshot # Time [ms] I [A] u [V]
a) 0 40 -
b) 10 120 72
c) 40 260 72
Table 2: Information on snapshots shown in Figure 8
Figure 9: Measured (circle and cross marks) and calculated (dashed and solid lines) energy dependence of pressure rise inside the volume, for moving arc test 3-1 and 3-2
Figure 10: Calculated (circle and cross marks) arc radius dependence of the arc average speed (the arc moves from the triggered position to the end of the electrodes) and experimental observation, for moving arc test 3-1 and 3-2
CONCLUSIONS
A good agreement between experimental data and CFD results is obtained in term of pressure rise both for fixed and moving source. Nevertheless, the proposed methodology for the moving arc position estimation overestimates the arc speed. It has to be noticed that the definition of the arc radius is crucial to determine the arc speed, which can be of paramount importance in the interaction of the aerodynamics with the arc. REFERENCES
[1] M. Iwata, K. Anantavanich and G. J. Pietsch (2011), IEEE TRANSACTIONS ON POWER DELIVERY, VOL. 26, NO. 3, 1700-1709. [2] M. Iwata, K. Anantavanich and G. J. Pietsch (2008), Proc. XVIIth Int. Conf. on Gas Discharges and their Appl., Cardiff, UK, pp. 189-192
[3] F. Lutz and G. Pietsch, Proc. 6th Int. Conf. Gas Discharges their Appl., 1980, pp. 270–273, Inst. Elect. Eng. Conf. Publ.
[4] R. Siegel and J. R. Howell., Thermal Radiation Heat Transfer, Hemisphere Publishing Corporation, Washington DC, 1992.
ACKNOWLEDGMENTS
The authors would like to acknowledge the Prof. Pietsch of Aachen University laboratory for his support and for the experimental tests he performed. Stylised electrodes Arc c) b) a) Electrodes Enclosure volume Pressure probe position Triggered arc position 1 1 5 m m
Figure 7: Geometry 3 (moving arc), internal volume of 180x180x300 mm3
Figure 8: Snapshot of the arc: a) arc in its triggered position, b) and c) arc moving in different instants