HAL Id: hal-02116958
https://hal.archives-ouvertes.fr/hal-02116958
Submitted on 1 May 2019
HAL is a multi-disciplinary open access
archive for the deposit and dissemination of
sci-entific research documents, whether they are
pub-lished or not. The documents may come from
teaching and research institutions in France or
abroad, or from public or private research centers.
L’archive ouverte pluridisciplinaire HAL, est
destinée au dépôt et à la diffusion de documents
scientifiques de niveau recherche, publiés ou non,
émanant des établissements d’enseignement et de
recherche français ou étrangers, des laboratoires
publics ou privés.
Insulator-to-Proton-Conductor Transition in a Dense
Metal–Organic Framework
Satoshi Tominaka, François-Xavier Coudert, Thang D. Dao, Tadaaki Nagao,
Anthony K. Cheetham
To cite this version:
Satoshi Tominaka, François-Xavier Coudert, Thang D. Dao, Tadaaki Nagao, Anthony K. Cheetham.
Insulator-to-Proton-Conductor Transition in a Dense Metal–Organic Framework.
Journal of
the American Chemical Society, American Chemical Society, 2015, 137 (20), pp.6428-6431.
�10.1021/jacs.5b02777�. �hal-02116958�
Insulator-To-Proton-Conductor Transition
in a Dense Metal–Organic Framework
Satoshi Tominaka,*
,†,‡François-Xavier Coudert,
§Thang D. Dao,
‡Tadaaki Nagao,
‡and Anthony K. Cheetham*
,†Department of Materials Science and Metallurgy, University of Cambridge, Cambridge CB3 0FS, UK. E-mail: Tominaka.Satoshi@nims.go.jp (S.T.) E-mail: akc30@cam.ac.uk (A.K.C.).
ABSTRACT: Metal-organic frameworks (MOFs) are prone to exhibit phase transitions under stimuli such as changes in pressure, temperature or gas-sorption because of their flexible and responsive structures. Here-in, we report that a dense MOF, ((CH3)2NH2)2[Li2Zr(C2O4)4], exhibits an abrupt increase of proton conductivity from <10–9 S cm–1 to 3.9 × 10⁻⁵ S cm–1 at 17°C (activation energy, 0.64 eV) by exposure to humidity. These conductivities were determined using single crystals, and the structures were analyzed by X-ray diffraction and X-ray pair distribution function analysis. The initial anhydrous structure transforms to another dense structure via topotactic hydration (H2O/Zr = 0.5), wherein one fourth of Li ions are irreversibly rearranged and coordinated by water molecules, and this structure further transforms into a third crystalline structure by water uptake (H2O/Zr = 4.0). The abrupt increase of con-ductivity is reversible and is associated with the latter reversible structure transformation. The H2O molecules coordinated to Li ions, which are formed in the 1st-step transformation, are considered to be the proton source, and the absorbed water molecules, which are formed in the 2nd-step, are considered to be proton carriers.
Phase transitions in solid-state materials lead to non-linear changes in properties that can play key roles in the development of innovative, functional materials. Nanoporous metal-organic frameworks (MOFs), which are composed of metal cations and anionic organic linkers,1 exhib-it an unusual range of phase transexhib-itions under relatively mild condexhib-itions because of their flexible and responsive structures. For example, both high spin–low spin2 and open pore–closed pore transitions have been observed as a function of temperature and guest loading.3 In the case of dense MOFs,4 a reversible, pressure-induced transition with extensive bond rearrangements has recently been described.5 Herein, we report that a dense anhydrous MOF, (dma)2[Li2Zr(ox)4], I, (dma = dimethyl ammonium, ox = oxalate) transforms to another dense structure, phase
II, via topotactic hydration. Phase II exhibits an abrupt increase of
pro-ton conductivity by at least four orders of magnitude on further exposure
to humidity, which transforms the structure to another crystalline phase,
III. When the humidity is reduced, it is not possible to return to phase I,
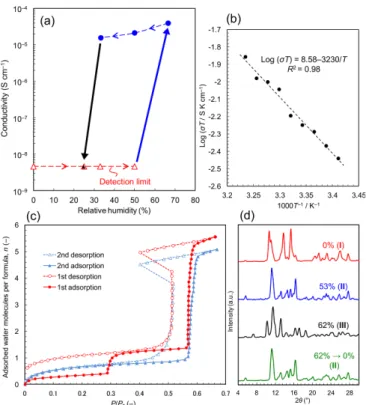
but only to phase II. In general, humidity-induced phase transitions are rare because changes in humidity are normally insufficient to induce a change in the crystal structure of a dense material. To our knowledge, the only previous examples concern disorder–order transitions in organic materials,6, 7 crystal structure transformations in salts by hydration (e.g., iron sulfate),8 and structural transformations in microporous MOFs.9 Figure 1a shows humidity-dependent proton conductivities measured by the single crystal impedance method (Fig. S1).10, 11 The as-synthesized crystal, I, is insulating up to 50% RH with a conductivity that is lower than the detection limit of the system (~5 × 10⁻⁹ S cm–1). How-ever, increasing the humidity to 67% results in an abrupt transition to a state with a conductivity of 3.9 × 10⁻⁵ S cm–1 at 17°C; this in fact is phase
III. With decreasing humidity, the conductivity slightly decreases but
retains a high value of 1.6 × 10⁻⁵ S cm–1 down to RH = 33% (correspond-ing to phase II). The high conductivities are stable overnight and com-parable to those of classic solid-state materials (10–3 to 10–8 S cm–1)12 as well as MOF-based materials.10, 13-18 On further lowering the RH to 25% the material becomes insulating again due to the formation of II, but the high conductivity can be recovered by increasing the humidity to 67% (Fig. S1). These single-crystal measurements using microelectrodes themselves indicate the potential application of this material as a conduc-tivity switching device in response to humidity changes, as reported for electronic conductivity19, 20 and magnetic properties.21
†Department of Materials Science and Metallurgy, University of
Cam-bridge, Cambridge CB3 0FS, United Kingdom.
‡International Center for Materials Nanoarchitectonics, National
Insti-tute for Materials Science, Ibaraki 305-0044, Japan.
§PSL Research University, Chimie ParisTech−CNRS, Institut de Recherche de Chimie Paris, 75005 Paris, France.
Figure 1. Abrupt increase in proton conductivity with relative humidity. (a)
Humidity dependence of proton conductivity data obtained by single crystal impedance measurements at 17°C. The arrows show the direction of humid-ity change from 0% up to 67%, and then down to 25%. The triangles indi-cate data below the detection limit (100 GΩ). The data were obtained along the c axis of the parent crystal. (b) Arrhenius plots of the temperature de-pendence of conductivity at RH = 61% (phase III). (c) Water adsorption– desorption isotherms at 25°C. The vertical axis shows the number of ad-sorbed water molecules per (dma)2[Li2Zr(ox)4] unit. (d) Powder diffraction
patterns collected under humidity control. The samples were sealed in glass capillaries in dry air (RH = 0%, as-synthesized phase I) and in humidified nitrogen at RH = 53% (phase II), 62% (phase III), 0% after holding at 62% (phase II).
By measuring the temperature-dependent conductivities in the range of 20–36°C at a constant humidity of RH = 61% (Fig. S2), we obtained the Arrhenius plots (Fig. 1b). The activation energy Ea for the conduc-tion is 0.64 eV and the pre-exponential factor σ0 is 3.8 × 10⁸ S cm–1 K.
The activation energy is similar to anhydrous inorganic crystals (e.g., KH2PO4, 0.60 eV)10, 22 and a layered MOF hydrate ((NH4)2(adp)[Zn2(ox)3]·3H2O (adp = adipic acid), 0.63 eV)23, and slightly larger than a layered inorganic hydrate ([HUO2PO4]·4H2O,
0.38 eV).10, 22 This high activation energy (cf. aqueous solution, <0.1 eV; gels and polymer electrolytes, <0.3 eV),10 as well as the small humidity dependence in the RH in the range 67–33%, suggests that protons do not transport through free water molecules adsorbed on the surface but through the framework and/or micropores.10 Since the conductivity depends on humidity, the mobile ions are judged to be protons, not other ions such as Li+.
In order to understand the role of humidity,24-26 water vapor adsorp-tion–desorption isotherms (Fig. 1c and Fig. S3) were measured at 25°C. The adsorption isotherm of the 1st cycle shows two-step adsorption: The 1st-step (P/P
0 = 0.3, number of H2O molecules per (dma)2[Li2Zr(ox)4],
n = 0.72) is associated with a structural transformation from I to another
crystalline phase, II, as shown in the powder X-ray diffraction (PXRD) patterns of the samples sealed under humidity control (Fig. 1d); The 2nd -step (P/P0 = 0.58, n = 4.0) is associated with a further transformation to
another crystalline phase, III, as shown in Fig. 1d, and accounts for the abrupt increase of proton conductivity. The desorption isotherm shows that this 2nd-step adsorption is reversible with hysteresis, and the humidi-ty jump from P/P0 = 0.40 to 0.51 can be ascribed to the rapid release of water vapor from the material. On the other hand, the transition from I to II is irreversible (n = 0.62 at P/P0 = 7.2 × 10⁻³). In the 2nd-cycle ad-sorption measurements (where n was re-defined to be 0 at P/P0 < 4.2 × 10⁻⁴), the material gradually adsorbed water to P/P
0 = 0.2 (n = 0.55), and then shows the same uptake around P/P0 = 0.58 (n = 4.0) when II trans-forms back to III. The abrupt transformation might be accounted for by a gate effect occurring in II,27 whereby the most flexible molecules (i.e., dma cations) are considered to open channels for water diffusion to-wards the center. Alternatively, such abrupt adsorption–desorption isotherms with hysteresis are typical for crystalline hydrates where hy-drophilicity is different at different hydration levels.28
Single crystals of the parent, insulating phase I, were synthesized by solvothermal reaction between lithium nitrate, zirconium butoxide, and oxalic acid in dimethylformamide. The crystals are colourless prisms, adopting the monoclinic I2/a space group [a = 16.1266(5), b = 16.6648(6), c = 15.4756(4), β = 91.161(3) at 302 K; Table S1]. I forms a three-dimensional anionic framework composed of tetrahedrally coordi-nated Li+ and dodecahedrally coordinated Zr4+ cations connected by oxalate anions, C2O42–: ox (Figure 2a–c). As is common in anionic MOFs,29 the negative framework charge (–2/Zr) is neutralized by the presence of an amine, in this case dma cations; (CH3)2NH2+ ions are located between ZrO8 polyhedra, and the square channels are filled with their methyl groups (Fig. 2c and S4). The overall composition of I is (dma)2[Li2Zr(ox)4]. The chemical compositions were determined by CHN elemental analysis at the Department of Chemistry, University of Cambridge (found, calcd. in %): C(26.05, 26.23), H(2.89, 2.91), N(4.98, 5.10). There is no porosity in I (solvent accessible volume, SAV = 0%). The structure of phase II was determined by single crystal diffraction and its composition is (dma)2[Li2(H2O)0.5Zr(ox)4]. II crystallizes in the triclinic space group P1 [a = 8.5302(6), b = 8.5902(6), c = 16.1582(12),
α = 89.309(6), β = 78.004(6) and γ = 68.812(6) at 299 K; Table S1].
The reaction of I to form II adds a single water molecule to one in four of the lithium cations (Fig. 2f and Fig. S5), increasing its coordination number from 4 to 5. For structure determination of II, we cut a small region from a single crystal of I that had been hydrated, thereby obtain-ing a sobtain-ingle crystalline domain; this is because the transformation of I to
II lead to the formation of twin domains. Like I, the structure of II is
dense (SAV = 3%, 36 Å3 for an isolated void in the unit cell, Fig. S6),30 but the water vapor isotherms indicate that these isolated voids are mostly accessible and can be filled with water molecules due to the flexible framework and/or with the motion of dma molecules.31 The composition of II calculated from the crystallographic data corresponds to the CHN elemental analyses (found, calcd. in %: C(25.66, 25.81), H(3.19, 3.04), N(5.06, 5.02)), which also confirms that the phase trans-formation does not change the N/C ratio, so there is no replacement of dma by water. The amount of coordinated water was confirmed by thermogravimetric analysis (Fig. S7), which shows an endothermic loss at around 100°C (obs. 1.5 wt%, calc. 1.6 wt%).
Figure 2. Topotactic hydration of phase I (a-d) to form phase II (e-h). (a, e)
The square one-dimensional channels are retained during the hydration reaction. The channels are filled with dimethylammonium cations, but they are omitted for clarity (both are dense structures). (b, f) The topotactic conversion can be interpreted by rotation of Zr polyhedra (ZrA and ZrC,
black arrows), which is triggered by hydration of LiB and its movement into
the gap between LiC and LiD. In phase II, the hydrated Li, LiB, is highlighted
in red. LiA has long coordination with OD (2.32 Å) and negligibly weak
coordination with OB (2.50 Å). OA and OC are non-coordinating oxygen
atoms. (c, g) Side-view of the channels. Dimethylammonium cations lie between two Zr polyhedra along the c axis in I, and along the b axis in II. Hydrogen atoms on methyl groups are omitted for clarity. (d, h) Crystallo-graphic orientation relationships. Unit cells (yellow) and cuboids formed by Zr polyhedral chains (black dotted line).
The transformation of I to II can be understood by careful comparison of their crystal structures. Both structures have square, one-dimensional channels formed by [Zr(ox)4]4– anions which are connected by the Li+ cations (Fig. 2a and 2e). The channels are filled by dma cations and no significant micropores exist, as discussed above. The structure of I adopts an I0O3 network according to the nomenclature of Cheetham et
al.;32 there is no extended inorganic connectivity. However, on hydration, LiB moves laterally and binds the water molecule (Fig. 2b) to form an inorganic chain of edge-sharing LiO5 units (Fig. 2f and 2g), and thus, the connectivity of II becomes I1O2. At the same time, half of the [Zr(ox)
4]4– anions, ZrA and ZrC (Fig. 2b), rotate such that the structure retains the square channels. The arrangements of Zr4+ cations can be regarded as constant during this transformation, and the unit cell relationships are illustrated in Fig. 2d and 2h. The crystallographic relationship between the parent crystal and the hydrated phase is retained, as expected for a topotactic reaction. Topotactic reactions are known to be useful for synthesizing new materials that cannot be accessed by other methods, 33-36 and this is a new example in a dense MOF.37
The direct structural transformation via a topotactic route is also supported by PXRD data (Fig. S8), which shows that the Bragg peaks of
I decrease with the increase in peaks of II. The lattice parameters of both
phases are constant during the hydration (Fig. S9 and Table S2), indicat-ing that this transition is first-order and abrupt rather than continuous. The formation energy from I with water vapor to II is calculated to be in the range of chemisorption (–108 kJ mol–1) by density functional theory (DFT) calculations;38, 39 in other words, the transformation is energeti-cally strongly favorable. The irreversible transformation to II is reasona-ble because the dehydration of II with retention of its framework struc-ture requires only 113 kJ mol–1, which is only by 5 kJ mol–1 larger than the formation energy of I from II (Table S3 and CIF files).
Because III is formed from twin domains that are present in II and sensitive to humidity, we have been unable to determine its crystal struc-ture. However, since the transformation between II and III is reversible, we can assume that the connectivity is mostly retained. In light of this, we used pair distribution functions (PDFs) in order to analyze the local and middle-range order of III.
Figure 3. Pair distribution function analysis of phases I, II and III. (a)
Comparison of X-ray pair distribution functions of the samples sealed at RH = 0% (I), at 53% (II) and (III). The data were plotted with offsets for clarity. The peaks around 0.9 Å (*) are attributable mainly to termination errors caused by the Fourier transformation (Qmax = 17.1 Å–1). (b) Difference of
PDFs between II (53%) and III (62%).
The PDFs (Fig. 3) were obtained by analyzing the X-ray total scatter-ing patterns of the samples sealed in glass capillaries under humidity control (Fig. S10). Regarding I and II, the PDFs were simulated from their crystal structures (Fig. S11), and the peaks assigned to atomic pairs as shown in Fig. 3a. The peaks in the range of 2–4.5 Å represent the Zr(ox)4 coordination units and are consistent in all three phases.
The PDFs of I and II are different in the longer distance regions, reflecting their different crystal structures. On examining the PDF of III, it is clearly very similar to that of II in the range 2-6.5 Å (Fig. 3b), indicating that the structure around the zirconium/oxalate
unit is preserved. At longer distances, however, we can see the loss of large peaks (e.g., Zr-Zr pairs at 8.49 Å) which suggests that the long range order is not as good in III. In order to accommodate 4 water molecules per Zr ions in III, the framework must expand without changing the overall connectivity and the water molecules (which are probably extra-framework rather than coordinated) are placed in the expanded channel structure. This interpretation is consistent with our observation that the transformation between II and III is reversible.
Regarding the proton source, the DFT calculations using the structure of II show that the proton transport from the dma cations to the oxygen atoms requires significant energy; for example, transfer to the water molecules needs 220 kJ mol–1, which rules out proton conduction involv-ing the dma cations. Charge distribution analyses of II (Fig. S12-14) reveals that the coordinating water molecules contribute to the screening of cationic charge of LiB (Fig. 2f) by 28% (Fig. S14), which in turn indi-cates partial deprotonation of the water molecules, namely, the water molecules coordinated to Li ions are considered to be the proton source. Though the coordinated water molecules hydrogen bond with oxalate molecules (Fig. S15), II is not conductive, meaning that the protons do not transport through oxalate ions (e.g., intramolecular proton transport)40 as shown in Fig. S16 and need additional water molecules as carriers.
The humidity-induced insulator-to-proton-conductor transition is a rare phenomenon. The layered system, hydrogen uranyl phosphate, and related materials show a gradual insulator-to-proton-conductor transi-tion by hydrate formatransi-tion.22, 24 The gradual feature is probably due to the amorphous structure of the anhydrous phase. MOFs, however, provide new opportunities,4 though the tendency of many MOFs to be unstable in the presence of moisture may lead us to expect them to be unlikely candidates for such behaviour. However, a layered MOF, (NH4)2(adp)[Zn2(ox)3]·nH2O (n = 0, 2 and 3), shows an abrupt insula-tor-to-proton conductor transition with water uptake (n = 0 to 2) and a conductor-to-superprotonic conductor transition around 100%RH.26 Our material is three dimensional and exhibits an abrupt transition at the middle RH range of 58%, probably because of the dense crystalline nature of the insulating phase, II, and its transition to another crystalline structure of the hydrate phase, III. The abrupt change of conductivity is reversible, suggesting potential applications of such materials in sensors in response to humidity changes.
Supporting Information
Experimental details, impedance data, crystal structure data, dynamic vapor sorption, X-ray total scattering data, TGA data, PXRD analysis, single crystal micro-FTIR, quantum chemistry calculations, detailed analysis on the crystal structures. This material is available free of charge via the Internet at http://pubs.acs.org.
Acknowledgements
This work was supported by Advanced Investigator Award from the European Research Council (ERC) and the World Premier Internation-al Research Center Initiative on “MateriInternation-als Nanoarchitectonics (WPI-MANA)” from MEXT, Japan. F.-X. C. acknowledges the access of HPC resources from GENCI-IDRIS (grant i2014087069). We thank Mi-cromeritics Japan for the help in the water vapor isotherm measurements, and Surface Measurement Systems and Nippon Science Core for the help in the dynamic water vapor sorption measurements.
References
(1) Eddaoudi M.; Kim, J.; Rosi, N.; Vodak, D.; Wachter, J.; OÕKeeffe, M.; Yaghi, O. M., Science 2002, 295, 469.
(2) Halder G. J.; Kepert, C. J.; Moubaraki, B.; Murray, K. S.; Cashion, J. D., Science 2002, 298, 1762.
(3) Serre C.; Millange, F.; Thouvenot, C.; Nogues, M.; Marsolier, G.; Louer, D.; Férey, G., J. Am. Chem. Soc. 2002, 124, 13519.
(4) Cheetham A. K.; Rao, C. N. R., Science 2007, 318, 58.
(5) Spencer E. C.; Kiran, M. S. R. N.; Li, W.; Ramamurty, U.; Ross, N. L.; Cheetham, A. K., Angew. Chem. Int. Ed. 2014, 53, 5683.
(6) Park M. J.; Nedoma, A. J.; Geissler, P. L.; Balsara, N. P.; Jackson, A.; Cookson, D., Macromolecules 2008, 41, 2271.
(7) Zhang H.; Li, L.; Moller, M.; Zhu, X. M.; Rueda, J. J. H.; Rosenthal, M.; Ivanov, D. A., Adv. Mater. 2013, 25, 3543.
(8) Xu W. Q.; Tosca, N. J.; McLennan, S. M.; Parise, J. B., Amer.
Miner-al. 2009, 94, 1629.
(9) Kepert C. J.; Hesek, D.; Beer, P. D.; Rosseinsky, M. J., Angew. Chem.
Int. Ed. 1998, 37, 3158.
(10) Tominaka S.; Cheetham, A. K., RSC Adv. 2014, 4, 54382.
(11) Tominaka S.; Henke, S.; Cheetham, A. K., CrystEngComm 2013, 15, 9400.
(12) Proton conductors: Solids, membranes and gels (materials and
devic-es). Cambridge University Press: Cambridge, 1992.
(13) Hurd J. A.; Vaidhyanathan, R.; Thangadurai, V.; Ratcliffe, C. I.; Moudrakovski, I. L.; Shimizu, G. K. H., Nat. Chem. 2009, 1, 705. (14) Yoon M.; Suh, K.; Natarajan, S.; Kim, K., Angew. Chem. Int. Ed.
2013, 52, 2688.
(15) Umeyama D.; Horike, S.; Inukai, M.; Itakura, T.; Kitagawa, S., J. Am.
Chem. Soc. 2012, 134, 12780.
(16) Yamada T.; Sadakiyo, M.; Kitagawa, H., J. Am. Chem. Soc. 2009,
131, 3144.
(17) Ramaswamy P.; Wong, N. E.; Shimizu, G. K. H., Chem. Soc. Rev.
2014, 43, 5913.
(18) Bureekaew S.; Horike, S.; Higuchi, M.; Mizuno, M.; Kawamura, T.; Tanaka, D.; Yanai, N.; Kitagawa, S., Nat. Mater. 2009, 8, 831.
(19) Fuma Y.; Ebihara, M.; Kutsumizu, S.; Kawamura, T., J. Am. Chem.
Soc. 2004, 126, 12238.
(20) Iguchi H.; Takaishi, S.; Miyasaka, H.; Yamashita, M.; Matsuzaki, H.; Okamoto, H.; Tanaka, H.; Kuroda, S., Angew. Chem. Int. Ed. 2010, 49, 552.
(21) Niel V.; Thompson, A. L.; Munoz, M. C.; Galet, A.; Goeta, A. S. E.; Real, J. A., Angew. Chem. Int. Ed. 2003, 42, 3760.
(22) Colomban P.; Novak, A., In Proton conductors: Solids, membranes
and gels (materials and devices), Colomban, P., Ed. Cambridge University
Press: Cambridge, 1992; pp 38-60.
(23) Sadakiyo M.; Yamada, T.; Kitagawa, H., J. Am. Chem. Soc. 2009,
131, 9906.
(24) Barboux P.; Morineau, R.; Livage, J., Solid State Ionics 1988, 27, 221. (25) Okawa H.; Sadakiyo, M.; Yamada, T.; Maesato, M.; Ohba, M.; Kita-gawa, H., J. Am. Chem. Soc. 2013, 135, 2256.
(26) Sadakiyo M.; Yamada, T.; Honda, K.; Matsui, H.; Kitagawa, H., J.
Am. Chem. Soc. 2014, 136, 7701.
(27) Onishi S.; Ohmori, T.; Ohkubo, T.; Noguchi, H.; Di, L.; Hanzawa, Y.; Kanoh, H.; Kaneko, K., Appl. Surf. Sci. 2002, 196, 81.
(28) Giron D.; Goldbronn, C.; Mutz, M.; Pfeffer, S.; Piechon, P.; Schwab, P., J. Therm. Anal. Calorim. 2002, 68, 453.
(29) Panda T.; Kundu, T.; Banerjee, R., Chem. Commun. 2013, 49, 6197. (30) Spek A. L., Acta Cryst. Sec. D 2009, 65, 148.
(31) Cussen E. J.; Claridge, J. B.; Rosseinsky, M. J.; Kepert, C. J., J. Am.
Chem. Soc. 2002, 124, 9574.
(32) Cheetham A. K.; Rao, C. N. R.; Feller, R. K., Chem. Commun. 2006, 4780.
(33) Hayward M. A.; Cussen, E. J.; Claridge, J. B.; Bieringer, M.; Rosse-insky, M. J.; Kiely, C. J.; Blundell, S. J.; Marshall, I. M.; Pratt, F. L.,
Science 2002, 295, 1882.
(34) Tsujimoto Y.; Tassel, C.; Hayashi, N.; Watanabe, T.; Kageyama, H.; Yoshimura, K.; Takano, M.; Ceretti, M.; Ritter, C.; Paulus, W., Nature
2007, 450, 1062.
(35) Tominaka S.; Yoshikawa, H.; Matsushita, Y.; Cheetham, A. K.,
Mater. Horiz. 2014, 1, 106.
(36) Tominaka S., Inorg. Chem. 2012, 51, 10136.
(37) Kole G. K.; Vittal, J. J., Chem. Soc. Rev. 2013, 42, 1755.
(38) Cliffe M. J.; Wan, W.; Zou, X. D.; Chater, P. A.; Kleppe, A. K.; Tucker, M. G.; Wilhelm, H.; Funnell, N. P.; Coudert, F. X.; Goodwin, A. L., Nat. Commun. 2014, 5, 4176.
(39) Ortiz A. U.; Boutin, A.; Gagnon, K. J.; Clearfield, A.; Coudert, F. X.,
J. Am. Chem. Soc. 2014, 136, 11540.