Multi-scale Assessment of Environmental Changes Impact on
Subarctic Glacierized Watersheds Hydrology
by
Anna CHESNOKOVA
MANUSCRIPT-BASED THESIS PRESENTED TO ÉCOLE DE
TECHNOLOGIE SUPÉRIEURE IN PARTIAL FULFILLMENT OF THE
DEGREE OF DOCTOR OF PHILOSOPHY Ph.D.
MONTREAL, MAY 1, 2020
ÉCOLE DE TECHNOLOGIE SUPÉRIEURE UNIVERSITÉ DU QUÉBEC
This Creative Commons licence allows readers to download this work and share it with others as long as the author is credited. The content of this work can’t be modified in any way or used commercially.
BOARD OF EXAMINERS
THIS THESIS HAS BEEN EVALUATED BY THE FOLLOWING BOARD OF EXAMINERS
Mr. Michel Baraër, Thesis Supervisor
Construction Engineering Department, École de technologie supérieure
Mr. François Morency, President of the Board of Examiners
Mechanical Engineering Department, École de technologie supérieure
Mr. Mathias Glaus, Member of the jury
Construction Engineering Department, École de technologie supérieure
Mr. Jeffrey McKenzie, External Evaluator
Department of Earth and Planetary Sciences at McGill University Mr. James King, Independent External Evaluator
Department of Geography at University of Montreal
THIS THESIS WAS PRENSENTED AND DEFENDED
IN THE PRESENCE OF A BOARD OF EXAMINERS AND PUBLIC ON APRIL 22
ACKNOWLEDGMENT
I would like to express my sincere gratitude to Professor Dr. Michel Baraër for supervising my thesis. His kindness, professional competence, readiness and availability for discussion, encouragement and incredible patience made this work possible. I would like to thank my PhD committee members Professor Dr. François Morency, Professor Dr. Mathias Glaus, Professor Dr. Jeffrey McKenzie and Professor Dr. James King for generously offering their time and good will throughout the preparation and review of this document.
A special thank you goes to Emilie who is an amazing friend and who made the fieldwork much easier and enjoyable! I am grateful to Richard Prowt, Sebastien Menard and Michael Dubois for enormous help with all the stages of fieldwork preparation and organization. I would like to thank Lance Goodwin, Sian Williams, Henry Penn and Carmen Wong for their support and help in Yukon, and I would like to extend my gratitude to all staff members of Kluane Lake Research Station and Parks Canada.
I would also like to express my gratitude to my friend, and master thesis supervisor, Dr. Francesca Pellicciotti for providing so many opportunities for me to learn more about hydrology and glaciology, for showing good sides of academia, for telling me that I can do it, and for countless cups of tea and conversations during the process.
I am grateful to HC3 and LAHMAS labs for all working and not working moments and discussions, in particular to Mariana, Kathy and Samaneh. I am very thankful to Tanja and Manu for continuous support; to Aly, Steffen, and Stephanie for all our climbing moments together, for pushing me and making sure I am keeping sport-work balance in life; and to choir de l’Art Neuf for all our music together and their incredible energy, support and optimism.
I am grateful to my family for their love, support, and encouragement, especially Olga, Natalya, Sereja, Aleksandr, and Thomas: I would have never managed it without all of you!
VI
Finally, I am grateful to this project for Pierrick. And I am thankful to Pierrick for being there for me, for his encouragement and patience, for all our moments together, for continuous support and for being a fantastic companion!
Funding: This study was funded by the Natural Science and Engineering Research Council
(NSERC) of Canada, the Geochemistry and Geodynamics Research Centre (GEOTOP) of Quebec, École de technologie supèrieure, a constituent of the Université de Quebec network, and Polar Continental Shelf Program.
Évaluation de l’impact des changements environnementaux sur l’hydrologie des bassins versant glacieres subarctiques à plusieures échelles
Anna CHESNOKOVA
RÉSUMÉ
Les bassins versants glaciaires subarctiques sont des systèmes hydrologiques complexes d’une importance primordiale non seulement pour la gestion des ressources en eaux, mais aussi pour les différents services écosystémiques. Ce sont des environnements fragiles qui montrent une grande sensibilité aux changements climatiques. Plusieurs études ont démontré l’importance hydrologique des secteurs n’étant pas couverts par un glacier en évaluant la capacité de stockage en eau et le ruissellement créés par les zones proglaciaires de ces bassins versants. Cependant, à l’échelle d’un bassin versant, le rôle hydrologique qu’exerce chaque composante autre que les glaciers n’est pas bien compris. J’émets ici l’hypothèse que les zones proglaciaires des environnements subarctiques jouent un rôle important pour l’hydrologie des bassins glaciaires et que le retrait des glaciers ne définit pas entièrement leur réponse hydrologique aux changements climatiques. Par conséquent, pour prédire avec précision les conséquences des changements environnementaux dans les bassins versants glaciaires subarctiques, il est nécessaire de mieux comprendre et quantifier la contribution de chaque composante hydrologique pour la production d’eau de surface.
L’objectif principal de ce projet est d’améliorer les connaissances nécessaires pour prévoir l’impact des changements environnementaux sur l’hydrologie des régions subarctiques en (i) isolant et quantifiant le rôle de la régression des glaciers sur les récents changements hydrologiques dans le sud-ouest du Yukon ainsi qu’en estimant les variations futures, en (ii) déterminant l’importance de plusieurs composantes hydrologiques sur le ruissellement dans un bassin versant glaciaire subarctique lors de la période estivale, et en (iii) analysant la genèse des aufeis pour obtenir de nouvelles informations sur la création du débit de base et sur les processus hydrologiques lors de la période hivernale dans deux bassins versants aux caractéristiques différentes. Afin d’atteindre ces objectifs, trois campagnes de terrains dans un bassin versant glaciaire des montagnes St Elias au Yukon (Canada) ont eu lieu lors de trois étés consécutifs. Les données récoltées ont été complémentées par des tests en laboratoires, des analyses statistiques et des données de télédétection. À cause de la forte complexité hydrologique généralement rencontrée dans ce type d’environnement, une approche multi-technique a été favorisée pour mesurer les processus hydrologiques des vallées proglaciaires. Celle-ci inclut l’utilisation de traceurs naturels, la prise de données hydrométéorologiques et l’imagerie à intervalle de temps.
Ce projet confirme que le retrait des glaciers ne peut expliquer à lui seul tous les changements hydrologiques ayant lieu dans la région d’étude. Tandis qu’une augmentation des débits annuels et estivaux, une diminution de la variabilité annuelle des débits et un décalage du début de la saison d’ablation sont tous des caractéristiques des bassins versants dont l’hydrologie est dominée par les glaciers, une augmentation du débit hivernale et une variation de sa durée sont observées dans tous les bassins versants, indépendamment de leur régime hydrologique. Ce
VIII
projet illustre aussi le rôle hydrologique d’une zone proglaciaire subarctique dans la partie amont d’un bassin versant. En particulier, les découvertes de ce projet démontrent que les composantes hydrologiques que sont les affluents des talus et le ruissellement des zones contenant de la glace enfouie contribuent significativement à la production d’eau de surface. Les sources contribuant au ruissellement lors de l’été semblent aussi être actives lors de l’hiver, soulignant du même coup l’importance des vallées proglaciaires pour l’hydrologie locale au cours de ces deux saisons.
Pour comprendre les changements hydrologiques ayant lieu dans les environnements montagneux subarctiques, les résultats de ce projet proposent qu’il faille mettre davantage l’accent sur le développement de nos connaissances des zones en amont des bassins versants glaciaires sans toutefois focaliser uniquement sur la contribution des glaciers. Les prochaines recherches devraient plutôt se faire à l’échelle d’un bassin versant et se concentrer sur l’identification des rôles de chaque composante et caractéristique hydrologiques telles que les aires contenant de la glace enfouie et les talus. Finalement, ce projet démontre la nécessité d’incorporer les composantes hydrologiques identifiées ici comme importantes dans les modèles hydrologiques conceptuels et numériques.
Mots-clés: subarctique; changements climatiques; bassins versants glaciaires; hydrologie
Multi-scale assessment of environmental changes impact on subarctic glacierized watersheds hydrology
Anna CHESNOKOVA
ABSTRACT
Subarctic glacierized catchments are complex hydrological systems of paramount importance not only for water resources management but also for various ecosystem services. They are environmentally fragile and exert a high sensitivity to changes in climatic forcing. Several studies indicated the hydrological importance of the non-glacierized portions of these watersheds by illustrating the potential water storage capacity and runoff production of their proglacial areas. However, on a watershed scale, the hydrological role of every single component other than glaciers is not yet well understood. I hypothesized that subarctic proglacial areas play an important role in the glacierized watersheds hydrology and that glacier retreat does not entirely define their hydrological response to climate change. Hence, to accurately project the response of subarctic glacierized catchments to environmental changes, it is necessary to better understand and quantify the contribution of each hydrological component in runoff production.
The primary objective of this project is thus to improve the knowledge necessary to project the impact of environmental changes on the hydrology of subarctic regions by (i) isolating and quantifying the role of shrinking glaciers in recent hydrological changes in the southwestern Yukon as well as estimating future hydrological changes in the region, (ii) disentangling the importance of various hydrological components to the total summer runoff in the headwaters of a subarctic glacierized watershed, and (iii) analyzing the genesis of icings to obtain new insights into the generation of winter baseflow and winter hydrological processes in the headwaters of subarctic glacierized watersheds of different complexity. To achieve these objectives, three summer field campaigns in a glacierized watershed of the St. Elias Mountains, Yukon, Canada, were conducted. The data collected were complemented with laboratory activities, statistical analyses, and remote sensing. Due to the high hydrological complexity met in such environments, a multi-technique approach based on the use of natural tracers, hydro-meteorological monitoring and time lapse imagery was applied in the field site to understand hydrological processes within the proglacial areas.
This project confirms that glacier retreat, even if shown to be of primary importance, cannot explain all the hydrological changes in the study region. Whereas increases in yearly and ablation season discharge, decreases in flow variability and changes in ablation season start are characteristics of watersheds with a dominant glacier runoff, increase in winter discharge magnitude and shifts in its timing were observed in all the watersheds independently on their hydrological regime. In the headwaters of a watershed which passed peak water, this project also illustrates the hydrological role of subarctic proglacial field on a watershed scale. In particular, the findings demonstrate that hydrological components such as talus slope tributaries and, possibly, runoff from areas with buried ice contribute significantly to runoff production. It was also found that the contributing sources of the ablation season seem to be
X
active in winter as well, hence highlighting the importance of the proglacial field for the hydrology of the headwaters during both seasons.
The results of this project propose that, to understand the hydrological changes taking place in subarctic mountainous environments, more attention should be given to the headwaters of glacierized watersheds without focusing only on glaciers’ contribution. Instead, future research should focus on identifying the role of specific hydrological features and components, such as areas with buried ice and talus slopes, on a watershed scale. Finally, it demonstrates the importance of working towards incorporating the important hydrological components identified in this study in conceptual and numerical hydrological models.
TABLE OF CONTENTS
Page
INTRODUCTION ...1
CHAPTER 1 HYDROLOGY OF GLACIERIZED SUBARCTIC WATERSHEDS ...6
1.1 Glacier hydrology ...7
1.2 Glacier response to climate change ...10
1.3 Proglacial field hydrology ...12
1.4 Proglacial field evolution under changing climate ...15
1.5 Subarctic alpine meadow hydrology ...17
1.6 Subarctic alpine meadow evolution under changing climate ...19
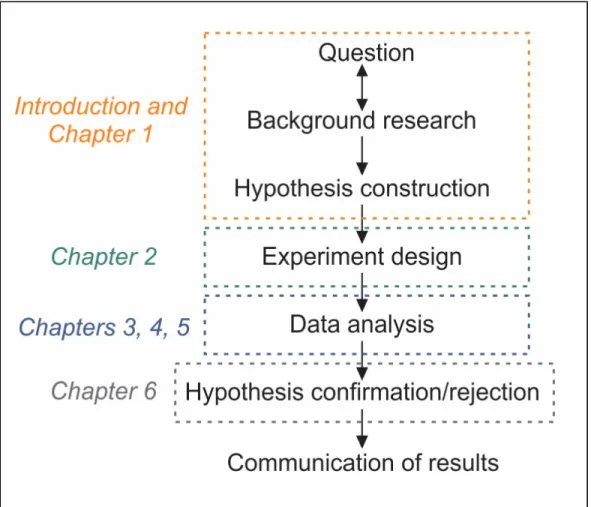
CHAPTER 2 CONCEPTUAL METHODOLOGY AND THESIS ORGANIZATION .22 2.1 Experiment design and data acquisition ...23
2.2 Data analysis and hypothesis confirmation ...27
CHAPTER 3 LINKING MOUNTAIN GLACIER RETREAT AND HYDROLOGICAL CHANGES IN SOUTHWESTERNYUKON ...31
3.1 Introduction ...32
3.2 Study area...38
3.3 Data and methods ...40
3.3.1 Overview of methods ... 40
3.3.2 Observations and preprocessing ... 41
3.3.2.1 River discharge data ... 41
3.3.2.2 Air temperature and precipitation data ... 43
3.3.2.3 Glacier inventory ... 44
3.3.3 Hydrological regimes ... 46
3.3.4 Trend detection ... 47
3.3.5 Hydrological modeling ... 48
3.3.5.1 Model description ... 48
3.3.5.2 Model setup and verification ... 52
3.3.5.3 Model outputs ... 56
3.3.5.4 Peak water analysis ... 56
3.3.5.5 Additional simulations ... 57
3.4 Results ...58
3.4.1 Glacier inventory ... 58
3.4.2 Hydrological regimes ... 59
3.4.3 Trend detection ... 61
3.4.3.1 Trend detection in river discharge data ... 61
3.4.3.2 Trend detection in air temperature and precipitation ... 64
3.4.4 Hydrological modeling ... 65
3.4.4.1 Model parametrization and verification ... 65
XII
3.4.4.3 Additional simulation results ... 68
3.5 Discussion ...70
3.5.1 Current hydrological changes and trend attribution ... 70
3.5.2 Implications for regional water resources ... 73
3.5.3 Driver of glacier retreat influence on watershed discharge ... 74
3.5.4 Limitations of the method ... 75
3.6 Conclusions ...77
3.7 Acknowledgements ...77
CHAPTER 4 HOW SIGNIFICANT ARE WATER SOURCES OTHER THAN GLACIERS IN AN ARID HIGHLY GLACIERIZED SUBARCTIC WATERSHED? ...78
4.1 Introduction ...79
4.2 Methods...83
4.2.1 Method overview ... 83
4.2.2 Study site ... 83
4.2.3 Air temperature and precipitation measurement ... 86
4.2.4 Hydrochemical basin characterization method ... 86
4.2.4.1 Water sample collection ... 86
4.2.4.2 Stable water isotopes analysis and interpretation ... 88
4.2.4.3 Major ions analysis and interpretation ... 90
4.2.4.4 Identification of tracers to be used in HBCM ... 91
4.2.4.5 Quantifying end-member contribution to the watershed outflow ... 91
4.2.4.6 HBCM results verification ... 93
4.3 Results ...93
4.3.1 Meteorological and field conditions at sampling ... 93
4.3.2 Back calculations for individual tracers ... 96
4.3.3 Season 2017 results ... 97
4.3.3.1 Stable water isotopes analysis ... 97
4.3.3.2 Major ions analysis ... 101
4.3.3.3 Results of HBCM ... 103
4.3.4 Season 2016 results ... 105
4.3.4.1 Stable water isotopes analysis ... 105
4.3.4.2 Major ions analysis ... 108
4.3.4.3 Results of HBCM ... 109
4.3.5 Season 2015 results ... 111
4.3.5.1 Stable water isotopes analysis ... 111
4.3.5.2 Major ions analysis ... 112
4.3.5.3 Results of HBCM ... 114
4.4 Discussion ...115
4.4.1 Is there any significant contribution from sources other than glaciers in the study watershed? ... 115
4.4.2 Identified hydrological components and their contribution to watershed outflow ... 116
XIII
4.4.2.1 Glacier melt ... 116
4.4.2.2 Areas with buried ice ... 116
4.4.2.3 Hillslope tributaries ... 117
4.4.2.4 Alpine meadow groundwater ... 118
4.4.3 Variation of runoff components contribution under different meteorological conditions ... 119
4.4.4 Method limitations ... 119
4.5 Conclusions ...121
4.6 Acknowledgments...122
CHAPTER 5 PROGLACIAL ICINGS AS RECORDS OF WINTER HYDROLOGICAL PROCESSES ...123
5.1 Introduction ...124
5.2 Methods...127
5.2.1 Study site ... 127
5.2.2 Analysis of time lapse images ... 130
5.2.3 Sample collection ... 133
5.2.4 Analysis of isotopes ... 136
5.2.5 Analysis of selected ions ... 137
5.2.6 Analysis of dissolved organic carbon ... 138
5.2.7 Analysis of solid samples... 138
5.3 Results of the watershed B ...139
5.3.1 Time lapse images analysis ... 139
5.3.2 Analysis of stable water isotopes and ionic signatures ... 140
5.3.3 Distribution of relative ionic concentrations... 144
5.3.4 Analysis of solid samples... 145
5.4 Results for the Duke watershed ...146
5.4.1 Time lapse images analysis ... 146
5.4.2 Analysis of stable water isotopes and ionic signature ... 149
5.4.3 Distribution of relative ionic concentrations... 152
5.4.4 Dissolved organic carbon ... 153
5.4.5 Analysis of cryogenic precipitate ... 153
5.5 Discussion ...154
5.5.1 Summary of water sources detected for each icing ... 154
5.5.2 Is glacier runoff the most important water contributor to icing formation and winter baseflow? ... 157
5.5.3 Role of suprapermafrost layer water in icing formation and winter baseflow ... 158
5.5.4 Are there other hydrological sources that contribute substantially to icing formation and winter baseflow? ... 159
5.5.5 Limitation of the method ... 160
5.6 Conclusions ...161
5.7 Acknowledgements ...162
XIV
6.1 What is the role of shrinking glaciers in recent hydrological changes in the
southwestern Yukon and what are future hydrological changes in the region? ...163
6.2 Which hydrological components play an important role in summer runoff production in the headwaters of a subarctic watershed? ...165
6.3 Which hydrological components are responsible for the generation of winter baseflow in the headwaters of two subarctic watersheds of different complexity? ...167
6.4 Project implications ...169
6.4.1 Theoretical implications ... 179
6.4.2 Practical implications ... 170
6.5 Project limitation and ways forward ...171
CONCLUSIONS...173
LIST OF TABLES
Page
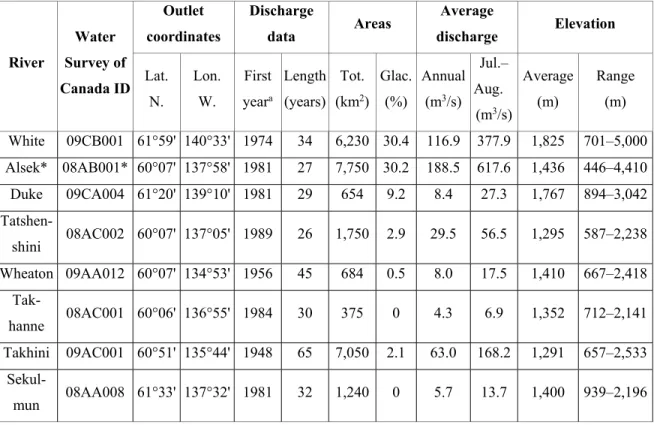
Table 3.1 Description of studied watersheds ...39 Table 3.2 Regional- (a) and watershed-specific (b) parameters ...51 Table 3.3 Parameter adjustments leading to the 15 tested scenarios: (a) 5 adjustments of
the base glacier cover values used to compute Γ0 and Γfollow, where e(s)
represents the standard error computed based on measured glacier areas and “-” stands for no changes; (b) 3 alternatives of the glacierized area–volume scaling factor. Combining the 5 sets of Γ0 and Γfollow values with the 3 possible
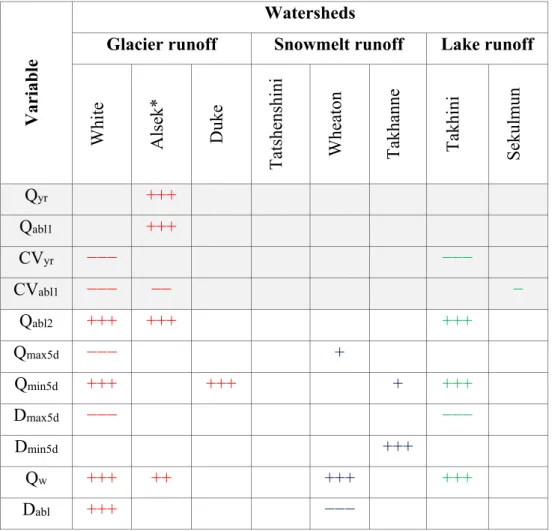
scaling factors leads to 15 scenarios ...55 Table 3.4 Results of trend detection in discharge variables (see Section 3.3.2.1). The “+”
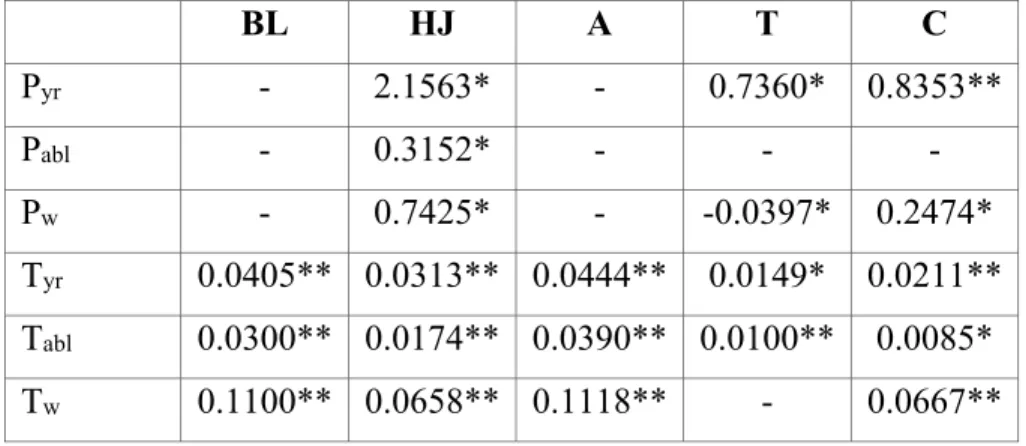
sign indicates a positive trend, while the “−” sign indicates a negative one. Three signs represent the cases where all tests show statistically significant (α = 0.05) results. Two signs, both the MK and modified MK tests, show significant results. One sign, only the modified MK test, shows significant results. Different colors correspond to different hydrological regimes, namely, watersheds with glacier runoff (red), those with snowmelt runoff (blue), and those with lake runoff (green). Shaded rows present peak water-related variables ...61 Table 3.5 Results of trend detection in meteorological time series. Pyr/abl/w represents the
mean annual, ablation season, and winter rate of precipitation change (mm/year), and Tyr/abl/w represents the mean annual, ablation season, and winter rate of temperature change (°c/year). Results are reported as Sen’s slope value, which is shown only if a statistical significance has been detected by SR and (**) /or (*) MK (significance level of 0.05) ...63 Table 3.6 Individual watershed parameters used in SWBM ...65 Table 4.1 Meteorological and field conditions for each sampling campaign ...97 Table 4.2 Relative contribution (in %) of sampled end-members to cell outflow and to
watershed outlet for the season 2017. For individual cells, the standard deviation of all equiprobable solution represents the error associated to contributions standard deviation (stdev, in %) ...105 Table 4.3 Relative contribution (in %) of sampled end-members to cell outflow and to
XVI
deviation of all equiprobable solution represents the error associated to contributions standard deviation (stdev, in %) ...111 Table 4.4 Relative contribution (in %) of sampled end-members to cell outflow and to
watershed outlet for the season 2015. For individual cells, the standard deviation of all equiprobable solution represents the error associated to contributions standard deviation (stdev, in %) ...115 Table 5.1 Summary of samples collected in (a) watershed B and (b) Duke watershed. PF
stands for proglacial field and AM stands for alpine meadow ...134 Table 5.2 Results of the analysis of solid samples performed by X-ray fluorescence
(Method 1) and acid digestion (Method 2) ...146 Table 5.3 Summary of sources identified as potential contributors to icings formation.
For each method (columns), the main potential sources identified for each icing are listed (rows). “+” indicates sources that are supported by the method, and “-” indicates sources that are not supported by the method. Potential sources supported by all applicable methods are highlighted in green; those supported by no method are highlighted in red. Grey cells indicate cases where particular method is not applicable ...156
LIST OF FIGURES
Page
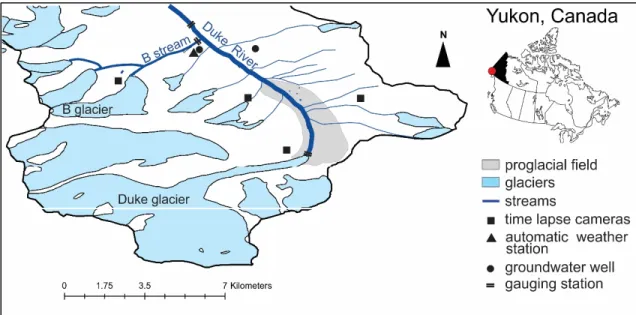
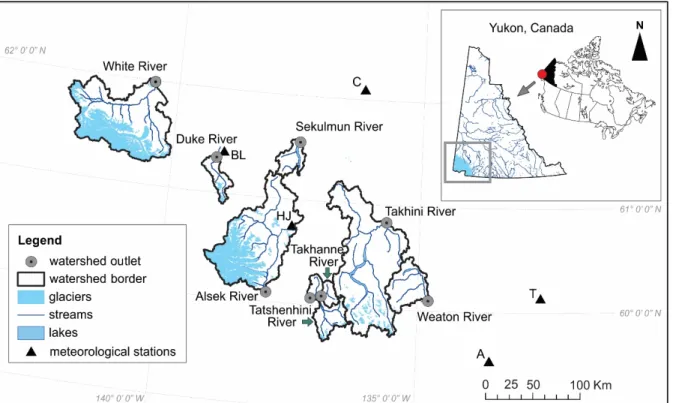
Figure 1.1 Hydrological system of a temperate glacier ...9 Figure 2.1 Scientific method application in the project and thesis organization ...25 Figure 2.2 Upper Duke River valley with location of main monitoring equipment ...26 Figure 3.1 Study area and the selected watersheds in the southwestern Yukon, Canada.
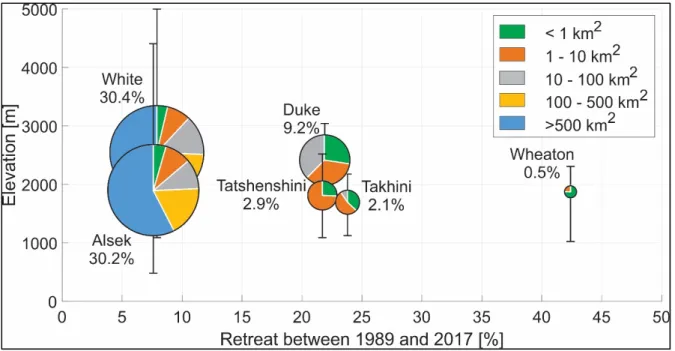
Gray circles with black points correspond to the outlets of the watersheds. Triangles highlight the position of the meteorological stations, corresponding to Burwash Landing (BL), Haines Junction (HJ), Altin (A), Carmacks (C), and Teslin (T) ...40 Figure 3.2 Changes in glacierized area in % for each watershed for the period 1989–2017.
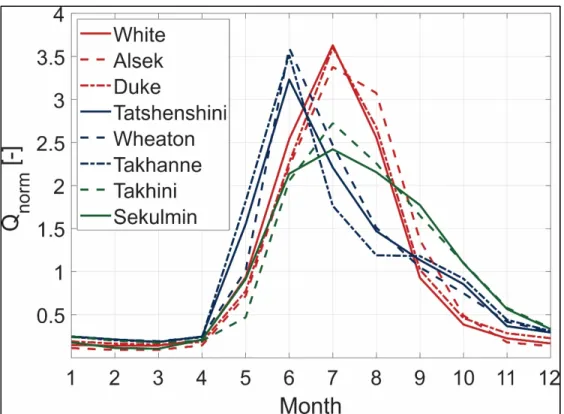
The size of each circle is proportional to the % of glacierized area of the watershed. The center of each circle corresponds to the mean elevation of glaciers, and the bars show their elevation range. The area of each circle is divided into segments that correspond to the % of glacierized area taken by glaciers of different sizes (see the legend) for 2017 ...58 Figure 3.3 Normalized monthly discharge (Qnorm) of the analyzed watersheds. Different
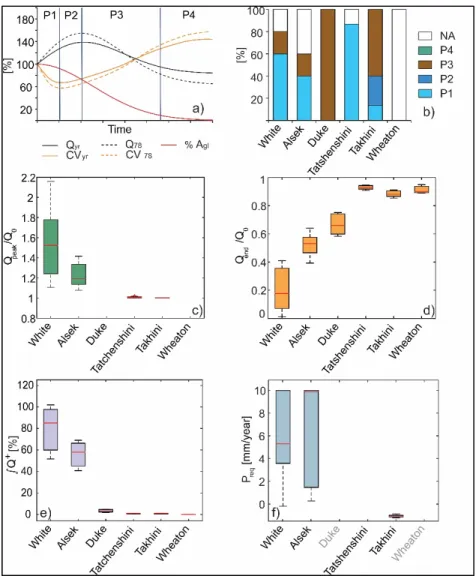
colors represent different hydrological regimes, namely, watersheds with glacier runoff (red), snowmelt runoff (blue), and lake runoff (green) ...60 Figure 3.4 Peak water modeling results for glacierized catchments: (a) delineation of
conceptual glacier retreat hydrological impact phases; discharge characteristics are normalized to their initial value; (b) PW phases (P1, P2, P3, or P4) corresponding to model outputs for the 15 scenarios considered for each watershed; “NA” is assigned to the scenarios with no glacier retreat acceleration between 1989 and 2017; (c) simulated ablation season discharge maximum value Qpeak divided by its initial value Q0 for all the scenarios
leading to P1 or P2 (pre-PW); (d) simulated final ablation season discharge
Qend divided by its initial value Q0 for all the scenarios; (e) glaciers’ capacity
to further increase the ablation season discharge ∫Q+; (f) precipitation increase
Preq required to reverse glacier retreat driven negative trends in the ablation
season discharge ...68 Figure 4.1 Bird view on the B watershed in June 2015. Top panel shows glaciers B1, B2
and B3 and drainage network of the upper part of the watershed. Bottom panel shows the lower part of the watershed. Approximate positions of 2017 season sampling points are marked for reference with circles color-coded depending
XVIII
on their genesis (see explanations in the section 4.2.4.1). Note that, in June 2015, glaciers showed abnormally limited snow cover for the beginning of the ablation season ...86 Figure 4.2 Hourly air temperature (T) and precipitation (P) during the ablation seasons
a) 2017, b) 2016 and c) 2015; red rectangles highlight sampling days positions; grey shaded rectangle represent period with missing data for T and P; blue shaded rectangles represent period with missing data for P ...96 Figure 4.3 Comparison between measured (Cmeasured) and back-calculated concentrations
(Ccalculated) of Mg2+ for all mixing points for three sampling seasons. Black solid line presents fitted linear regression and red dashed lines mark its 95% confidence intervals; along grey dashed line Cmeasured equals Ccalculated; ...98 Figure 4.4 Results from the 2017 season: a) results of the stable water isotopes analysis
where Global Meteoric Water Line is shown with dashed line; b) Principal Components Analysis diagram showing the results of analysis of major ions; c) HBCM representation of the B watershed where HBCM cells are shown with dashed lines; and d) results of HBCM where each pie chart presents cumulative relative contribution of end-members for each mixing point (blue circles) ...101 Figure 4.5 Results from the 2016 season: a) results of the stable water isotopes analysis
where Global Meteoric Water Line is shown with dashed line; b) Principal Components Analysis diagram showing the results of analysis of major ions; c) HBCM representation of the B watershed where HBCM cells are shown with dashed lines and numbered; and d) results of HBCM where each pie chart presents cumulative relative contribution of end-members for each mixing point (blue circles) ...108 Figure 4.6 Results from the 2015 season: a) results of the stable water isotopes analysis
where Global Meteoric Water Line is shown with dashed line; b) Principal Components Analysis diagram showing the results of analysis of major ions; c) HBCM representation of the B watershed where HBCM cells are shown with dashed lines and numbered; and d) results of HBCM where each pie chart presents cumulative relative contribution of end-members for each mixing point (blue circles) ...114 Figure 5.1 Study watersheds and sampling plans. Panel (a) shows Upper Duke River
watershed and watershed B borders and the locations of time lapse cameras and the automatic weather station. Panels (b) and (c) present schematic maps of B and Duke watersheds, respectively, with relative locations of sampling points. Dashed lines show sources that are not directly connected above the surface with the main stream. In panel (c), for streams fed by small glaciers, “a” identifies samples taken close to the glacier tongue, and “b,” sample taken close to the confluence with the Duke River ...129
XIX
Figure 5.2 Glacier B tongue and hydrological activities visible in the TLC1 images. Panel (a) shows Glacier B’s tongue, proglacial field, proglacial icing and the right side of the valley at the camera installation. Panels (b) and c) illustrate flooding events on the left (b) and the right (c) side of the proglacial field; panels (d) and (e) show flooding occurring on the left bottom side of the proglacial field ...131 Figure 5.3 The Duke proglacial field visible in the TLC3 images. Panel (a) shows icings
3 (right side of the image) and 4 (left side of the image) at the camera installation; panel (b) shows an example of flooding originating from the Duke glacier; panels (c) and (d) show an example of the darkening/bluing of pixels as a results of flooding; panels (e) and (f) show an example of flooding being detectable from reflective (brightening) pixels ...132 Figure 5.4 Hydrological activities observed in watershed B by the use of time lapse
cameras for the 2015-2016 season (top panel) and the 2016-2017 season (bottom panel). Black solid lines show air temperature measured at the automatic weather station; half-circles mark the timing of hydrological activity on the left/right side of the proglacial field, and full circles represent the timing of hydrological activity related to either an ice-cored moraine or a moraine lake ...142 Figure 5.5 Results for the watershed B. Panels (a) and (c) show results from stable water
isotope analysis. The straight line represents the Local Meteoric Water Line. Panels (b) and (d) show results of hydrochemical analysis. Panels (a) and (b) show the locations of sources identified by TLC; panels (c) and (d) show other potential sources for Icing PF and Icing B formation. ...143 Figure 5.6 Conceptual maps of ionic content of water samples. Colored boxes delineate
sampled areas with targeted ion relative concentration above the threshold. The names of sampling points can be found in Figure 5.1 ...145 Figure 5.7 Hydrological activities observed in the Upper Duke watershed by the use of
time lapse cameras for the 2015-2016 season (top panel) and the 2016-2017 season (bottom panel). Black solid lines show air temperature measured at the automatic weather station. Circles represent the timing of hydrological activity related to different water sources. Circle color identifies a specific sources type. In cases where different sources were observed to be active, the circles has in multiple colors ...148 Figure 5.8 Results for the Duke watershed. Panels (a), (c), and (e) show results from
stable water isotope analysis. The straight line represents the Local Meteoric Water Line. Panels (b), (d), and (f) show results of hydrochemical analysis. Panels (a) and (b) show the locations of sources identified in TLC images; panels (c) and (d) show sources within the proglacial field; panels (e) and (f) show sources within the alpine meadow ...151
LIST OF ABREVIATIONS
A Altin
AM Alpine Meadow
AWS Automatic Weather Station
BL Burwash Landing
C Carmacks
DEM Digital Elevation Model DOC Dissolved Organic Carbon GMWL Global Meteoric Water Line
HBCM Hydrochemical Basin Characterization Method
HJ Haines Junction
ICP-OES Inductively Coupled Plasma Optical Emission Spectrometry IPCC The Intergovernmental Panel on Climate Change
IQR Interquartile Range
LMWL Local Meteoric Water Line
MK Mann-Kendall Test
PCA Principal Component Analysis
PF Proglacial Field
PW Peak Water
SR Spearman’s Rho Test SW Southwestern
XXII
SWBM Simple Water Balance Model T Teslin
TLC Time Lapse Camera
LIST OF SYMBOLS AND UNITS OF MEASUREMENTS % percent ‰ per mile °C degree Celsius h hour cm centimeter km kilometer m meter mL milliliter mm millimeter M moll µS micro Siemens
ppm part per million s second
INTRODUCTION
Under unprecedented climate change (IPCC, 2014; 2019), the cryosphere (frozen portion of Earth’s water) is the fastest part of climate system to respond (Xiao, Wang, & Qin, 2015). In mountainous regions, the components of the cryosphere such as glaciers, snow cover, and permafrost regulate flow and thus affect both water quantity and quality for ecosystems and the population situated downstream (Barnett, Adam, & Lettenmaier, 2005; Immerzeel et al., 2019; Huss et al., 2017; Viviroli, Dürr, Messerli, Meybeck, & Weingartner, 2007). In addition to supply and regulation functions, the cryosphere provides habitat and cultural services (Huss et al., 2017; Wang, Liu, & Zhang, 2019; Xiao, Wang, & Qin, 2015). Understanding and mimicking a cryospheric response to climate change is thus crucial for water resources management, as well as for various ecosystem services.
The greatest warming during the upcoming century is projected to happen over northern latitudes (Meehl et al., 2007; Larsen et al., 2014). In these regions, the subarctic glacierized watersheds are among the most complex hydrological systems because they possess hydrological features of both cold and temperate regions (Brown, Ferrians, Heginbottom, & Melnikov, 2002) and often preserve legacy hydrological features from antecedent climates and glaciations such as rock glaciers, ice-cored moraines and buried ice formations (e.g., Johnson, 1986). In a context of extreme vulnerability of subarctic populations and ecosystems to climate change (Hinzman et al., 2005; Jacobsen, Milner, Brown, & Dangles, 2012; Larsen et al., 2014), improving the knowledge necessary to accurately project the impact of environmental changes on the subarctic glacierized watersheds is of primary importance.
The estimated impact of climate changes on glacierized watershed hydrology is commonly modelled under the assumption that the evolution of glacier extent is the dominating factor that should be accounted for (Hood et al., 2006). In numerical models, glacier- and snowmelt are often the only considered cryospheric components affecting a watershed outflow (e.g., Gascoin et al., 2011; Huss, 2011; Kaser, Grosshauser, & Marzeion, 2010). In addition, the hydrological systems from portions of watersheds not covered by glaciers are represented by groundwater
2
routing (e.g., Farinotti, Usselmann, Huss, Bauder, & Funk, 2012; Koboltschnig, Schöner, Zappa, & Holzmann, 2007; Naz, Frans, Clarke, Burns, & Lettenmaier, 2014; Ragettli, Cortés, McPhee, & Pellicciotti, 2014; Pomeroy et al., 2007), where groundwater component is often modelled based on calibration (Hood et al., 2006). However, glaciers are only one of the climate-sensitive hydrological features of the subarctic glacierized catchments. At a watershed scale, this underrepresentation of the non-glacierized part of alpine watersheds potentially leads to biases in runoff predictions, as changes affecting other water sources are neglected. The risk of biased predictions is even more pronounced in Nordic environments, where numerous cryospheric components play an important role in the hydrological balance.
Cold-region-specific hydrological components, such as small scale slope processes in permafrost underlain terrains have been intensively studied in the subarctic (Carey & Quinton, 2004; Carey & Woo, 1998, 2001a, 2001b; Quinton & Marsh, 1999) and their hydrological role is now well identified (Woo, 2012). Regrettably, this is not the case for the hydrological role of proglacial fields including their groundwater systems, buried ice, ice-cored moraines and icings. The relative importance of the hydrological processes associated with such feature in glacierized watersheds has not yet been estimated (Vincent, Violette, & Aðalgeirsdóttir, 2019).
Several conceptual models, which describe proglacial field hydrology, exist for glacierized watersheds in the tropical Andes (e.g., Baraer et al., 2014; Gordon et al., 2015; Somers et al., 2016), temperate glacierized watersheds in the Alps (e. g., Kobierska, Jonas, Kirchner, & Bernasconi, 2014; Penna, Engel, Bertoldi, & Comiti, 2017; Ward, Malard, Tockner, & Uehlinger, 1999), in the Rockies (e.g., Langston, Bentley, Hayashi, Mcclymont, & Pidlisecky, 2011; McClymont et al., 2011; Muir, Hayashi, & Mcclymont, 2011), and in the Himalayas (e.g., Ma et al., 2017). Those studies often focused either on one or several hydrological features, or on watershed groundwater component. The only examples of attempts to establish subarctic conceptual models are found in Iceland (e.g., Dochartaigh et al., 2019; Levy, Robinson, Krause, Waller, & Weatherill, 2015). Thus, most of the existing conceptual models of glacierized watershed describe in detail only one or several hydrological components such
3
as rock glaciers, talus slopes, and moraines (e.g. Langston, Bentley, Hayashi, Mcclymont, & Pidlisecky, 2011; McClymont et al., 2011; Muir, Hayashi, & Mcclymont, 2011; Williams, Knauf, Caine, Liu, & Verplanck, 2006). Subarctic glacierized watershed hydrological processes, related to the presence of such features as ice-cored moraines and buried ice, are not represented in these conceptual models. These features, however, are known to have high storage capacity and complex groundwater distribution systems (Langston et al., 2011; McClymont et al., 2011; Roy & Hayashi, 2009) and thus are known to affect significantly watershed hydrology. In addition, groundwater systems within proglacial fields are highly interconnected with surface water systems, and respond fast to changes in glacier geometry and water supply (Kobierska et al., 2014; Levy et al., 2015; Magnusson et al., 2014; Ward et al., 1999). Climate change projections on the watershed scale are limited by process understanding in mountainous glacierized catchments (Mimeau et al., 2019; Salzmann, Huggel, Rohrer, & Stoffel, 2014). To accurately project the response of these systems to environmental changes it is necessary to better understand and quantify the role of hydrological components other than glacier meltwater in runoff production.
Based on this contextual background, I hypothesize that subarctic proglacial areas play an important role in the hydrology of glacierized valleys, and that glacier retreat is not the only driver of their hydrological response to climate change. The main objective of this project is thus to improve the knowledge necessary to project the impacts of environmental changes on the hydrology of subarctic regions, and to achieve it I specify several research questions:
1. What is the role of shrinking glaciers in recent (last 3-7 decades) hydrological changes in the southwestern Yukon and what are future hydrological changes in the region?
2. Which hydrological components play an important role in summer runoff production in headwater of a subarctic watershed?
3. Which hydrological components are responsible for generation of winter baseflow in the headwaters of subarctic watersheds of different complexity?
In order to answer these research questions, St. Elias Mountains, situated in the Canadian subarctic, were chosen as a study region. This area is a remote region of the southwestern
4
Yukon, which can be seen as a natural laboratory for understanding the impact of environmental changes on the subarctic glacierized watersheds, yet it has only been studied occasionally so far. The study region is situated on the southern edge of the subarctic area, which is especially sensitive to changes in climatic forcing (Nilsson, Polvi, & Lind, 2015). Among the world’s glacierized regions, this particular one has been the second after the Canadian Arctic in contribution to global sea level rise during the period 1961-2000 (Radić & Hock, 2010). The St. Elias Mountains are projected to lose 70±10% of glacier volume by the end of the century (Clarke, Jarosch, Anslow, Radić, & Menounos, 2015) which will lead to a substantial decrease in glacier melt contribution to runoff (Bliss, Hock, & Radić, 2014).
This project is based on 3 summer field campaigns in the glacierized watershed in the St. Elias Mountains, laboratory analysis, statistical analyses, and remote sensing techniques and products. A multi-technique approach is used to better understand the hydrological processes of the proglacial area. This choice is made due to the high hydrological complexity met in such environments. Among others, the high number of potential water sources, the limited length of the field campaigns, and the difficulties to equip the valley with long-lasting monitoring equipment have motivated this choice. Among the techniques used for the project, those based on natural tracers, hydro-meteorological monitoring and time lapse imagery are the most important.
Answering of the first research question provides new insights into hydrological changes in the southwestern Yukon and helps isolating and quantifying the role of glacier retreat in those changes. The role of glacier retreat in the region was previously estimated only qualitatively based on watersheds’ hydrological regimes (Fleming, 2004) or their current glacier cover (Fleming & Clarke, 2003). In the present project I use two approaches in parallel - one based on statistical hydro-climatology, and another based on hydro-glaciological numerical modelling. The results of this part of the project allow linking the hydrological response of different watersheds to glacier retreat parameters, positioning of watersheds in terms of peak water, and providing estimates of the magnitude of change in discharge during/after peak water. The repercussions of that work are global: mountain glaciers are the core of the world's
5
"water towers" like the Himalayas, Andes, Alps, and Northern Rockies (Immerzeel et al., 2019).
Answering the second and the third research question results in a more comprehensive description of the hydrological role of different components within subarctic proglacial fields during both summer and winter seasons. Moreover, it helps quantifying the importance of the proglacial field in watershed hydrology in a context of environmental changes. By better characterizing the hydrological systems specific to the proglacial field, the present research will help the development of a new generation of hydrological models, which in turn can provide more objective projections for water resources management.
In addition, selecting proglacial fields as key areas of investigation has potential to impact the scientific community. Proglacial fields exhibit high dynamics and vulnerability under current climatic conditions (Johnson, 1971, 1992; Schomacker, 2008). They are expanding as glaciers are retreating, and subsequently evolve due to the presence of climate-sensitive hydrological features. In their recent paper, Heckmann, Mccoll, and Morche (2016) highlight the increasing interest in proglacial areas and the lack of knowledge in this field. In many contexts, such as hydrology, sediment transport and extreme outbursts, proglacial field investigation is important. In the context of water resources in glacierized watersheds under changing climatic conditions, the proglacial field can play an important role in water storage (Langston et al., 2011; McClymont et al., 2011; Roy & Hayashi, 2009).
CHAPTER 1
HYDROLOGY OF GLACIERIZED SUBARCTIC WATERSHEDS
This chapter is dedicated to presenting hydrological systems of subarctic glacierized watershed, their related hydrological processes and their evolution under changing climate based on the recent and still relevant literature. In order to avoid overlaps with Chapters 3, 4 and 5, I here prioritize descriptions that allow the understanding of those systems in an integrated way and provide fewer details on what the aforementioned three chapters are focusing on, namely regional hydrological changes, the contribution from non-glacierized parts of highly glacierized catchments, and icing formations and winter specific hydrological processes.
Subarctic glacierized watersheds are complex systems due to unique co-habitat of temperate-climate-specific hydrological components with cold-region-specific ones, which results in phenomena such as discontinuous permafrost, polythermal glaciers and the presence of both colluvial landforms and moraines containing buried ice. Therefore, one can say that the runoff from these hydrological systems arises from combined effects of energy exchanges, mass exchanges within and between hydrological components and their hydraulics. As a result, hydrological processes are described hereafter for different periods of the year, namely winter, snowmelt, and summer. The winter period is characterized by negative temperatures, solid precipitation and snow and ice accumulation. The snowmelt period starts when air temperature rises above 0°C during the day, and is characterized by the depletion of snow cover. The summer period is characterized by the absence of snowpack on slopes and valley floor, and positive mean daily temperatures.
Conceptually, I will divide subarctic glacierized watershed into three zones: main glacier, proglacial field (i.e. transitional landscape from glacierized to non-glacierized, Heckmann, Mccoll, & Morche, 2016) and alpine meadow (i.e. grassland in lower parts of the watershed, Hayashi, 2019). Even though those three parts interact with one another, for readability, they are presented separately hereunder. The first two sections describe hydrological processes
8
related to glaciers and the evolution of these processes under changing climate. Section 3 and 4 are dedicated to hydrological processes within the proglacial field and their response to increasing temperatures respectively. Finally, Sections 5 and 6 are focused on the lower part of the watershed that coincides with the alpine meadow and describe related hydrological processes and their projected changes.
1.1 Glaciers hydrology
Since there exists a large body of literature about glaciers hydrology in all regions, this section is mostly based on the reviews and “classic” works in glaciology and glacier hydrology. Also, as this project is based in a watershed where no debris-covered glaciers are observed, the review on their hydrology is not presented.
The runoff generated by glaciers is controlled by meltwater production resulting from ablation processes, water storage through accumulation, and routing of meltwater above and within the glacier system. Ablation processes, which provide water input into the system, take place at the glacier surface (supraglacial melting), within the glacier (englacial melting) and at the glacier bed (subglacial melting) (Walder & Fountain, 1998). In addition, water can be supplied to the system by external sources such as precipitation and snowmelt (Irvine-Fynn & Hodson, 2011). These different sources contribute to the total glacier runoff in different ways, supraglacial melting being a major source of water for most glacierized areas (Hock, 2005). Supraglacial melt occurs when the surface energy balance is positive and the surface is at melting point. Pronounced diurnal cyclicity of energy components, especially the radiative ones, imposes a marked diurnal variability in supraglacial melt (Jansson, Hock, & Schneider, 2003). Meltwater production reaches its peak during the day, following shortwave radiation and air temperature maxima. It reaches its minimum during the night when there is no or little energy available for melting (e.g., Klok, Nolan, & Van den Broeke, 2005). In the subarctic at the seasonal scale, most of the annual runoff is concentrated within the ablation season, when temperature and radiation are higher, and it is small during the accumulation season, when most of the precipitation is stored as snow (e.g., Huss, Bauder, & Funk, 2009; Moore &
9
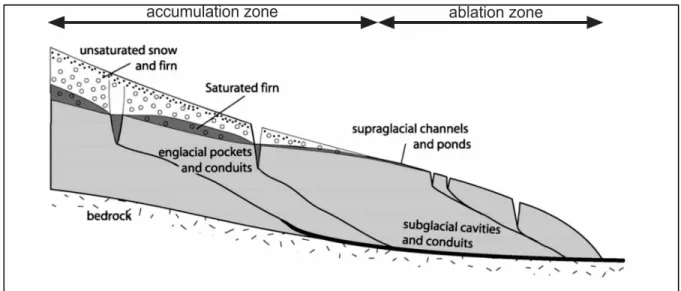
Demuth, 2001). Water can also be stored during the ablation season and it depends on the spatial distribution of the seasonal snowpack and firn layers. By storing water, snow and firn layers delay water delivery to the englacial and subglacial conduits and cavities, and tend to smooth the diurnal variations in meltwater input (Walder & Fountain, 1998). Delay times can range between several days to weeks for the firn area, and are of the order of few hours for ice-covered areas (Jansson et al., 2003). Once released, water undergoes routing processes. The routing system of a clean-ice glacier can be divided into supraglacial, englacial and subglacial (Irvine‐Fynn & Hodson, 2011) (Figure 1.1).
Figure 1.1 Hydrological system of a temperate glacier Adapted from Jansson et al. (2003)
Supraglacial channels develop on the glacier surface and drain meltwater via crevasses and moulins into the englacial and subglacial drainage system (Nienow, Sharp, & Willis, 1998). In there, water can be transported by percolation through ice (distributed or "slow" drainage system) or more efficiently by means of englacial passages (channelized or "fast" drainage system). The increasing amount of water during the ablation season augments the water pressure within the glacier and leads to widening of channels, headward channel growth as snowline retreats up-glacier, and enhanced hydro-fracturing leading to the evolution of the drainage system in the course of the melt season (Nienow et al., 1998). As a result of water
10
routing, on a watershed scale glacier cover has a buffering effect on runoff (Fleming & Clarke, 2005; Fountain & Tangborn, 1985) with the lowest variability observed for watersheds where 40% of the area is glacierized (Walder & Fountain, 1998).
Based on the ice temperature distribution, glaciers can be classified as cold (ice temperature is below melting point), temperate (ice is at melting point) and polythermal (mixture of two). The thermal structure of a glacier depends on climate, meltwater refreezing, heat production associated with glacier dynamic processes, and geothermal heat sources (Irvine‐Fynn & Hodson, 2011). The thermal structure has important implications on glacier hydrology since unlike for temperate ice, water cannot percolate though the cold ice (Irvine‐Fynn & Hodson, 2011). As a result, the presence of cold ice will restrict water percolation to the en- and subglacial systems and thus water routing will be mainly performed via supraglacial channels (Hodgkins, Tranter, & Dowdeswell, 1997). However, for certain cold glaciers icing formation due to winter subglacial drainage was observed and explained by water stored in channels underneath the glacier (Bælum & Benn, 2011; Naegeli, Lovell, Zemp, & Benn, 2014; Wainstein, Moorman, & Whitehead, 2014), which sometimes extend to moraine complex (Moorman, 2003). In the study area glaciers are most likely polythermal (Flowers, Copland, & Schoof, 2014; Wilson, Flowers, & Mingo, 2013). Thermal regimes of two middle-size glaciers in the region were investigated and it was shown that temperate ice is located in most of the accumulation zone (Figure 1.1), and ice thickness decreases towards ablation zone (Wilson & Flowers, 2013). Temperate ice in the accumulation zone can be explained by heat production via meltwater percolation and refreezing in accumulation zones. The produced heat can eliminate cold wave close to the surface (Wilson et al., 2013). This hypothesis was supported by observations of supraglacial runoff in the ablation area (Wilson et al., 2013). Observations of subglacial streams discharging from glacier tongues suggested that glaciers are temperate in parts of the terminus area.
In cold permafrost-underlined regions, glaciers insulate the ground underneath, influencing the distribution of taliks (year-long unfrozen ground). During winter, taliks allow releasing of water stored in glaciers to the surface, which in turn can result in icing formations in an
11
immediate proglacial field (e.g., Sobota, 2016; Woo, 2012; Yde et al., 2012). Perfect conditions for icing formation imply that water flows for some distance before it freezes and, thus, these conditions are characterized either by slightly negative temperatures or by constant high rates of discharge during winter (Moorman & Michel, 2000). Icings are defined as a mass of surface ice formed during the winter by a successive freezing of sheets of water (Carey, 1973) and are generated when water floods onto existing ice (Moorman & Michel, 2000), snow surfaces (Hodgkins, Tranter, & Dowdeswell, 2004; Moorman & Michel, 2000; Stachnik, Yde, Kondracka, Ignatiuk, & Grzesik, 2016), or flows in between existing icing layers and freeze (Moorman & Michel, 2000). Thus, icing can grow both from the bottom due to ice accretion, and from the top due to water freezing and incorporation of snow (Stachnik et al., 2016). When water freezes quickly (i.e. flow rate is equal or smaller than freezing rate), a white bubbly ice layer is formed, and when the freezing is slow - it results in a clear ice layer (Moorman & Michel, 2000). When unfrozen water gets trapped between ice layers or when there is groundwater discharge underneath the existing ice layer, blister or icing mound can be formed due to increased hydrostatic pressure resulting from the freezing of trapped water (Carey, 1973; Michel, 1986).
1.2 Glacier response to climate change
In response to the current changing climate, glaciers are declining and retreating all over the world (Bliss, Hock, & Radić, 2014; Oerlemans, 2005; Zemp et al., 2015) with the exception of the Kunlun Shan region, where positive mass balances are reported, making the so-called “Karakoram anomaly” (Brun, Berthier, Wagnon, Kääb, & Treichler, 2017; Farinotti, Immerzeel, Kok, Quincey, & Dehecq, 2020; Hewitt, 2005; de Kok, Tuinenburg, Bonekamp, & Immerzeel, 2018). Otherwise, the primary response of glaciers to rising temperatures is the increase in glacier runoff as a result of higher melt rates. During this first stage, enhanced melt per unit area balances out the reduction in glacier volume. When the glacier volume decreases significantly and becomes too small to provide enough meltwater, runoff starts decreasing (Jansson et al., 2003). The turning point is commonly referred to as peak water (Carey et al., 2014; Huss & Hock, 2018; Mark, Mckenzie, & Gomez, 2005; Milner, Brown, & Hannah,
12
2009; Moore et al., 2009). Some studies have shown that the switch between increasing and decreasing streamflow coincides with a glacier cover decrease below 10% of the watershed area (Birsan, Molnar, Burlando, & Pfaundler, 2005; Fleming & Clarke, 2003; Hodgkins, 2009; Pellicciotti, Bauder, & Parola, 2010). In terms of runoff variability, meltwater routing becomes more efficient as glacier loses its thickness, which leads to increased diurnal amplitudes in runoff (Walder & Fountain, 1998; Hock, Jansson, & Braun, 2005). Seasonal and year-to-year runoff variability of a glacierized watershed also increases, as the glacier cover continues losing its buffering capacity (Fleming & Clarke, 2005; van Tiel, Kohn, Van Loon, & Stahl, 2019; Walder & Fountain, 1998). In addition, peak discharge timing shifts towards earlier in the season, closer to snowmelt peak (Beniston et al., 2018). A recent global study by Huss and Hock (2018) used the Global Glacier Evolution Model to calculate changes in glacier mass and subsequent changes in river runoff, and showed that most glacierized catchments south from the subarctic area, with an exception of Himalaya region, have passed peak water. The same study shows that, in the subarctic St. Elias Mountains (Yukon, Canada), large glacierized watersheds have not yet reached peak water, and that a continuous increase in glacier runoff contribution to main stream runoff during an ablation season (i.e. July – October) for the period 2000-2090 is projected (Huss & Hock, 2018). In the same region, Fleming and Clarke (2003) also report an increase in annual runoff volumes for all glacierized watersheds and detect no changes for non-glacierized watersheds, suggesting that glacier cover is a primary control over magnitude and direction of watershed’s response to changes in climatic forcing. Brabets and Walvoord (2009) detected an increase in annual discharge for some glacier-fed streams in the Yukon River Basin, which they also attributed to increased glacier melt contribution. In neighbouring subarctic Alaska, an increased flow variability and intensive flow reduction is projected for the ablation season and during the recession period for the end of the century (Van Tiel et al., 2018).
Glacier retreat is known to affect the geomorphology of the immediate proglacial field and, as a result, will change the distribution of moraine-dammed lakes (Johnson, 1986), which in some cases can lead to river piracy and thus have implications for downstream runoff (Shugar et al., 2017). Another geomorphological consequence of glacier retreat is stagnant glacier ice
13
deposition within the immediate proglacial field. This ice gradually gets buried by glacier moraines and slope colluvial material, thus forming buried ice features (Everest & Bradwell, 2003; Johnson, 1986; Schomacker, 2008).
Climate change and consequent glacier shrinkage will also affect glaciers thermal regime. Simulations show that, under negative mass balance conditions, mid-sized glaciers in the study region exhibit general cooling and will become entirely cold before disappearing (Wilson & Flowers, 2013; Wilson et al., 2013). This can be explained by the thinning of firn layers and retreating accumulation zone (Wilson & Flowers, 2013). A potential decrease in icing extent
next to glacier terminus can be expected due to changes in glacier thermal regimes from polythermal to cold (Sobota, 2016). However, a potential increase in icing extent can result from an increase in average winter temperatures, occurrence of melt events and increase in winter discharge (Sobota, 2016).
1.3 Proglacial field hydrology
Studies addressing hydrology within subarctic proglacial field are limited (e.g.,Vincent, Violette, & Aðalgeirsdóttir, 2019), and thus its conceptual hydrological model is summarized based on studies in tropical mountains (Peru and Chile), temperate mountains (Alps and Rockies), and a few studies from mountainous catchments in arctic and subarctic areas (Alaska and Iceland).
Proglacial fields are transitional landscapes “from glacial to non-glacial conditions” (Heckmann et al., 2016). They are characterized by the presence of features such as talus slopes, moraines, and they are regularly flooded by glacier meltwater (Cooper, Wadham, Tranter, Hodgkins, & Peters, 2002). In glacierized watersheds in temperate-climate mountains, the groundwater stored in moraines and talus buffers a watershed response to both melt and precipitation events (Cochand, Christe, Ornstein, & Hunkeler, 2019; Langston, Bentley, Hayashi, Mcclymont, & Pidlisecky, 2011; McClymont et al., 2011) and maintains summer baseflow (Muir et al., 2011). The mechanism by which they contribute to the runoff is similar
14
to fill-and-spill mechanism where water accumulates in small bedrock depressions at the bottom of the moraine/talus (Langston et al., 2011; Muir et al., 2011). The runoff from these colluvial features is also important during winter season, in particular during years with reduced snowmelt (Stoelzle, Schuetz, Weiler, Stahl, & Tallaksen, 2019). In some regions groundwater discharge from a talus can be the dominant component of the winter baseflow (Cochand et al., 2019; Clow et al., 2003; Muir et al., 2011).
As a result of glacier dynamics (glacier advance, surging, and retreat), specific features, such as buried ice and ice-cored moraines, form in the subarctic proglacial field (Johnson, 1971). A debris cover above buried ice or ice core shields it from direct radiation, and thus the energy for melting is delivered to the ice surface by means of heat transfer through the debris cover. Ice-cored moraine ablation can be enhanced by the removal of the debris and bare ice exposure. The removal of the debris layer can happen as a result of its saturation by meteoric water and consequent sliding due to gravitational processes. Moreover, glacier meltwater can erode moraine sediments and, in addition to producing thermal erosion of the ice, it can destabilize the debris layer and trigger its further removal (Johnson, 1971).
Within proglacial areas, two groundwater systems are often distinguished: the shallow (or fast) and the deep (or slow) groundwater (Crossman, Bradley, Boomer, & Milner, 2011; Hood, Roy, & Hayashi, 2006; McClymont et al., 2011; Roy & Hayashi, 2009). A shallow system comprises upper layers of glacier sediments, where the infiltration into deeper layers can be abstracted by impermeable boundaries such as buried ice (Langston et al., 2011; McClymont et al., 2011; Roy & Hayashi, 2009) or shallow bedrock (Roy & Hayashi, 2009). In deep groundwater systems, water either flows through the network of fractures within the bedrock (Ajami, Troch, Maddock, Meixner, & Eastoe, 2011) or on the top of the bedrock (McClymont et al., 2011). In permafrost underlined regions, these systems evolve as the thaw season progresses and thawed layer thickness changes (Cooper et al., 2002).
Proglacial field groundwater aquifers are recharged by glacier melt (Liljedahl, Gaedeke, O’Neel, Gatesman., & Douglas, 2016; Roy & Hayashi, 2009), snowmelt (Brown et al., 2006;
15
Cochand et al., 2019; Muir et al., 2011; Penna et al., 2014; Roy & Hayashi, 2009), rain (Dochartaigh et al., 2019; Roy & Hayashi, 2009), possibly buried (or stagnant) ice melt (Cooper et al., 2002; Levy, Robinson, Krause, Waller, & Weatherill, 2015; Roy & Hayashi, 2009) as well as water discharging from moraines and taluses (Dochartaigh et al., 2019). In general, at the beginning of the ablation season, snowmelt is the principal source of groundwater recharge and, as the season progresses, its role diminishes and the recharge from both ice melt and rain increases (Crossman et al., 2011). Due to its limited storage capacity, at the beginning of the ablation season, an aquifer within the proglacial field is mostly recharged. Later in the ablation season, when the level in the stream subsides following the melt rates decrease, the groundwater stored in this aquifer is discharged into the stream (Cooper et al., 2002). As stored water discharges, the water table gradually lowers (Cochand et al., 2019; Dochartaigh et al., 2019).
The contribution of these different hydrological components to the subsurface flow is complex and it both depends on the season and varies in space: within the parts that are closer to the glacier and the main stream, the groundwater aquifer is mostly recharged by glacier meltwater (Dochartaigh et al., 2019; Levy et al., 2015), whereas further from the stream its recharge is dominated by precipitation and/or water from moraines and taluses (Dochartaigh et al., 2019). Moreover, when moving downstream from the glacier outlet, groundwater discharge into main stream is observed, whereas at the upper reaches the groundwater aquifer is mainly recharged by the stream (Dochartaigh et al., 2019).
1.4 Proglacial field evolution under changing climate
There are not many observations yet about the evolution of subarctic proglacial field hydrology in a context of climate change, and most of the relevant studies focus on the evolution of groundwater systems within the non-glacierized part of the watershed. Thus, this sub-section will describe the hydrogeological changes within a proglacial field in response to climatic-change-driven hydrological changes.
16
In response to climate change, a decline of groundwater levels was observed in glacierized watersheds in British Columbia, Canada (Moore, Allen, & Stahl, 2007) and in Skeidararsandur, Iceland (Levy et al., 2015). The most pronounced changes are observed close to glacier margins, and the less pronounced are in the area of groundwater seeps (i.e. slow groundwater discharge through the voids and cracks in unconsolidated materials,Woo, 2012) (Levy et al., 2015). A pronounced lowering of water table next to glacier terminus is possibly a consequence of a decrease in aquifer recharge by glacier meltwater as glacier retreats (Levy et al., 2015). This hypothesis is confirmed by previous observations of a decline in groundwater levels in autumn and early spring when glacier ablation seizes (Robinson, Fairchild, & Russell, 2008), and by an observed direct link between meltwater production and groundwater levels close to glacier terminus (e. g. Cooper et al., 2002; Magnusson et al., 2014). In addition, glacier retreat will lead to a decrease in overburden pressure, which in turn will lower the hydraulic gradient within the proglacial field aquifer (Levy et al., 2015). In response to climate change, meltwater channels within the proglacial field will likely alter their positions following the change in glacier tongue position and its geometry, and due to ice-cored features formation (Johnson, 1986). This meltwater channles adjustement will affect surface-groundwater exchange. In addition, the hydrogeological system within the proglacial field is affected by changes in moraine lakes: in Skeidararsandur, groundwater levels measured close to moraine lakes declined following the decrease of lake area (Levy et al., 2015). Here, buried ice ablation can enhance the evolution and disappearance of moraine lakes (Levy et al., 2015).
Changes in water balance components such as precipitation and evaporation can affect shallow groundwater systems either directly, by changing water input to the system, or indirectly, by affecting meltwater production (Levy et al., 2015). In particular, precipitation events can enhance the melt of glaciers (Oltmanns, Straneo, & Tedesco, 2019) or that of buried ice by eroding the debris cover (Johnson, 1971; Levy et al., 2015). Indeed, buried ice degradation by backwasting seems to be more efficient in temperate humid climatic conditions, and minimal in cold dry climates (Schomacker, 2008).
17
On a larger scale, several modelling-based studies have attempted to predict groundwater/baseflow evolution in upper glacierized watersheds over the next century. In the Nepalese Himalaya, the baseflow is projected to increase, and together with increasing precipitation, it will maintain an increase in total runoff regardless the decreasing glacier runoff (Immerzeel, van Beek, Konz, Shrestha, & Bierkens, 2012). In the Peruvian Andes, relatively constant projected groundwater discharge will also buffer decreasing glacier runoff (Somers et al., 2019). In this region, glacier meltwater does not contribute significantly to groundwater storage, and an eventual decrease in groundwater discharge is attributed to increasing evaporation (Somers et al., 2019). Finally, in the Canadian Rockies modelling results for glacierized watershed show an increase in groundwater contribution to the total runoff throughout the year apart from July and August, when it is projected to decrease (Loukas, Vasiliades, & Dalezios, 2002). The groundwater input is projected to become more uniformly distributed throughout the year as a result of its increase during spring, summer and autumn, and its decrease during winter (Loukas et al., 2002).
1.5 Subarctic alpine meadow hydrology
In the alpine meadows of subarctic glacierized watersheds, hydrology is characterized by the presence of permafrost and seasonally frozen ground. Thus, to illustrate potential effects of permafrost on watershed hydrology, this section is based on studies from areas underlined by discontinuous permafrost.
The frozen ground is usually considered impermeable to groundwater flow (Woo, 2012). Groundwater circulation within permafrost underlain slopes can be suprapermafrost (above permafrost), intrapermafrost (in taliks, faults, and conduits within permafrost) and subpermafrost (below permafrost) (Woo, 2012). Because of the low hydraulic conductivity of frozen soil, the infiltration and storage capacity of subarctic aquifers are in general temperature-dependent (Hayashi, 2013; Woo, 1986). As a result, there is a spatial dependence of soils’ hydrological properties. For example, processes on South-facing (S-slope) and North-facing (N-slope) slopes of watershed differ due to differences in the incoming solar radiations.
18
Conceptually, the common effects of these differentiations are higher snow water equivalent (SWE) for N-slopes prior to melt, presence of permafrost and of an organic top layer (Carey & Woo, 1998; 2001b). It is important to note, that the subdivision into S- and N-facing slopes is mainly conceptual and that the hydrological systems of the watershed can be more complex.
With lower SWE, S-slope becomes snow free earlier in the snowmelt season. In the absence of permafrost, as the seasonal frost table lowers, water produced by snowmelt infiltrates into the mineral soil layer, thus, producing limited surface runoff and supplying the unfrozen groundwater reservoir. Once snow free, liquid precipitation infiltrates the S-slope and delays their contribution to the main stream (Carey & Quinton, 2004).
On N-facing slopes, infiltration is restricted due to underlying permafrost and, therefore, surface runoff plays a greater role in the contribution to main streams. At the beginning of the thawing season, the surface runoff from the N-facing slope is delayed because water produced by snowmelt can be stored in a thicker snowpack (Carey & Woo, 1998), and because infiltrated water is used for organic layer pre-wetting (Carey & Woo, 2001a). Once the snowpack has melted, the runoff production and the response time to liquid precipitation events from the N-facing slope will depend on the unfrozen layer thickness. Only once the upper organic layer has thawed, the flow can be enhanced by the presence of preferential paths within the organic layer (Woo, 2012). Once the flow is shifted to the mineral soil layers that start thawing, runoff rate decreases due to the lower permeability of mineral soils. The switch between these two horizons can also happen due to water table rise as a result of precipitation events. N-facing slopes are conceptually divided into two zones: the slope base with a thicker organic layer and the upslope area with a thinner organic layer (Quinton & Marsh, 1999). When water table rises, both zones deliver water through the saturated organic layer to the main stream (Carey & Woo, 2001a). Once the water table lowers, the upslope area becomes hydrologically disconnected from the stream, and only the slope base keeps on contributing to the stream (Quinton & Marsh, 1999).