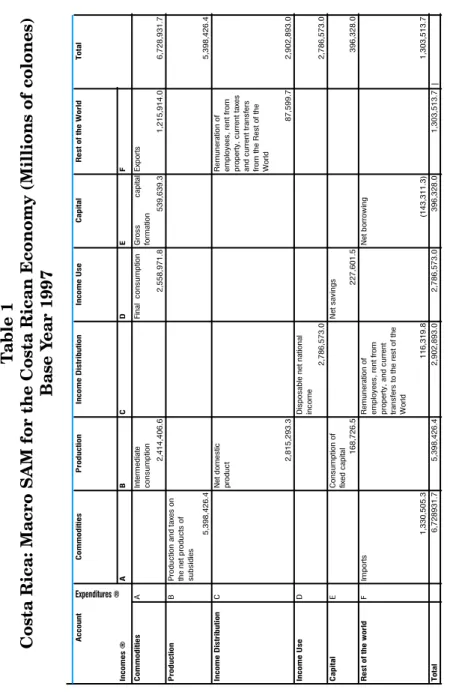
Matriz de contabilidad social para Costa Rica (MCS97). Resultados finales y desarrollo metodológico de su construcción
80
0
0
Texte intégral
(2)
(3)
(4)
(5)
(6)
(7)
(8)
(9)
(10)
(11)
(12)(13)
(14)
(15)
(16)
(17)
(18)(19)
(20)
(21)
(22)
(23)
(24)
(25)
(26)
(27)
(28)
(29)
(30)
(31)
(32)
(33)
(34)
(35)
(36)
(37)
Figure

Documents relatifs
Educational and social actions are actions that are related to the increase of environmental awareness of tourists and Costa Rican citizens, the support of environmental
Les accidents du travail rapportés par ces salariés sont également plus fréquents, notam- ment pour ceux des sous-traitants de dernier rang : 11 % déclarent au moins un accident
intervenants scolaires appelés à accompagner des victimes d’intimidation. Avant de remplir le questionnaire, vous serez invité.e à fournir un consentement libre et éclairé à
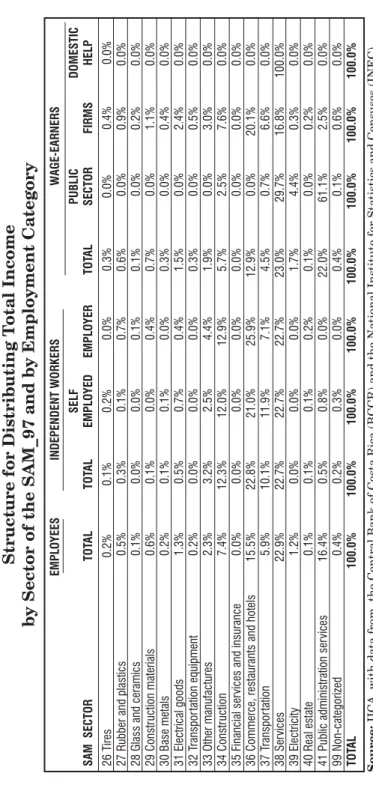
Tables 1 and 2 show some descriptive statistics of important characteristics by income group: i) the percentage of workers with temporary contracts are higher among low income
L’archive ouverte pluridisciplinaire HAL, est destinée au dépôt et à la diffusion de documents scientifiques de niveau recherche, publiés ou non, émanant des
ACKR3, atypical chemokine receptor 3; ALL, acute lymphoblastic leukemia; AML, acute myeloid leukemia; CFP, cyan fluorescent protein; CNS, central nervous
Off-state plastic viscosity (a) and off-state dynamic yield stress (b) of MRFs as a function sepiolite concentration sep ' for different concentrations of
Social capital has been used widely to enlighten the following topics 1 : differences in economic development (Woolcock and Narayan, 2000; Putnam, 1993; Dasgupta, 1997), policies
