HAL Id: hal-01385614
https://hal.inria.fr/hal-01385614
Submitted on 21 Oct 2016
HAL is a multi-disciplinary open access
archive for the deposit and dissemination of
sci-entific research documents, whether they are
pub-lished or not. The documents may come from
teaching and research institutions in France or
abroad, or from public or private research centers.
L’archive ouverte pluridisciplinaire HAL, est
destinée au dépôt et à la diffusion de documents
scientifiques de niveau recherche, publiés ou non,
émanant des établissements d’enseignement et de
recherche français ou étrangers, des laboratoires
publics ou privés.
Identifying Genetic Variant Combinations using
Skypatterns
Hoang-Son Pham, Dominique Lavenier, Alexandre Termier
To cite this version:
Hoang-Son Pham, Dominique Lavenier, Alexandre Termier. Identifying Genetic Variant
Combina-tions using Skypatterns. 7th International Workshop on Biological Knowledge Discovery and Data
Mining (Workshop BIOKDD ’16 ), DEXA, Sep 2016, Porto, Portugal. �10.1109/DEXA.2016.13�.
�hal-01385614�
Identifying Genetic Variant Combinations using
Skypatterns
Hoang-son Pham
IRISA University Rennes 1 35042 Rennes, France [email protected]Dominique Lavenier
IRISA CNRS 35042 Rennes, France [email protected]Alexandre Termier
IRISA University Rennes 1 35042 Rennes, France [email protected]Abstract—Identifying variant combination association with disease is a bioinformatics challenge. This problem can be solved by discriminative pattern mining that use statistical function to evaluate the significance of individual biological patterns. There is a wide range of such measures. However, selecting an appropriate measure as well as a suitable threshold in some specific practical situations is a difficult task. In this article, we propose to use the skypattern technique which allows combinations of measures to be used to evaluate the importance of variant combinations without having to select a given measure and a fixed threshold. Experiments on several real variant datasets demonstrate that the skypattern method effectively identifies the risk variant combinations related to diseases.
Keywords: Skypattern; Genetic Variants; Statistical Measures
I. INTRODUCTION
Identifying genetic variant combinations associated to dis-eases is a major task of genome-wide association studies (GWAS) [10]. With the evolution of genotyping technologies, the number of collected single nucleotide polymorphisms (SNP) is enormous. Hence, discovering combination of SNPs related to genotype is a challenge, even for pair-wise combina-tion examinacombina-tion [3]. Recently, this problem has been tackled with discriminative pattern mining, which plays an important role in data mining and machine learning [6]. Discriminative pattern algorithms aim to find a set of patterns having different frequency occurrences in two-class labeled data, which is equivalent to case-control data in GWAS. Discriminative pat-tern mining algorithms use statistical measures to evaluate the discriminative power of individual patterns. These measures are generally defined based on the relative supports of the pattern in the two classes [6]. They can be simply defined as the difference or growth rate of two supports, or other variations, such as odds ratio, chi-square, weighted relative accuracy (WRAcc), etc. These measures may be proposed for different discriminative pattern mining tasks. They can be applied to identify significant biological patterns. In practice, using only one measure is not effective. Researchers use additional technique or combine some measures to evaluate the statistical significance of biological patterns. For example, [1], [4], [7] utilized odds ratio, chi-square and p-value to evaluate the discriminative genotype combinations in case-control data. [5] implemented odds ratio, risk ratio (which is equivalent to growth rate) and risk difference (which is equivalent to
difference support) to evaluate the compound risk factors. There is a wide range of statistical discriminative power measures. Hence, selecting the most appropriate measures in some practical situations remains a significant challenge. In addition, for each measure users have to indicate an appro-priate threshold to evaluate the significance of patterns, which is extremely difficult in particular biological data. The reason is that when the thresholds are not strict, the pattern mining algorithms will generate many patterns of limited interest. On the other hand, some interesting patterns will be lost if the constraints are too restrictive.
In this article, we propose to use the skypattern technique, which is based on a Pareto-dominance relation between set of measures, to evaluate the significance of variant patterns. Skypatterns have been introduced by [8] to evaluate the pat-terns allowing multi-criteria decision to be taken in a threshold free manner. Given a set of patterns, each pattern is evaluated by a set of measures. Skypatterns are patterns which have dominance over the other patterns. Skypatterns are highly interesting because they not only receive a global evaluation from the set of measures, but also do not require any thresholds on the measures.
The outline of this paper as follows: we first present the background related to statistical discriminative power mea-sures and skypatterns. Subsequently, various experiments are conducted to evaluate the proposed method with real genetic variant disease datasets. In the last section, we summarize our study and highlight directions for future research.
II. STATISTICAL DISCRIMINATIVE POWER MEASURES
In this study, we focus on mining discriminative patterns in two-class data problems, which is equivalent to discovering the set of variant combinations in case-control datasets. Upon this issue, the case-control datasets can be transformed into the inputs of discriminative pattern discovery methods when considering variants as items; case and control are labels of the data. Thus, the definition of this problem is given as follows: Suppose D be a dataset consisting of n transactions with two-class label S1 (positive class) and S2 (negative class),
and a set of m items I = {i1, i2, ..., im}. The two sets of
transactions that belong to labels S1 and S2 are denoted by
TABLE I
STATISTICAL DISCRIMINATIVE POWER MEASURES
No Measures
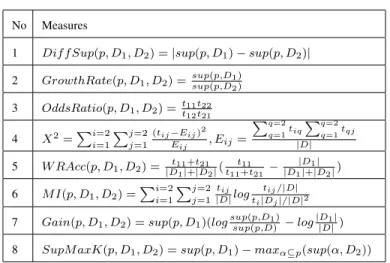
1 Dif f Sup(p, D1, D2) = |sup(p, D1) − sup(p, D2)|
2 GrowthRate(p, D1, D2) =sup(p,Dsup(p,D12))
3 OddsRatio(p, D1, D2) =tt11t22 12t21 4 X2=Pi=2 i=1 Pj=2 j=1 (tij−Eij)2 Eij , Eij= Pq=2 q=1tiq Pq=2 q=1tqj |D| 5 W RAcc(p, D1, D2) = |Dt11+t21 1|+|D2|( t11 t11+t21− |D1| |D1|+|D2|) 6 M I(p, D1, D2) =P i=2 i=1 Pj=2 j=1 tij |D|log tij/|D| ti|Dj|/|D|2
7 Gain(p, D1, D2) = sup(p, D1)(logsup(p,Dsup(p,D)1)− log|D|D|1|)
8 SupM axK(p, D1, D2) = sup(p, D1) − maxα⊆p(sup(α, D2))
TABLE II
A CONTINGENCY TABLE OF A PATTERN IN TWO-CLASS DATA
P resence Absence Sum
D1 t11 t12 |D1|
D2 t21 t22 |D2|
Sum t1 t2 |D|
t in D is a pair (x, y), where x is a subset of I, and y is one of the labels S1 or S2. A pattern p is a subset of I. The
support of a pattern p in Di (i ∈ {1, 2}) is defined as the
percentage of transactions that contains p in Di. A pattern p
is a discriminative pattern if it is able to pass a user-specified threshold for some measures. These constraints are calculated based on statistics or information theory. According to [6], there are various measures for evaluating the discriminative power of a pattern in two-class datasets, the most popular ones are showed in Table I. These measures are correlated to the discriminative power of a pattern. It means that the patterns are generally considered as more discriminative if the value is higher.
The discriminative power of a pattern is estimated based on the contingency table which shows the presence and the absence of the pattern in two-class data. Table II illustrates the contingency table of pattern p with respect to dataset D partitioned in D1, D2 according to the labels. Noticeably,
ti1(i ∈ {1, 2}) represents the number of transactions that
contain p in Di. Similarly, ti2 corresponds to the number
of transactions that does not include p in Di. Note that the
support of p in Di is defined by sup(p, Di) = |Dti1
i|.
These metrics are potential measures for evaluating the significance of a biological patterns; however, for many prac-tical situations, selecting an appropriate measure remains an obvious challenge. The reason is that the effectiveness of one discrimination measure may depend on different aspects, such as the distinction of target objectives, data types, discrimina-tive pattern categories, or the domain knowledge. Moreover, the individual measures strongly depend on a user-defined threshold which is not easy to determine in many situations. Thus, it is necessary to investigate a strategy to evaluate the
TABLE III TRANSACTION TABLET Transactions i1 i2 i3 i4 i5 i6 t1 1 1 1 1 0 1 t2 1 1 1 1 1 0 t3 1 1 0 0 0 0 t4 0 0 0 1 0 0 t5 1 0 1 0 0 0 t6 0 0 0 0 1 0 Items i1 i2 i3 i4 i5 i6 Value 20 30 10 40 60 55
discriminative power of a pattern by combining some potential measures in a threshold free manner.
III. SKYPATTERNS
A. Skypatterns
Pattern mining techniques use threshold-based or top-k-ranking strategy to select the interesting patterns. However, it is difficult to choose an appropriate threshold or a k value in most practical situations. To solve this problem, [8] proposed to use skyline queries to mine skyline patterns (or skypatterns) in a threshold-free manner. The idea is that each pattern is evaluated by a set of measures. Pattern x is evaluated better than pattern y if x dominates y. It means that x has at least one measure better than y, and the other measures of x must be not worse than the measures of y. A traditional example for this problem is retail transaction data in which each transaction corresponds to a client invoice; and every item in the transaction is a product bought by the client. Individual patterns are evaluated by some criteria such as frequency, size and price respectively. A user selecting a set of patterns may consider a pattern with high frequency, large size and low price. In this case, we say that pattern x dominates another pattern y if x.f requency ≥ y.f requency, x.size ≥ y.size, x.price ≥ y.price, where at least one inequality is strict. The general definitions of skypatterns are stated as follows:
We consider D and I as defined in section 2. An indi-vidual pattern is evaluated by a set of k measures M = {m1, m2, ..., mk}.
Dominance: Given a set of measures M , a pattern p dominates another pattern q with respect to M , denoted by p M q, iff ∀m ∈ M , m(p) ≥ m(q) and ∃m ∈ M such that
m(p) > m(q).
Skypattern and skypattern operator: Given a set of patterns P , each pattern is evaluated by a set of measures M . A skypattern with respect to M is a pattern not dominated in M . The skypattern operator, which is denoted by Sky(M ), returns all the skypatterns with respect to M .
Sky(M ) = {p ∈ P | 6 ∃q ∈ P : q M p}.
For example, Table III presents a transaction table T includ-ing 6 transactions denoted by t1, ..., t6which are described by
6 items i1, ..., i6. Each individual pattern is evaluated by a set
of measures M including:
- m1: f req(p) is the frequency of pattern p.
- m2: size(p) is cardinality of pattern p.
- m3: area(p) = f req(p) ∗ size(p).
Considering pattern i1i2i3i4 for example, we have
f req(i1i2i3i4) = 2, size(i1i2i3i4) = 4, area(i1i2i3i4) = 8
and mean(i1i2i3i4.value) = 25).
Pattern i1i2i3i4dominates pattern i1i2i3with respect to the
set of measures M = {f req, size}, because f req(i1i2i3i4) =
f req(i1i2i3) and size(i1i2i3i4) > size(i1i2i3).
Fig. 1. Example of skypattern for set of measures M = {f req, size}
The skypattern operator Sky(M ) with respect to the set of measures M = {f req, size} will generate all skypatterns which are showed in Fig. 1a. Fig. 1b is a graphical presentation of Sky(M ). The shaded area in Fig. 1b is called the dominated area because it cannot contain any skypatterns.
B. Skypattern cube
In practice, selecting the most appropriate set of measures to evaluate the importance of patterns is a difficult task because users may not know exactly the role of each measure. Never-theless, users can keep all the potential measures; then add or remove a measure to look how the skypattern set changes. To explore the different sets of measures, [9] proposes the notion of skypattern cube. The skypattern cube is a lattice over all subsets of measures where each node of the lattice corresponds to a subset of measures and its skypattern set. Based on this structure, users can have a better understanding about the role of measures by observing the new skypatterns or the ones which disappear when adding or removing a measure in two neighboring nodes. Additionally, different subsets of measures may lead to the same set of skypatterns and thus be shown as equivalent. This helps users to classify the measure subsets effectively. The definition of the skypattern cube is given as follows:
Given a set of measures M , the skypattern cube with respect to M , denoted by SkyCube(M ), consists of 2|M |− 1 skypattern sets which are generated by Sky(Mu), for all
Mu⊆ M .
SkyCube(M ) = {(Mu, Sky(Mu))|Mu⊆ M, Mu6= ∅}.
SkyCube is a software implemented to compute skypattern cube thanks to a relaxation strategy in the pattern mining pro-cess [9]. This software discovers and presents skypatterns in a lattice structure which enable users to perform various queries effectively and to discover the most interesting skypattern sets.
TABLE IV
SEVEN COMMON DISEASES DATASETS
No Disease Gene Chromo
some
SNPs
1 Bipolar disorder (BD) PALB2 16 rs420259
2 Coronary artery dis-ease (CAD) CDKN2A 9 rs1333049 3 Crohn’s disease (CD) BSN 3 rs9858542 4 Hypertension (HT) RYR2 1 rs2820037 5 Rheumatoid arthritis (RA) PTPN22 1 rs6679677
6 Type 1 diabetes (T1D) KIAA0350 16 rs12708716 7 Type 2 diabetes (T2D) TCF7L2 10 rs4506565
Whole skypattern cube may generate skypatterns that are redundant in the nodes. For example, a skypattern p can be present in many different nodes. Thus, we use the compression function of the SkyCube to keep only the proper skypatterns of each node. A proper skypattern of a node is a skypattern that is not derived from its child nodes. For example p2 is a
proper skypattern for {m1, m2} if p2 is not a skypattern for
{m1} nor {m2}. In some cases a node may not have proper
skypatterns, so it disappears from the compressed SkyCube. IV. EXPERIMENTS
A. Datasets
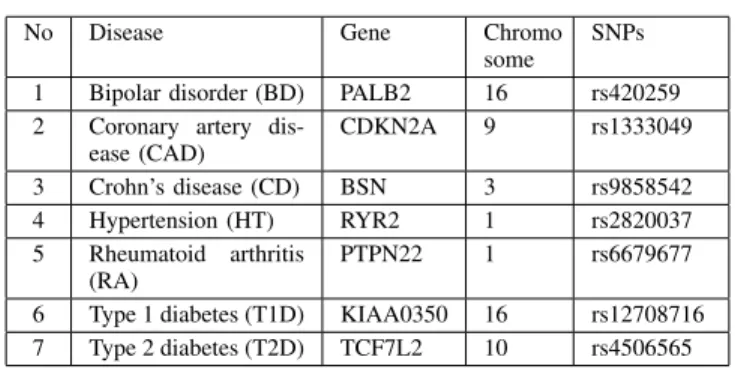
In this study, we use 7 real case-control SNP datasets which are provided by Wellcome Trust Sanger Institute (http://www.sanger.ac.uk/) to evaluate the effectiveness of the proposed method. For each disease we select 100 SNPs including SNP related to disease on a particular chromosome. Based on the results of [2], the strong signal SNPs associated with diseases are showed in Table IV.
The purpose of experiments is to evaluate the effectiveness of skypatterns with respect to the set of measures. The effec-tiveness of a measure (or set of measures) is assessed based on the number of interesting SNP genotype combinations that it found. According to the literature there is no report related to SNP combinations association with these diseases. Thus, in this study we suppose that the interesting SNP genotype combinations are patterns containing at least one of the SNPs related to diseases that we found in the literature.
B. Mining skypatterns
Mining SNP genotype combinations and calculating sky-pattern cube are a computational challenge. Thus, in this experiment, the size of patterns are limited to three SNP genotypes. The skypatterns with respect to the set of measures are discovered by the following process: First, we use a brute-force strategy to mine all patterns with the size of 3. This process guarantees that all 3-SNP genotype combinations are taken into consideration. We then reduce the size of pattern set by filtering the less interesting combinations. In this case, the patterns having support in case group < 10% and support in control group > 50% are removed. After reducing, each dataset consists of approximately 500,000 patterns. For each pattern, we generate a contingency table. The two rows of the
TABLE V
NUMBER OF RISK PATTERNS IDENTIFIED BY INDIVIDUAL METRICS
No Measures BD CAD CD HT RA T1D T2D 1 DiffSup 0 10 0 20 97 0 0 2 GrowthRate 4 33 0 21 91 10 9 3 OddsRatio 5 53 0 19 91 10 9 4 X2 2 27 16 21 100 4 47 5 WRAcc 0 10 0 22 98 0 0 6 MI 3 9 0 18 90 16 11 7 Gain 4 53 0 22 98 8 0 8 SupMaxPair 0 0 0 53 0 10 0
table stand for case and control group; two columns are for the presence and the absence of the pattern in these two groups. In order to assess a wide range of measures for evaluating the interest of biological patterns, we use the set of 8 measures which is showed in Table I. Noticeably, among these measures, the DiffSup is equivalent to the risk difference; and the GrowthRate is equivalent to the risk ratio [5]. Additionally, SupMaxPair, a specific case of SupMaxK (K=2), is used. Finally, the set of patterns which are evaluated by 8 measures, are then used to mine skypatterns with SkyCube.
C. Results
Firstly, we evaluate the effectiveness of individual measures for identifying the SNP genotype combinations related to dis-eases. This result is used as a baseline to compare and evaluate the effectiveness of skypatterns over patterns evaluated by individual measures. For each measure, we select the top 100 patterns which have the highest discriminative power for analysis. The effectiveness of individual measures is assessed based on the number of patterns containing the SNP genotype associated to disease in this set. Table V shows the number of important SNP genotype combinations which are identified by individual measures in 7 datasets.
The most effective measure is X2 which can discover interesting SNP genotype combinations in all datasets. The highest effectiveness of X2 is for RA disease. However, in the other datasets, the efficiency of X2 decreases. In contrast, the group of measures including DiffSup, WRAcc, SupMaxPair is the least effective. These methods can only detect variants related to disease in some datasets. The other measures such as GrowthRate, OddsRatio, MI and Gain give a higher effectiveness. The notable methods in this group are OddsRatio and GrowthRate. Both of them discover risk variant combinations in 6/7 datasets. In short, there is no measure best for all datasets. However, each measure effectively identifies risk variant combinations in a particular dataset.
We then analyze the skypatterns generated from SkyCube. According to the subsets of measures which give proper skypatterns, we analyze the skypattern sets with respect to the combinations of 2 to 4 measures.
Firstly, we consider the skypattern sets with respect to 2 measures. Based on the number of interesting SNP genotype combinations found in each skypattern set, the most effective 2-measure combination is {GrowthRate, SupMaxPair}. The lowest effective methods is {DiffSup, WRAcc}. Table VI presents the most effective 2-measure combinations. Note that,
TABLE VI
THE HIGHEST EFFECTIVENESS OF TWO-MEASURE SETS
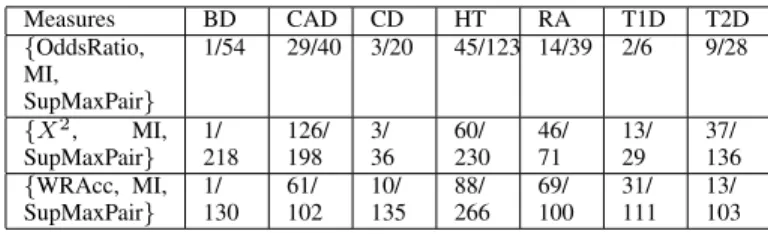
Measures BD CAD CD HT RA T1D T2D {GrowthRate, SupMaxPair} 0/12 10/15 13/21 12/15 10/14 6/14 7/24 {OddsRatio, SupMaxPair} 0/14 8/13 13/21 8/11 10/15 4/9 2/20 {MI, SupMaxPair} 0/35 25/56 16/36 17/51 10/43 6/24 18/51 TABLE VII
THE HIGHEST EFFECTIVENESS OF THREE-MEASURE SETS
Measures BD CAD CD HT RA T1D T2D {OddsRatio, MI, SupMaxPair} 1/54 29/40 3/20 45/123 14/39 2/6 9/28 {X2, MI, SupMaxPair} 1/ 218 126/ 198 3/ 36 60/ 230 46/ 71 13/ 29 37/ 136 {WRAcc, MI, SupMaxPair} 1/ 130 61/ 102 10/ 135 88/ 266 69/ 100 31/ 111 13/ 103
in this table, the effectiveness of the measure combinations are presented by the number of risk patterns per total skypatterns. These 2-measure combinations can identify many risk vari-ant combinations in their equivalent skypattern sets. Con-sidering CD dataset for example, these measure compounds can detect interesting SNP genotype combinations effectively. Particularly, the ratio of skypatterns containing risk variant over the total of skypatterns of {GrowthRate, SupMaxPair} , {OddsRatio, SupMaxPair}, and {MI, SupMaxPair} are 13/21, 13/21, and 16/36 respectively. Notably, for this dataset most individual measures cannot detect risk variant combinations in the top of 100 patterns, except X2.
Similarly, the result of the most effective 3-measure com-binations is presented in Table VII. According to this re-sult, {OddsRatio, MI, SupMaxPair} is the most effective 3-measure combination. It identifies risk variant groups in all datasets. The highest effectiveness is for CAD with 29 out of 40 skypatterns containing risk SNP genotype. However, this combination is less efficient in BD where there is only 1 skypattern including risk variant over 54 skypatterns.
In comparison with 2-measure combinations, the set of measures {OddsRatio, MI, SupMaxPair} is less effective. For example, with 7 datasets, there are 4 out of 7 datasets in which the combination of {GrowthRate, SupMaxPair} is better than {OddsRatio, MI, SupMaxPair}. Table VIII presents the comparison of {GrowthRate, SupMaxPair} and {OddsRatio, MI, SupMaxPair}. Note that, to compare easily we used the ratio (# risk patterns/# skypatterns) to present the effectiveness of measure combinations in this table.
TABLE VIII
THE EFFECTIVENESS COMPARISON OF{GROWTHRATE, SUPMAXPAIR} AND{ODDSRATIO, MI, SUPMAXPAIR}
Measures BD CAD CD HT RA T1D T2D {GrowthRate, SupMaxPair} 0 0.67 0.62 0.8 0.71 0.43 0.29 {OddsRatio, MI, SupMaxPair} 0.02 0.73 0.15 0.37 0.36 0.33 0.32
TABLE IX
THE COMPARISON BETWEEN2-MEASURE COMBINATIONS ANDX2
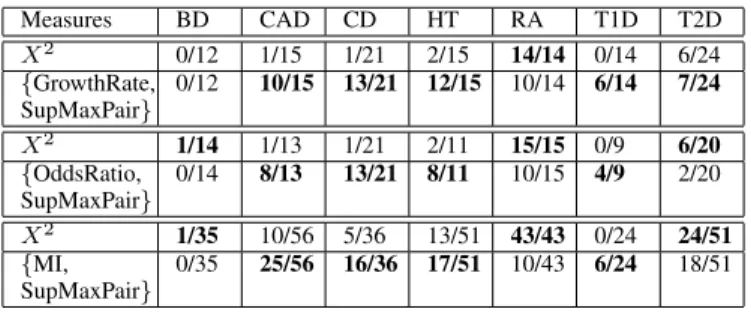
Measures BD CAD CD HT RA T1D T2D X2 0/12 1/15 1/21 2/15 14/14 0/14 6/24 {GrowthRate, SupMaxPair} 0/12 10/15 13/21 12/15 10/14 6/14 7/24 X2 1/14 1/13 1/21 2/11 15/15 0/9 6/20 {OddsRatio, SupMaxPair} 0/14 8/13 13/21 8/11 10/15 4/9 2/20 X2 1/35 10/56 5/36 13/51 43/43 0/24 24/51 {MI, SupMaxPair} 0/35 25/56 16/36 17/51 10/43 6/24 18/51
The combination of two or three measures can effectively discover the groups of variants associated to diseases. How-ever, it is less effective when we use 4-measure combinations. Particularly, these 4-measure combinations can only identify risk SNP genotype combinations in 2 out of 7 datasets including CAD and T2D. In the other remaining datasets, there is no risk variant combinations detected although the number of generated skypatterns are high. Especially, the SkyCube doesn’t generate any proper skypattern sets which corresponds to the combination of more than 4 measures.
In order to confirm the effectiveness of measure combi-nations over individual measures, we compare them with X2 which is the most efficient individual metrics. For fair comparison, the number of highest X2 patterns is reselected. For each dataset, we select the top-k patterns in descending order of X2 where k is the number of skypatterns which are generated from the combination of measures in that dataset. This comparison is fair as it considers in both cases the k first patterns that an analyst will examine. The efficiency of one method is evaluated better than the other if its pattern set contains a higher number of risk SNP genotype combinations. The comparison between 2-measure combinations and X2 is
showed in Table IX.
According to this result, the skypatterns with respect to {GrowthRate, SupMaxPair} contain more interesting SNP genotype combinations than X2does. Specifically, there are 5
out of 7 datasets in which {GrowthRate, SupMaxPair} is better than X2. They are equally efficient in BD; and less effective
than X2 in RA. Similarly, the effectiveness of {OddsRatio,
SupMaxPair} and {MI, SupMaxPair} are also better in average than X2. To be more specific, in 4 out of 7 datasets these
methods are better than X2, but they are worse than X2 in
the 3 remaining datasets (BD, HT, T2D).
In addition, the set of measures {OddsRatio, MI, SupMaxPair} is more effective than X2. Specifically, there are 5 out of 7 datasets in which {OddsRatio, MI, SupMaxPair} is better than X2; one is equal; and another one is less efficient
than X2. Table X illustrates the comparison of {OddsRatio,
MI, SupMaxPair} and X2.
To sum up, according to the results, using combina-tion of measures is more effective than using individ-ual measures. Particularly, X2 is the most effective indi-vidual measure, whereas, {GrowthRate, SupMaxPair} and {OddsRatio, MI, SupMaxPair} are the most effective for
TABLE X
THE COMPARISON BETWEEN{ODDSRATIO, MI, SUPMAXPAIR}ANDX2
Measures BD CAD CD HT RA T1D T2D X2 1/54 6/40 1/20 25/123 39/39 0/6 8/28 {OddsRatio, MI, SupMaxPair} 1/54 29/40 3/20 45/123 14/39 2/6 9/28
two and three measure combinations. In comparison with X2, both of {GrowthRate, SupMaxPair} and {OddsRatio, MI, SupMaxPair} are more efficient than X2. The set of measures {OddsRatio, MI, SupMaxPair} is less effective than {GrowthRate, SupMaxPair} slightly. The compound of 2 or 3 measures are effective but the combination of 4 measures or higher are not useful in our setting.
V. CONCLUSION
In this study we proposed to use the skypattern technique to identify the groups of variants associated with diseases. The experiments on various SNP datasets demonstrate that the proposed method is promising. The skypatterns with respect to the set of two or three statistical measures can effectively detect SNP genotype combinations related to diseases. In comparison with X2, the most effective individual method,
the set of two or three measures give a higher efficiency. However, it is not necessary to use more than 3-measure combinations because they do not generate proper skypatterns effectively. For further research, we will use algorithms to mine skypatterns with longer size on larger datasets.
ACKNOWLEDGEMENT
The authors thank the Wellcome Trust Sanger Institute for providing genetic variant diseases datasets and also thank Willy Ugarte for his support in using his SkyCube software.
REFERENCES
[1] Li-Yeh Chuang, Hsueh-Wei Chang, Ming-Cheng Lin, and Cheng-Hong Yang. Improved branch and bound algorithm for detecting snp-snp interactions in breast cancer. Journal of Clinical Bioinformatics, 3(1):1– 10, 2013.
[2] The Wellcome Trust Case Control Consortium. Genome-wide associa-tion study of 14,000 cases of seven common diseases and 3,000 shared controls. Nature, 447(7145):661–678, June 2007.
[3] Heather Cordell. Detecting gene-gene interactions that underlie human diseases. Nature Reviews Genetics, 10(6):392–404, 2009.
[4] Fang G, Haznadar M, Wang W, Yu H, Steinbach M, and Church TR. High-order snp combinations associated with complex diseases: Efficient discovery, statistical power and functional interactions. PLoS ONE, 2012.
[5] Jinyan Li and Qiang Yang. Strong compound-risk factors: Efficient discovery through emerging patterns and contrast sets. Information Technology in Biomedicine, IEEE Transactions, 11(5):544–552, 2007. [6] Xiaoqing Liu, Jun Wu, Feiyang Gu, Jie Wang, and Zengyou He.
Discriminative pattern mining and its applications in bioinformatics. Briefings in Bioinformatics, November 2014.
[7] Zhang Q, Long Q, and Ott J. Apriorigwas, a new pattern mining strategy for detecting genetic variants associated with disease through interaction effects. PLoS Comput Biol 10(6), 2014.
[8] A. Soulet, C. Raissi, M. Plantevit, and B. Cremilleux. Mining dominant patterns in the sky. In ICDM, pages 655–664, 2011.
[9] W. Ugarte, P. Boizumault, S. Loudni, and B. Cremilleux. Computing skypattern cubes using relaxation. In ICTAI, pages 859–866, Nov 2014. [10] Bush WS and Moore JH. Chapter 11: Genome-wide association studies.