HAL Id: hal-01304287
https://hal.inria.fr/hal-01304287
Submitted on 19 Apr 2016
HAL is a multi-disciplinary open access
archive for the deposit and dissemination of
sci-entific research documents, whether they are
pub-lished or not. The documents may come from
teaching and research institutions in France or
abroad, or from public or private research centers.
L’archive ouverte pluridisciplinaire HAL, est
destinée au dépôt et à la diffusion de documents
scientifiques de niveau recherche, publiés ou non,
émanant des établissements d’enseignement et de
recherche français ou étrangers, des laboratoires
publics ou privés.
Scaling Group Testing Similarity Search
Ahmet Iscen, Laurent Amsaleg, Teddy Furon
To cite this version:
Ahmet Iscen, Laurent Amsaleg, Teddy Furon.
Scaling Group Testing Similarity Search.
ACM
International Conference on Multimedia Retrieval 2016 , Jun 2016, New York, United States.
�10.1145/2911996.2912010�. �hal-01304287�
Scaling Group Testing Similarity Search
Ahmet Iscen
Inria Rennes, France[email protected]
Laurent Amsaleg
CNRS-IRISA Rennes, France[email protected]
Teddy Furon
Inria Rennes, France[email protected]
ABSTRACT
The large dimensionality of modern image feature vectors, up to thousands of dimensions, is challenging the high di-mensional indexing techniques. Traditional approaches fail at returning good quality results within a response time that is usable in practice. However, similarity search techniques inspired by the group testing framework have recently been proposed in an attempt to specifically defeat the curse of dimensionality. Yet, group testing does not scale and fails at indexing very large collections of images because its inter-nal procedures ainter-nalyze an excessively large fraction of the indexed data collection. This paper identifies these diffi-culties and proposes extensions to the group testing frame-work for similarity searches that allow to handle larger col-lections of feature vectors. We demonstrate that it can re-turn high quality results much faster compared to state-of-the-art group testing strategies when indexing truly high-dimensional features that are indeed hardly indexable with traditional indexing approaches.
1.
INTRODUCTION
Despite several decades of intensive activity, the field of image retrieval and similarity search is still very active, with recent and strong contributions to the domains of image de-scription as well as high-dimensional indexing. The state-of-the-art for extracting low-level features from images made significant progresses during the last few years. On one hand, researchers designed sophisticated aggregation tech-niques for local features [2,3,12,15]. Such features were lim-iting the ability to scale to indexing very large collections, as managing millions or billions of local descriptors is very resource consuming. Aggregation turns the many local de-scriptors of one image into a unique higher-dimensional vec-tor by taking advantage of the locality and co-variant prop-erties of the local features, preserving most of the discrim-itative power of the original features. On the other hand, another recent and even more promising progress uses the response of a deep learning architecture as a global
descrip-ACM ISBN 978-1-4503-4359-6/16/06. . . $15.00
DOI:http://dx.doi.org/10.1145/2911996.2912010
tor [3], or aggregates the activation of intermediate layers into a descriptor [8].
Overall, such techniques facilitate scaling to larger collec-tions as there are much fewer descriptors to manage. Yet, indexing these descriptors is required for efficiently answer-ing queries, but this turns out to be very challenganswer-ing. Those (modern) descriptors typically lie within extremely high-dimensional spaces; not only their representational dimen-sion is high as they have thousands of components, but their intrinsic dimensionality is also high as most of these compo-nents are needed for discriminability.
In turn, most of the traditional high-dimensional indexing techniques fail due to the curse of dimensionality [19]. The partitioning strategies they all use eventually fail at preserv-ing neighbors in the same partitions, forcpreserv-ing the search pro-cedure to scan many partitions in order to determine good candidates for a query [13]. This extensive scanning is very inefficient and dramatically increases resource consumption and response time.
Similarity search techniques inspired by the group testing framework have recently been proposed in an attempt to specifically defeat the curse of dimensionality. Group test-ing has found applications in pharmacology, genome screen-ing and has first been adapted to image retrieval by Shi et al. [18] and then extended by Iscen et al. [10]. In this con-text, group testing specifically exploits the properties under-pinning truly high-dimensional spaces: the correlation be-tween two random unit vectors concentrates around zero as their dimension increases, facilitating by contrast the iden-tification of correlated (hence similar) vectors.
Like some traditional high-dimensional indexing schemes, group testing first forms overlapping groups of features and computes a representative vector for each group. Then, at query time, a test is performed on each group by checking the query against the representative vector. The output of the test reveals how likely the query matches one of the features in that group. The decoding step identifies some candidate features by analyzing all the test outputs. A final verification step computes the true similarities of the candi-date features with the query, and gives back a ranking from which it is easy to return the final result to the user.
Compared to more traditional high-dimensional indexing methods, the key differences with group testing are in the group formation strategies, the procedure to compute rep-resentatives and the decoding process that identifies candi-dates features from the test outputs. Works [18] and [10] prove group testing is particularly robust at higher dimen-sionalities and allows to return high-quality results faster
than the sequential scan, which is often the de facto pre-ferred method to run at high-dimension.
The group testing paradigm as it is applied in [18] and [10] can hardly be scaled to searching very large image collec-tions. First, too many tests are performed at query time when checking the query against the group representatives — the larger the collection, the more such representatives, which limits scalability. Second, unnecessary computations are done at decoding time because most of the tests indeed yield negative output.
This paper tackles these difficulties and proposes exten-sions to the group testing in order to handle larger collections of feature vectors. Specifically, it shows that it is surprisingly worth indexing the representatives, allowing to very quickly identify the few positive tests. It also shows that these few positive tests not only deliver enough information to identify the good candidates, but also accelerate the decoding step. In terms of quality, it shows that the group testing technique proposed here performs almost as well as other traditional indexing strategies (FLANN [14], LSH [5,7,9]) at a much lower cost, however.
The paper is organized as follows. Section 2 briefly re-views prior works on group testing and sketches traditional high-dimensional indexing methods such as the ones imple-mented in the FLANN library. Section 3 presents sGT, which stands for scalable Group Testing. We detail its group-ing and searchgroup-ing strategies designed to better cope with large scale image collections. The evaluation in Section4 shows the interest of sGT in a large-scale scenario. Section5 concludes the paper.
2.
RELATED WORK
Similarity search for image retrieval often boils down to running a k-nearest neighbor process. Assume that the dataset X is composed of N d-dimensional vectors {xi}Ni=1
such that kxik = 1, ∀1 ≤ i ≤ N . The similarity between two
vectors xi and xjcan be measured with the scalar product
x⊤ixjwhen all vectors are unit normalized.
2.1
Group testing
Group testing has been used in other computer science fields in the past to solve typical ‘needles in a haystack’ problems. It did not receive attention in the image retrieval community until the pioneering work of Shi et al. [18].
Their algorithm randomly assigns each feature to m mul-tiple groups, and each group consists of n features. This gives M groups in total, such that
M = mN
n . (1)
The representative vector for each group is simply the sum of features belonging to that group. More precisely, let [xi]Mj
be the d × n matrix storing the features of jth group, then the representative vector {yj}Mj=1is computed as:
yj=
X
xi∈Mj
xi. (2)
At search time, the query is compared to all the repre-sentative vectors. Assume that Y ∈ Rd×M is the matrix
containing the representative vectors in each column. Then, M group similarities for a given query q are calculated as:
v= [v1, ..., vM] ⊤
= Y⊤q. (3)
The group similarity vj is seen as a test output measure
roughly indicating whether or not the query is matching one of the features of the j-th group. This step has a complexity in O(M d).
The score uireveals how likely feature i matches the query.
It is simply the sum of the group similarities it belongs to: ui=
X
j∈Li
vj, (4)
where Liis the set of groups where the i-th feature is stored.
This step has a complexity in O(N M ).
Finally, a shortlist of size R << N is created based on the top scores of u, and a verification step reranks these candidate features based on their true similarities with the query. This final step has a complexity in O(Rd).
Another more recent work [10] optimizes the offline con-struction of the representative vectors by assuming that the query is a quasi-copy of a feature stored in some groups. It uses the Moore-Penrose pseudo-inverse [17]:
yj= [xi]Mj([xi] ⊤
Mj[xi]Mj)−11n. (5)
The authors show this is superior to the simple sum con-struction that is used in equation (2), theoretically and em-pirically, especially as the dimensionality d of the features grows. The decoding step is also optimized by applying the Neyman-Pearson hypothesis test in the form of ui =
P
j∈Lifj(vj). The total complexity is unchanged.
2.2
FLANN
FLANN is a well-known approximate similarity search li-brary which implements various high-dimensional indexing strategies [14]. Two of these strategies are the randomized k-d tree and the priority search k-means tree algorithms.
The classic k-d tree algorithm [6] splits the space accord-ing to the dimension with the highest variance. In contrast, FLANN’s k-d tree splits the space along a dimension chosen randomly from the top D dimensions that have the highest variance. In addition, FLANN creates a forest of random k-d trees that are all probek-d at query time. The relevant leaves identified in the trees are scanned for nearest neighbors, and that form of multiprobing helps the performance.
The priority search k-means tree algorithm recursively clusters the data points in K clusters at each level of the hi-erarchy of centroids, until the number of points in a cluster is less than K. At query time, the branches of the hierarchy are explored according to a distance-based priority.
2.3
Discussion
We have briefly described some background work. We now discuss the cons (first) and then the pros of using group testing versus using traditional similarity search techniques when indexing large collections of high-dimensional features like Fisher vectors [15], VLAD [2], T-embedding [12] or other CNN-based [3,8] descriptors. This discussion ends with a list of requirements that group testing approaches must meet in order to cope with scale, i.e., indexing very large collections of high-dimensional vectors.
Even though it is a state-of-art library, FLANN does not perform well for truly high-dimensional data, as acknowl-edged by its authors [14]. The experiments described later confirm that the effectiveness of FLANN decreases when in-dexing such high-dimensional descriptors. It is only possible to return high-quality results, however, at the expense of a
dramatic increase in the response time. This is caused by FLANN performing a very large number of checks to even-tually gather enough good neighbors. This problem is not specific to FLANN but caused by the curse of dimensionality whose effects are mitigated with extensive multiprobing.
In contrast, group testing is less sensitive to the curse of dimensionality and better handles high-dimensional fea-tures. Yet, its recent application to image search [10,18] experiences scalability problems. First, group testing has to compare the query to all the representatives group vectors and that comparison is currently done using a linear scan. This is clearly not scalable when the number of representa-tive group vectors grows, which is the case when indexing larger collections of images. Indexing larger collections (N grows) means for [10,18] that M as to grow too. At scale, this comparison step becomes excessively costly.
By construction, only a handful of group representative vectors are meaningful for a given query, hence most com-parisons between the query and the group representative vectors are done in a pure waste. Quickly identifying the best representatives is therefore a key requirement for de-signing scalable group testing approaches.
More importantly, the effectiveness of the group testing proposed in [10,18] vanishes as N grows. Compared to a linear scan of the features in O(N d), the gain in complexity (as detailed in Sect.2.1) is:
γ = M N + M d + R N. (6)
The second term shows that having M << N is not suffi-cient: At scale, M will become larger than d, spoiling the gain in complexity. This is solely due to the decoding pro-cedure of [18] and [10].
Furthermore, equation (4) is likely to sum extremely small values for the vjassociated to the representatives that turn
out not to be relevant for a query. Therefore, identifying the best representatives and ignoring the others, i.e., setting their vj to zero, diminishes the cost of decoding as many
factors can now be excluded from the sum in equation (4). It is not needed to take into account similarities to all rep-resentatives as [18] and [10] do.
Finally, the contributions in [18] and [10] compute the true similarities between the query and R << N features. Ac-cording to [18] and [10], R is typically equal to N/10, which, at scale, becomes prohibitively expensive as well. There-fore, the value of R has to be significantly reduced to allow scaling. Works [18] and [10] can not easily diminish R with-out severely endangering quality. They essentially keep M small to control the cost of evaluating equation (4) (which corresponds also to the second term of (6)). This is done by choosing m small( see eq. (1)). This implies that [18] and [10] have a rather small number m of evidences (i.e., test outputs vj) to evaluate the likelihood uiof being a match.
Very efficiently identifying the best representatives allows to use a larger value for m which strengthens the redundancy between the groups.
Consequently, the likelihood scores of the database fea-tures identified become more reliable because these scores are computed from more test outputs. For the non match-ing features, their likelihoods become less noisy, i.e., shrink to zero, because vj = 0 for irrelevant representative group
vectors. This improves the reliability of the decoding and makes possible the use of a lighter verification step, i.e.,
us-ing a small value for R.
On the pro side, the lessons learnt from the two group testing papers are the following ones. The most salient property of the group testing framework is its capacity to cope with truly high-dimensional datasets. This has been demonstrated in [18] where the performance improves as the dimensionality of the features increases. Iscen et al. [10] show that the Moore-Penrose pseudo-inverse construction (see eq. (5)) produces more informative representatives com-pared to the simple sum that is used in [18]. [10] also demon-strates that representatives are more informative when some form of similarity between features is used to weakly guide the creation of the groups instead of relying on a pure ran-dom strategy. They derived groups from running a k-means which clusters similar features in groups of very different cardinalities. However, reducing the unbalanced cardinali-ties between these groups is key to avoid similaricardinali-ties being dominated by overcrowded groups.
Taking the lessons learnt from [10,18] for granted, the above discussion allows to isolate two main requirements that must be addressed in order to design scalable group testing techniques:
• Requirement R1: Quick identification of the best representatives for a query and removal of the bottle-neck from eq. (4) by ignoring irrelevant vj values.
• Requirement R2: Increasing the groups redundancy to improve quality (m) allowing to decrease the num-ber of true similarities calculations (R).
3.
SCALING GROUP TESTING
This section describes the extensions to the group testing framework in order to facilitate scaling. The resulting ex-tended group testing algorithm is called sGT which stands for scalable group testing. We detail how the learnt lessons and the requirements detailed above can be addressed.
3.1
Even-Size Groups of Similar Vectors
We first address the lessons learnt from [10,18]. In order to create even-size groups of similar features, we propose to use the random k-d tree algorithm from FLANN. That al-gorithm gradually cuts in two equal subsets the collection of vectors to be indexed, until the bottom leaf of the k-d tree contains one unique feature. It is easy to navigate down a fully constructed k-d tree and identify the node where the two child sub-trees each consist of a total of n vectors. This is where we take control of the algorithm in the FLANN library: All the vectors below that particular node now go into two distinct groups. In order to have each feature as-signed to m groups, we simply launch the creation of m random k-d trees.
Once the groups have been formed this way, we compute the pseudo-inverse for each group in order to determine its representative (see eq. (5)). It is important to note that we take control of the construction process of the k-d trees in FLANN. Once the representatives are stored, the k-d trees are no longer needed and they are deallocated.
Please note that we have taken control of the k-d tree construction per se and there is nothing really specific to FLANN here. Using FLANN is handy because it is a state-of-the-art library anyone can download, facilitating the re-production of our methodology, and because it better copes
with high-dimensionality (compared to the regular k-d tree) thanks to his enhanced dimension splitting criterion.
3.2
Indexing Representative Vectors
We then address requirements R1 and R2. It is rather straightforward to insert the group representative vectors into an index in order to circumvent the linear scanning (see eq. (3)) limiting the scalability of [18] and [10]. Instead of determining the similarities to all M representatives, it is worth probing the index and get back the k representatives with the highest similarities to the query.
First, this is faster especially because most modern high-dimensional techniques are approximate and trade response-time for efficiency. Second, it is safe to force to zero the similarities vjbetween the query and the (M − k)
represen-tatives that remain. Since k is typically orders of magnitude smaller than M , (M − k) is a large value which saves a lot of resource consumption when running the decoding step: many vj= 0, making the computation of equation (4) very
sparse. Requirement R1 is hereby addressed.
Two comments are in order, however. First, most high-dimensional indexing schemes work for Euclidean distances. This is the case for some of the algorithms implemented within the FLANN library. It is not very complicated to translate a L2distance into a dot product as it is needed to
evaluate equation (3). We L2−normalize the representative
vectors to be compatible with the query whose norm equals one. We ask FLANN to index the database of these normal-ized representative vectors ¯yj= yj/kyjk. For the k nearest
neighbors output by FLANN, we compute the similarities: vj= 2 − k¯yj− qk2 2 kyjk = (¯y ⊤ jq)kyjk = y ⊤ jq. (7)
This conversion needs the extra storage of one scalar, kyjk,
per representative vector. After obtaining these similarities, we compute (4) and re-rank R top scoring features based on their true similarities with the query.
Second, indexing the M representatives facilitates increas-ing m, which is the number of groups each feature is assigned to. This addresses the requirement R2 and also positively impacts the quality of the results returned by group test-ing indextest-ing algorithms. The time it takes to retrieve k representatives indeed does not change that much when M increases. It is anyway much faster than the linear scan. Works [18] and [10] had to set m to a small value in order to reduce the complexity of their implementations when ana-lyzing the M representatives. They had a complexity objec-tive. In contrast, indexing these representatives to quickly retrieve k of them allows us to set m such that it is possible to meet a quality objective. At last, this better quality yields a more reliable ranking of the candidates. The true match-ing features are ranked higher. This allows us to reduce the size R of the shortlist and to decrease the complexity of the final verification step.
3.3
Summary
We argue that it is possible to scale group testing high-dimensional approaches provided that these lessons learnt from [10,18] are enforced and the two requirements pre-sented above are addressed. We therefore implemented within the sGT algorithm a group construction strategy based on k-d tree to marry fixed size groups and some similarity be-tween the vectors of each group. sGT also includes the
im-plementation of the indexing of the representative vectors to quickly identify the k best representatives. This, in turn, al-lows to increment the redundancy of vectors in groups (m), improving quality. The candidate vectors being more accu-rate, it allows to decrease the length of the candidate list R, which saves response time.
The next section demonstrates that these extensions in-deed make group testing approaches easier to scale to larger collections of very high-dimensional vectors.
4.
EXPERIMENTS
This section basically compares the behavior of three high-dimensional indexing schemes. Two of them are state-of-the-art: the first technique is the traditional k-d tree based index from the FLANN library [14]. The second technique is our own implementation of the original group testing scheme proposed by Shi et al. [18]. The third technique is sGT which includes the various extensions discussed in the previ-ous section aiming at better handling large scale collections. We first describe our experimental setup before moving to the experiments themselves where the comparison of the behavior of the three techniques is made using the mean average precision and running time indicators.
4.1
Experimental Setup
We use a public large-scale image retrieval benchmark dataset known as Holidays+Flickr1M for our experiments. This dataset is the combination of the original Holidays image dataset [11] with 1 million distractor images from Flickr1M [16]. The dataset contains N =1,001,491 images in total. The image retrieval quality is evaluated with the pro-vided ground-truth for 500 queries and measured by mean average precision (mAP).
To facilitate the direct comparison with existing meth-ods [10,18], we use the same T-embedding features [12] with d = 1,920 which corresponds to a codebook vocabulary of size 16. These features are made available online.1
Fol-lowing the pipeline presented in the original paper [12], we post-process these features with power-law normalization, setting α = 0.5.
4.2
Image Features are Hardly Indexable
We first show that the T-embedding features extracted from the images can hardly be indexed due to their di-mensionality. This motivates the need for alternative high-dimensional indexing schemes such as group testing based approaches better coping with the curse of dimensionality.
We started by using the linear search option of FLANN in order to determine the quality and the time it takes when using the 500 queries. It takes 901 seconds to run the entire query set, and the resulting mAP is equal to 51.9. These values form the baseline we will refer to in the remainder of this paper.
We then ask FLANN to determine what would be the best high-dimensional strategy in order to index the image fea-tures. We therefore set the FLANNParameters internal data structure to AUTOTUNED with a target precision set to 0.95. The resulting index determined by FLANN is a k-d tree. It takes 677 seconds to probe the index with the 500 queries. Using the index instead of relying on the linear scan is only
1http://people.rennes.inria.fr/Ahmet.Iscen/
���� ���� ���� ���� ���� ���� ���� ���� ���� ��� ��� ��� ��� ��� ��� ��� ���� �� � ���������������������� ������������������������������������������������� ������������������������������
Figure 1: Observed mAP after PCA applied to the T-embeddings image features. Varying number of retained dimensions.
1.29 times faster. This little speedup is explained by the very large number of checks FLANN has to perform in order to meet the required precision. Observing the logs produced by FLANN shows that close to 450,000 checks are done for each query – so half of the features are indeed scanned, mak-ing the indexmak-ing useless as it can not confine the search to a small portion of the database. This is a direct consequence of the high-dimensionality of the indexed features.
The T-embedding features are indeed of a very large di-mensionality. Their representational dimension is 1,920 while their local intrinsic dimensionality (see [1]) is estimated to be 150.3±41.3. This is a very high value, which emphasizes the negative consequences of the curse of dimensionality. Please note that FLANN proved to work with descriptors having a much smaller intrinsic dimensionality. For example, SIFT has a representational dimension equal to 128 while its es-timated local intrinsic dimensionality is 12.3 ± 3.0 (again, see [1], Section 6.3). Their indexing is thus much easier.
One obvious approach to circumvent this dimensionality problem is to apply a dimension reduction technique to the features with the hope not to degrade too severely the result-ing mAP. We therefore took our collection of image features, applied a PCA and kept a varying number of the most sig-nificant resulting dimensions. We then ran the (PCA-ed) queries against that transformed collection and computed the resulting mAP when using a linear scan. Figure1plots the outcome of this experiment. The figure shows that the mAP rapidly decreases when reducing the number of di-mensions for the transformed features. While such trans-formed features might be more indexable, the resulting qual-ity would be too low to have any practical interest. Using a linear scan is not an option either as it is too slow.
Most modern image features (VLAD, CNN-based features, etc.) share with the T-embeddings this property of lying in truly high-dimensional spaces. They can therefore hardly be indexed using traditional approaches. The following ex-periments demonstrate that group testing strategies better handle dimensionality.
4.3
Even-Size Groups of Similar Vectors
The lessons learnt from studying the literature suggest that creating even-size groups of similar vectors is best for group testing approaches. We proposed in Section 3.1 to take control of the random k-d tree creation process to this
���� ���� ���� ���� ���� ���� ���� ���� ����� ����� ����� ����� ����� ����� ����� ����� ����� ����� �� � ������� ���� ���� ��� ��� ��� ���
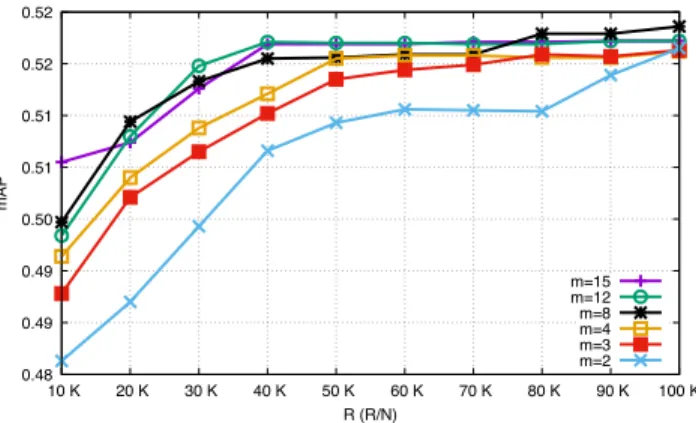
Figure 2: Search quality with different m and R. Percentages in parenthesis give R/N .
aim. The experiment described now shows this indeed works as the resulting performances are better. The competitive group testing method we compare against is [18]. Its group construction uses a fully random assignment procedure to create even-size groups. This experiment uses a similar set-ting as the one defined in [18], i.e., n = 15, m = 2, and R=M =133,532.
The mAP when using the pure random group creation technique is 50.8. In contrast, the mAP we observe when taking control of the k-d tree reaches 51.6. Forming groups according to some similarity (even quite weak as we utilize higher levels of the k-d tree) improves quality, which is how-ever slightly below the baseline (mAP=51.9).
4.4
Redundancy for Better Candidate Vectors
When discussing the design options to scale group testing, we highlighted the necessity to decrease the number of true similarity computations between the query and the candi-date features. This is requirement R2. We also claimed this goal could be achieved by increasing the redundancy of features in groups, i.e., increasing the value for m. The ex-periments discussed now are evaluating the mAP for sGT, varying the values of m and R.
The resulting experiments, illustrated by the Figure 2, show the mAP achieved by sGT when m goes from 2 (low redundancy) to 15 (high redundancy) as well as when R goes from 10,000 (small value, 1% of the database) to 100,000 (large value, 10% of the database, same settings as in [18]). It can be observed that for a fixed value for R, a better mAP is reached if m is larger. In other words, it is worth increasing m which reduces R for a fixed mAP.
However, increasing m also increases M (see eq. (1)), the total number of groups. This has a direct impact on the costs of equations (3) and (4). It is possible to keep these costs under control thanks to the indexing of the group rep-resentatives, as demonstrated by the next experiment.
4.5
Indexing Group Representatives
Indexing the vectors that represent the groups is a way to meet the requirement R1 defined above. It is indeed quite straightforward. We used the same settings as above, with m = 3. We then give the collection of vector rep-resentatives to FLANN instructed to automatically deter-mine the best index thanks to its AUTOTUNE setting. When
��� ��� ���� ���� ���� ���� ���� ���� �� �� �� �� �� �� �� �� ��� ������� ������������� � � ��������������������� ����������������������������������
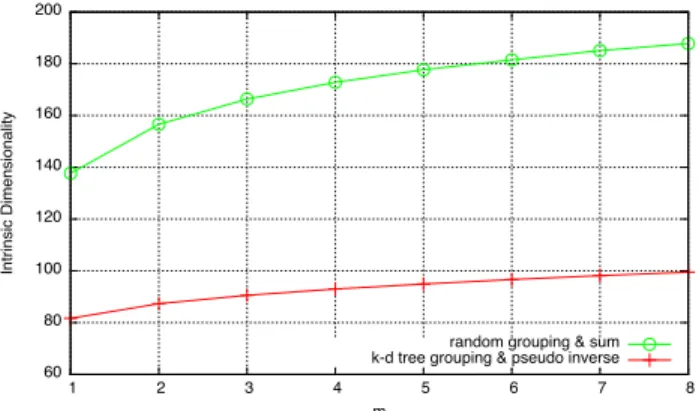
Figure 3: Intrinsic dimensionality varyingm. Ran-dom and sum vs. k-d tree and pseudo-inverse group creation methods.
m = 3, there are 200,298 representatives corresponding to as many groups created with the taking control of the k-d tree process. FLANN fink-ds that it is best to ink-dex that collection using a k-d tree which will provide a speed up of 39.26 compared to the linear scanning of all the repre-sentatives. Higher settings of m confirm significant speed up gains: FLANN estimates the speed up to be equal to 82.96 when m = 4 and 74.67 when m = 8. The scalability objective linked to R1 is therefore achieved.
It is interesting to try to index group representatives when they result from the random construction process. Asking FLANN to determine the best index when fed with such 200,298 representatives fails: the library estimates that it is the linear scan that is the most competitive method when trying to identify the best representatives. Digging into the logs of FLANN shows that it is again the dimensionality of the group representatives which can explain this remarkable difference in behavior. While both k-d tree based tatives and random representatives have the same represen-tational dimensionality (i.e. d =1,920), they have however a quite different intrinsic dimensionality.
With m = 3, k-d tree based group representatives have an estimated local intrinsic dimensionality of 90.6 ± 29.5 while random based group representatives have an intrinsic dimensionality of 166.4 ± 13.5. It is therefore much harder to index random based group vectors, and resorting on the linear scan is possibly the best strategy.
Indeed, blending randomly the features increases the en-tropy, explaining why the resulting intrinsic dimensionality is even higher than the one of the raw features. Such random group vectors are distributed all over the high-dimensional space, making it quite hard to distinguish the near neighbors from the most distant ones, as clearly stated in the seminal paper about neighbor meaningfulness [4]. Similar observa-tions can be made for other values of m, as it is reported in Figure3.
4.6
Overall Performance: Comparing
Qual-ity and Run Time
The last experiment compares the overall performance of sGT with (i) the performance of the k-d tree created by FLANN over all of the image features, as described in Section4.2and (ii) with the state-of-the-art group testing scheme by Shi et al. [18].
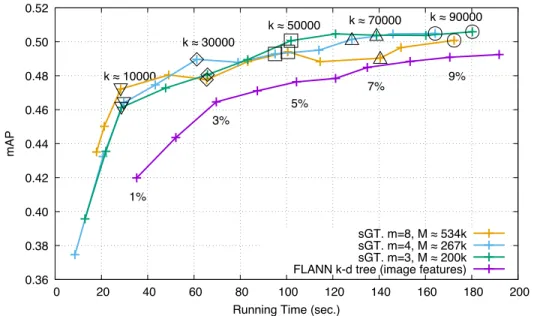
To measure the performance of the k-d tree of FLANN, we ask the library to return the top 1%, 2%, . . . , 10% im-age features that are the most similar to the queries. This obviously impacts the response time as well as the resulting mAP. This is depicted by Figure 4where a line that gives the performance of the FLANN index is plotted. This line shows that when an increasing number of features are con-sidered, then the response time increases as does the mAP, as expected. It is possible to know the percentages of the most similar features that are considered at query time as it is specified along the line. For clarity, not all such percent-ages are indicated; the missing ones can easily be deduced.
The other series of lines display the performance of sGT. The parameter of utmost importance in this strategy is the redundancy, m, which we vary here. We therefore created 3 configurations of the groups for three specific values of that m parameter that are m = 3, m = 4 and m = 8. The Figure4therefore contains three other lines, each depicting the behavior of one group testing configuration for sGT.
To better understand the behavior of sGT, we have changed for each configuration the number of representatives that are identified to subsequently evaluate equations (3) and (4). One of the claims we make in this paper is that indexing the representatives is beneficial to performance because re-turning a particular number of them (k) among a total of M existing representatives is mostly independent of that M value while it boosts performance. We therefore instructed sGT to return the best k group representatives (with k rang-ing from 2,560 to 90,000) before identifyrang-ing the R =50,000 best image features. We visualise along the sGT lines in Fig-ure4some of these values for k. We explicitly give few such values to preserve the clarity of this figure. For example, the response times and the corresponding mAP obtained with the three configurations of sGT when k ≈10,000 are all three represented on the lines using a triangle pointing downward symbol. Similarly, the operating points are represented with the square symbol for k ≈50,000.
Using these symbols facilitates observing that indeed, the response times of sGT is mostly independent of M (which increases as m grows). When m = 3, then there are over-all M =200,298 group vector representatives, while there are M =534,128 when m = 8. Despite these different val-ues for M , retrieving the same number k of representatives takes roughly the same amount of time, between 160 and 180 seconds when k ≈90,000, see the circles on the figure. Furthermore, the order of these three circles on the time-line is not ruled by m, materializing the independence between M and the response time.
This figure also shows that the mAP improves as m in-creases, while the response time stays quasi identical thanks to having indexed the group representatives.
Finally, it is interesting to compare the response times and the mAP that Shi et al. [18] could achieve using the same parameters. Table 1 compares three configurations of the original group testing technique (based on random grouping and the use of the sum (2) to compute the repre-sentatives) to the same three configurations for sGT that we have described. Please note, however, that [18] uses all M representatives when evaluating equations (3) and (4) while we use only the k ≈90,000 best ones. The table shows that sGT is much faster than the original group testing proposal, while the quality does not differ significantly.
���� ���� ���� ���� ���� ���� ���� ���� ���� �� ��� ��� ��� ��� ���� ���� ���� ���� ���� ���� �� �� �� �� �� ��������� ��������� ��������� ��������� ��������� �� � ������������������� ������������������ ������������������ ������������������ �������������������������������
Figure 4: Response Times vs. mAP. FLANN k-d tree, several configuration for sGT.
m=3 m=4 m=8
Time (s) mAP Time (s) mAP Time (s) mAP
Random G.T. [18] 187 0.507 252 0.512 483 0.518
sGT [this paper] 180 0.505 164 0.504 172 0.500
Table 1: Comparing the search time of different group construction methods for group testing.
5.
CONCLUSION
Drawing the lessons from the pioneer applications of group testing to similarity search [10,18], we first propose a group-ing strategy based on kd-trees. This ensures groups of even sizes comprising weakly similar features. An important byprod-uct of this approach is that the resulting representative vec-tors have small intrinsic dimensionality compared to the raw dataset features. This allows us to integrate an ANN search algorithm, such as FLANN, into the group testing frame-work. This is the keystone for freeing the total number of groups. We seize this opportunity to increase this number to compute more reliable scores. This in turn gives birth to a shorter list of candidates for the verification step. The overall construction improves the scalability of group testing similarity search while maintaining high search quality.
6.
REFERENCES
[1] L. Amsaleg, O. Chelly, T. Furon, S. Girard, M. E. Houle, K. Kawarabayashi, and M. Nett. Estimating local intrinsic dimensionality. In Proceedings of the 21th ACM SIGKDD International Conference on Knowledge Discovery and Data Mining, pages 29–38. ACM, 2015.
[2] R. Arandjelovic and A. Zisserman. All about VLAD. In Proceedings of the IEEE Conference on Computer Vision and Pattern Recognition, June 2013.
[3] A. Babenko, A. Slesarev, A. Chigorin, and V. Lempitsky. Neural codes for image retrieval. In Proceedings of the European Conference on Computer Vision, 2014.
[4] K. Beyer, J. Goldstein, R. Ramakrishnan, and U. Shaft. When is nearest neighbor meaningful? In
Proceedings of the International Conference on Database Theory, pages 217–235, August 1999. [5] M. Datar, N. Immorlica, P. Indyk, and V. Mirrokni.
Locality-sensitive hashing scheme based on p-stable distributions. In Proceedings of the Symposium on Computational Geometry, 2004.
[6] J. H. Friedman, J. L. Bentley, and R. A. Finkel. An algorithm for finding best matches in logarithmic expected time. ACM Transaction on Mathematical Software, 3(3):209–226, 1977.
[7] A. Gionis, P. Indyk, and R. Motwani. Similarity search in high dimension via hashing. In Proceedings of the International Conference on Very Large DataBases, pages 518–529, 1999.
[8] Y. Gong, L. Wang, R. Guo, and S. Lazebnik. Multi-scale orderless pooling of deep convolutional activation features. In Proceedings of the European Conference on Computer Vision, 2014.
[9] P. Indyk and R. Motwani. Approximate nearest neighbors: towards removing the curse of
dimensionality. In Proceedings of the ACM symposium on Theory of computing, pages 604–613, 1998. [10] A. Iscen, T. Furon, V. Gripon, M. Rabbat, and
H. J´egou. Memory vectors for similarity search in high-dimensional spaces. arXiv, 2014.
[11] H. J´egou, M. Douze, and C. Schmid. Hamming embedding and weak geometric consistency for large scale image search. In Proceedings of the European Conference on Computer Vision, October 2008. [12] H. J´egou and A. Zisserman. Triangulation embedding
Proceedings of the IEEE Conference on Computer Vision and Pattern Recognition, June 2014. [13] Q. Lv, W. Josephson, Z. Wang, M. Charikar, and
K. Li. Multi-probe LSH: Efficient indexing for high-dimensional similarity search. In Proceedings of the International Conference on Very Large
DataBases, pages 950–961, 2007.
[14] M. Muja and D. G. Lowe. Scalable nearest neighbor algorithms for high dimensional data. IEEE Transactions on Pattern Analysis and Machine Intelligence, 36, 2014.
[15] F. Perronnin and C. R. Dance. Fisher kernels on visual vocabularies for image categorization. In Proceedings of the IEEE Conference on Computer Vision and Pattern Recognition, June 2007. [16] J. Philbin, O. Chum, M. Isard, J. Sivic, and
A. Zisserman. Object retrieval with large vocabularies
and fast spatial matching. In Proceedings of the IEEE Conference on Computer Vision and Pattern
Recognition, June 2007.
[17] C. R. Rao and S. K. Mitra. Generalized inverse of a matrix and its applications. In Proceedings of the Sixth Berkeley Symposium on Mathematical Statistics and Probability, Volume 1: Theory of Statistics, 1972. [18] M. Shi, T. Furon, and H. J´egou. A group testing
framework for similarity search in high-dimensional spaces. In ACM International conference on Multimedia, November 2014.
[19] R. Weber, H.-J. Schek, and S. Blott. A quantitative analysis and performance study for similarity-search methods in high-dimensional spaces. In Proceedings of the International Conference on Very Large