HAL Id: hal-02538458
https://hal.archives-ouvertes.fr/hal-02538458
Submitted on 9 Apr 2020
HAL is a multi-disciplinary open access
archive for the deposit and dissemination of
sci-entific research documents, whether they are
pub-lished or not. The documents may come from
teaching and research institutions in France or
abroad, or from public or private research centers.
L’archive ouverte pluridisciplinaire HAL, est
destinée au dépôt et à la diffusion de documents
scientifiques de niveau recherche, publiés ou non,
émanant des établissements d’enseignement et de
recherche français ou étrangers, des laboratoires
publics ou privés.
Fusion of Magnetic Resonance and Ultrasound Images
for Endometriosis Detection
Oumaima El Mansouri, Fabien Vidal, Adrian Basarab, Pierre Payoux, Denis
Kouamé, Jean-Yves Tourneret
To cite this version:
Oumaima El Mansouri, Fabien Vidal, Adrian Basarab, Pierre Payoux, Denis Kouamé, et al..
Fu-sion of Magnetic Resonance and Ultrasound Images for Endometriosis Detection. IEEE
Transac-tions on Image Processing, Institute of Electrical and Electronics Engineers, 2020, 29, pp.5324-5335.
�10.1109/TIP.2020.2975977�. �hal-02538458�
OATAO is an open access repository that collects the work of Toulouse
researchers and makes it freely available over the web where possible
Any correspondence concerning this service should be sent
to the repository administrator:
tech-oatao@listes-diff.inp-toulouse.fr
This is an author’s version published in: https://oatao.univ-toulouse.fr/25861
To cite this version:
El Mansouri, Oumaima and Vidal, Fabien and Basarab, Adrian and
Payoux, Pierre and Kouamé, Denis and Tourneret, Jean-Yves
Fusion of Magnetic Resonance and Ultrasound Images for
Endometriosis Detection. (2020) IEEE Transactions on Image
Processing, 29. 5324-5335. ISSN 1057-7149
Fusion of Magnetic Resonance and Ultrasound
Images for Endometriosis Detection
Oumaima El Mansouri , Student Member, IEEE, Fabien Vidal, Adrian Basarab , Senior Member, IEEE, Pierre Payoux, Denis Kouamé, Senior Member, IEEE, and Jean-Yves Tourneret , Fellow, IEEE
Abstract— This paper introduces a new fusion method for magnetic resonance (MR) and ultrasound (US) images, which aims at combining the advantages of each modality, i.e., good contrast and signal to noise ratio for the MR image and good spatial resolution for the US image. The proposed algorithm is on an inverse problem, performing a super-resolution of the MR image and a denoising of the US image. A polynomial function is introduced to model the relationships between the gray levels of the MR and US images. The resulting inverse problem is solved using a proximal alternating linearized minimization algorithm. The accuracy and the interest of the fusion algorithm are shown quantitatively and qualitatively via evaluations on synthetic and experimental phantom data.
Index Terms— Image fusion, magnetic resonance imaging, ultrasound imaging, super-resolution, despeckling, proximal alternating linearized minimization.
I. INTRODUCTION
I
MAGE fusion can be defined as gathering all the important information from multiple images, and including them into a fewer number of images, e.g., into one single image. This single image is usually more informative than the images before fusion and contains all the necessary information for the application of interest [1]. Fusion of medical images is becoming very common for the study of a given pathology, and generally allows for a better medical decision in clini-cal studies. This problem requires to solve several techniclini-cal challenges because of the limitations imposed by specific imaging modalities. A large and growing body of literature has investigated techniques addressing these challenges [2], [3]. Morphological operators have been extensively considered to detect reliable spatial information in order to fuse two different modalities such as magnetic resonance (MR) and computedManuscript received May 28, 2019; revised January 6, 2020; accepted February 6, 2020. Date of publication February 28, 2020; date of current version April 2, 2020. The associate editor coordinating the review of this manuscript and approving it for publication was Prof. Abdesselam S. Bouzerdoum. (Corresponding author: Oumaima El Mansouri.)
Oumaima El Mansouri and Jean -Yves Tourneret are with the IRIT/INP-ENSEEIHT/TéSA, University of Toulouse, 31071 Toulouse, France (e-mail:oumaima.el-mansouri@irit.fr; jean-yves.tourneret@irit.fr).
Fabien Vidal is with CHU Toulouse, Obstetrics Gynecology Depart-ment, Paule de Viguier Hospital, F-31059 Toulouse, France (e-mail: fabien.vidal@irit.fr).
Adrian Basarab and Denis Kouamé are with the IRIT, University of Toulouse, CNRS UMR 5505, F-31062 Toulouse, France (e-mail: adrian.basarab@irit.fr; denis.kouame@irit.fr).
Pierre Payoux is with University Hospital, UMR 1214, 35000 Toulouse, France (e-mail: pierre.payoux@inserm.fr).
Digital Object Identifier 10.1109/TIP.2020.2975977
tomography (CT) [4]. More specifically, operators based on averaging [5], K-L transforms and morphological pyramids such as the Laplacian pyramid decomposition [6] have been used successfully for image fusion. These methods are known to be sensitive to the inter-image variability resulting from outliers, to noise and to the size and shape of the features extracted from the different images [2]. Wavelet-based meth-ods have also been considered for medical image fusion. These methods extract image details from the high frequency com-ponents of one image and add them to the other images [7]. Another fusion method is based on neural networks, which are able to learn appropriate features from a training dataset [8]. The accuracy of the fused images strongly depends on the quality of the training data, which can be a problem in some applications. Some appropriate mathematical transforms have also been combined to probabilistic approaches, to provide efficient image fusion methods, e.g., for the fusion of gam-magraphy and ultrasound (US) images [9]. Overall, there is a large number of techniques that have been investigated for the fusion of medical images with their own limitations depending on the considered imaging modalities. However, to the best of our knowledge, the fusion of magnetic resonance (MR) and US images has rarely been considered in the literature, which is precisely the aim of this paper.
MR and US are two different imaging modalities having their own advantages and drawbacks. MR images provide a wide field of view of patients’ anatomy with a good signal to noise ratio but with a relatively low spatial resolution. As a consequence, precise anatomic landmarks at the millimetric scale can be under-evaluated. In contrast, US imaging presents a low signal to noise ratio and a reduced field of view but provides enhanced anatomic details due to its better spatial resolution (especially when high frequency probes are used). The complementary properties of MR and US images motivate the interest of fusing these modalities, specifically for morpho-logical workup in several diseases such as endometriosis.
Endometriosis is a typical example of pathology that requires the use of MR and US modalities in conventional clinical practice. This benignant disease is defined as the pres-ence of endometrial glands or stroma in sites different from the uterine cavity. It typically affects women in their reproductive age and is associated with chronic pelvic pain and infertility. Endometriotic lesions can be either superficial or deeply infiltrating. Surgery is a cornerstone for endometriosis since disease removal positively impacts quality of life and
fertility [10]. First line radiological workup uses MR and pelvic US imaging. MRI displays a higher sensitivity for endometriosis diagnosis compared to pelvic US (0.94 versus 0.79) [11]. In contrast, pelvic US with transvaginal or transrec-tal route provides a better specificity (0.94 versus 0.77) and is more accurate in the evaluation of infiltration depth when compared to MRI. Considering the benignant nature of the disease and its high recurrence rate, conservative management treatment involving limited invasive measurements is prefer-able to surgery whenever feasible [12]. In the setting of deep infiltrating endometriosis, fusing the two imaging techniques thus appears particularly promising. Indeed, the presence of information coming from both US and MR modalities in a single image is expected to improve preoperative disease mapping and subsequent definition of surgical modalities.
This paper studies a new fusion method for MR and US images, based on two image formation models gathering the advantages and drawbacks of each modality. More precisely, the MR image formation model accounts for the low spatial resolution of the observed image using a standard linear model with blurring and downsampling operators. The US image formation model takes into consideration the high amount of speckle noise, which is assumed to be Rayleigh-distributed as in many works including [13]–[15]. Given the different physical phenomena involved in each imaging modality, we propose to model the correspondence between gray levels of MR and US images using a polynomial function. This polynomial model can be theoretically motivated by the Weier-strass approximation theorem, which states that any continuous function on a closed and bounded interval can be uniformly approximated on that interval by polynomials with any degree of accuracy [16]. A more practical reason for using this kind of relationship between MR and US images is its successfull application to MR and US image registration [17]. The non-linear cost function considered to solve the fusion problem is constructed using the observation models associated with the MR and US images and the polynomial transformation relating the two images. Its minimization is challenging and is handled by a proximal alternating linearized minimization (PALM) algorithm. The proposed image fusion method is evaluated on simulated data with available ground truth, and on experimental data acquired on a phantom with imaging characteristics close to endometriosis. Both qualitative and quantitative results show the interest of fusing MR and US images, compared to restoring independently the images with each modality.
The remainder of the paper is organized as follows. Section 2 introduces the statistical models for MR and US image fusion including a non-linear relation between the two modalities. Section 3 details the different steps of the proposed MR/US image fusion algorithm. Results on simulated data and on an experimental phantom are presented in Sections 4 and 5. Conclusions and perspectives are reported in Section 6.
II. A STATISTICALMODEL FOR THEFUSION OFMRANDUS IMAGES
The image fusion model introduced in this section assumes that the MR and US images to be fused are aligned, i.e., there
is no geometric distortion between them, which can be obtained after an appropriate pre-registration. Thus, the regis-tration potentially required in practical applications (see, e.g., [18]–[21]) is considered herein as a pre-processing step and the possible registration errors are ignored hereafter. Note that despite this hypothesis, the fusion task is still challenging because the two imaging modalities have different resolutions and contrasts and are corrupted by different kinds of noise.
A. Observation Models
In several clinical applications including gynecology (con-sidered in this study), MRI has the advantage of acquiring images with a large field of view, at the expense of a relatively low spatial resolution, of the order of 1 mm. In contrast to MRI, depending on the choice of the probe’s central frequency, US imaging can offer well-resolved images. However, US images are contaminated by a high level of speckle noise and have a reduced field of view. Based on these observations, many existing works aimed at improving independently the quality of MR and US images. In the case of MRI, the loss of resolution is classically modelled by a downsampling oper-ation and a low pass filter [22]. In US imaging, speckle noise is usually considered as additive when considering the compressed envelope mode (also called B-mode) with a log-Rayleigh distribution [23], [24]. This paper assumes that the US noise sequence is independent and identically distributed (i.i.d) as in [25], [26]. Note that modelling the spatial corre-lation of noise samples would increase the complexity of the fusion method and is left for future work. These observations lead to the following image formation models
ym = SCxm+ nm
yu = xu+ nu (1)
where xm ∈ RN is the non-observable high-resolution
vec-torized MR image, ym ∈ RM is the observed low-resolution
vectorized MR image and nm∈ RN is the i.i.d. noise vector
corrupting the MR image, assumed to be Gaussian as in [27]. Note that C ∈ RN×N is a block circulant with circulant
blocks matrix modelling the blurring effect of the MRI by a point spread function (PSF) and that S ∈ RM×N (with
N = s2M) is a decimation operator with a decimation factor
s. On the other hand, yu ∈ RN is the observed vectorized
B-mode US image, xu ∈ RN is the noise-free vectorized
US image and nu ∈ RN is an i.i.d. additive log-Rayleigh
noise with localization parameter γ . Note that the speckle noise affecting US images is mainly caused by diffusion, i.e., by the constructive and destructive interferences between echoes originated by small (with respect to the US wavelength) point targets called scatterers. Note also that all the vectors in (1) are obtained from the corresponding images using the lexicographical order. Finally, we assume that xmand xuhave
the same spatial sampling, which can be obtained in practical applications by adjusting the decimation factor d in the MRI model, so that pixels in the super-resolved MR and US images have the same size.
B. Relation Between US and MR Images
MR and US imaging systems exploit different physical phenomena. Consequently, when imaging the same tissues, even in the virtual case of a perfect acquisition (without noise) allowing xm and xu to be directly observable, these
two systems would not provide the same measurements. Thus, images xmand xuin (1) are not equal, even if they correspond
to the same tissue. For solving the fusion task, we propose to link these two images by a parametric model. More precisely, we adopt the model originally proposed in [17] for MR/US image registration. This model is motivated by the fact that US image formation is essentially based on the gradient of the acoustic impedance between neighbouring tissues and is thus able to highlight the interfaces between anatomical structures. For US imaging, US waves (short pulses) are transmitted by the transducer, propagate through the tissues, and return to the transducer as reflected echoes. The reflected echoes correspond to US wave reflection at the interfaces between tissues with different acoustic impedances. Thus, the most important features in US images correspond to regions with gradient of impedance. The noise-free US envelope image (after amplitude demodulation of beamformed RF signals) can thus be expressed as
au= ∇ ZHu (2)
where au is the speckle-free US envelope image, Z is the
acoustic impedance map, u is the scan direction,H stands for
Hermitian transpose and ∇ is the discrete gradient operator. The B-mode or log envelop of au, denoted by xu in (1) is
xu= b log[∇ ZHu] + g (3)
where b and g are linear gains.
Exploiting the previous US image model, relating US and MR pixel amplitudes turns out to finding a relationship between the MRI amplitude and the acoustic impedance Z, denoted by φ such that
Z = φ[xm]. (4)
Computing the gradient of (4) leads to
∇ Z = φ′[xm]∇xm (5)
where φ′ is the derivative of the unknown function φ. By
plugging (5) into (3), the following relation between the US and MR images is obtained
xu= b log
!
φ′(xm)∇xmHu
"
+ g (6)
where b and g are constant. Note that the amplitude of one pixel in xu not only depends on the value of its counterpart
in xm, but also on the gradient of the MR image. To simplify
the notations, this functional mapping between the US and MR images is defined as
xu= f (xm,∇xmHu) (7)
where f : RN × RN → RN is an unknown function and ∇xH
mu ∈ RN contains in its ith line the inner product between
the ith local gradient xmand the US scan direction u.
The unknown function f in (7) is approximated in this study by a polynomial (as in [17]) such that
xu,i = #
p+q≤d
cpqxm,ip (∇xmHu)qi (8)
where cpq are the unknown polynomial coefficients, index i
stands for the ith coefficient of a vector and d is the degree of the polynomial function.
C. A Bayesian Approach for MR and US Image Fusion
Using the relationship between MR and US images in (7), the image formation models in (1) can be rewritten as
ym= SCx + nm
yu= f (x, ∇xHu) + nu (9)
where x ∈ RN is the unknown image to be estimated,
containing relevant information from both MR and US data. The conditional distributions of ymand yucan be determined
using the noise distributions
ym|x ∼ N (SCx, σm2IN)
yu|x ∼ LR(γ ) (10)
where N (µ, !) denotes the normal distribution with mean vector µ and covariance matrix !, and LR(γ ) is the log-Rayleigh distribution with parameter γ1. Using Bayes rule
and the independence between the noise vectors nm and nu,
the posterior distribution of x can be computed
p(x| ym, yu)∝ p( ym|x)p( yu|x)p(x) (11)
where p(x) is the prior probability distribution of x and ∝ means “proportional to”. Finally, the log-posterior distribution can be written as
− log p(x| ym, yu)= K +1
2 ∥ym− SCx∥
2
$ %& '
MRI data fidelity
+ log [p(x)]$ %& ' regularization + N # i=1 !
exp(yu,i− fi(x,∇xHu)) − γ (yu,i− fi(x,∇xHu))
"
$ %& '
US data fidelity
(12) where yu,i and fi(x,∇xHu) are the ith components of yu
and f (x,∇xHu) and K is a constant.
Different prior distributions p(x) have been considered in the literature to solve ill-posed problems. In this study, we pro-pose to use the classical total variation (TV) promoting piece-wise constant fused images. Estimating x in the sense of the maximum a posteriori principle using this TV regularization
1The probability density function (pdf) of a variable distributed
accord-ing to a log-Rayleigh distribution denoted as z ∼ LR(γ ) is p(z) =
(ez)2 γ exp ( −(ez)2 2γ )
leads to the following minimization problem ˆx = argmin x 1 2 ∥ym− SCx∥ 2+ τ 1∥∇x∥2 +τ3∥∇ f (x, ∇xHu)∥2+τ2 N # i=1 !
exp(yu,i− fi(x,∇xHu))
−γ (yu,i− fi(x,∇xHu))
"
(13) where τ1, τ3and τ2are hyperparameters balancing the weights
of the data fidelity and TV regularization terms. Note that the cost function in (13) depends on the polynomial parameters
cpq relating US and MR pixel amplitudes, that need to be
estimated before solving (13).
III. ALGORITHM FORMR/US FUSION
This section studies an optimization algorithm dedicated to solve (13). The presence of the non-linear polynomial function f in (13) prevents the use of algorithms based on the alternate direction method of multipliers (ADMM) [28]. Consequently, we propose hereafter an algorithm based on the proximal alternating linearized minimization (PALM), adapted to nonconvex and nonsmooth functions [29].
A. Summary of PALM
The PALM algorithm was originally designed to minimize functions of two vectors x and v that can be decomposed as
min
x,v ψ(x, v):= l(x) + g(v) + H (x, v) (14)
where l and g are continuous convex functions and H may be non-linear. Moreover, these three functions must respect the following conditions to fit the PALM framework [29]
1) l and g are inf-bounded *infRN*f+ > −∞ and
infRN*g+>−∞+.
2) For any fixed v the function x,→ H (x, v) is C1,1, and
the partial gradient∇xH (x, v) is globally Lipschitz.
3) For any fixed x the function v,→ H (x, v) is C1,1, and
the partial gradient∇vH (x, v) is globally Lipschitz.
4) ∇ H is Lipschitz continuous on bounded subsets of the image domain.
PALM can be viewed as a minimization of the sum of the two functions l and g with a linearization of H around a given point xk. The alternate minimization with respect to the
two blocks x and v proposed in [29] generates a sequence {(xk, vk)}
k∈N using the following steps
Step 1: Choose γ1> 1, set ck = γ1 Lx(vk) and update xk
as follows xk+1 = proxlck , xk−c1 k∇xH (x k, vk) -= argmin x (x− x k)H∇ xH (xk, vk)+c2 ∥k x − xk∥2+l(x)
where Lx(vk) is the Lipschitz constant of x ,→ ∇xH (x, vk)
and vk is the value of v at iteration #k.
Step 2 : Choose γ2> 1, set dk = γ2 Lv(xk) and update
vk as folllows vk+1 = proxgd k , vk− 1 dk∇vH (x k, vk) -= argmin v (v− vk)H∇vH (xk, vk)+ dk 2 ∥v− v k∥2+ g(v)
where Lv(xk) is the Lipschitz constant of v ,→ ∇vH (xk, v)
and xk is the value of x at iteration #k.
Note that this iterative scheme requires to compute the Lipschitz constants Lx(vk) and Lv(xk).
B. Proposed PALM Algorithm for MR/US Image Fusion
In order to respect the constraints mentioned above and to adapt our image fusion minimization problem to the PALM framework, we propose the following parametrization
l(x)= 12 ∥ym− SCx∥22+ τ1∥∇x∥2 (15)
g(v)= τ2
#
i
[exp(yu,i− vi)−γ (yu,i−vi)]+τ3∥∇v∥2 (16)
H (x, v)= τ4 N # i=1 . vi − # p+q≤3 cpqxip(∇xHu)qi / (17) where v= f (x, ∇xHu).
Remark 1: With this choice of functions l, g and h, the four assumptions stated previously are satisfied, as explained here-after.
1) Assumption 1 ensures that the PALM algorithm is well defined, which can be easily verified in our case. 2) Assumptions 2 and 3: Since x,→ ∇xH (x, v) and v,→
∇vH (x, v) are polynomial functions, they are globally
Lipschitz and their domains are bounded.
3) Since H is C2, Assumption 4 is satisfied as a
conse-quence of the mean value theorem.
More details about the implementation of the PALM algorithm for the proposed fusion of MRI and US images are provided in Appendix A.
C. Estimation of the Polynomial Function f
For a given order d, the unknown polynomial function f relating xm to xu is defined by Nd = (d + 1)(d + 2)/2
coefficients gathered in the vector cd = {cpq | p + q ≤ d}.
To estimate these coefficients, we assume that the observed MR and US images are related as follows
yu,i = #
p+q≤3
cpqym,ip (∇ ymHu)qi + ϵi i= 1, . . . , N
or equivalently, in algebraic form
yu= Amcd+ ϵ (18)
where Am ∈ RN×Nd is a matrix whose elements are
Fig. 1. US and MRI fusion: (a) True high resolution MR image, (b) Simulated US image using a polynomial function applied to the MR image (a), (c) MR low-resolution and blurred image, (d) noisy US image, (e) high resolution MR image estimated using the fast super resolution algorithm of [30], (f) despeckled US image using TV regularization, (g) fused image obtained with Algo 1.
The least-squares estimator of cd(which is also the maximum
likelihood estimator for i.i.d. Gaussian errors ϵi) is defined
by ˆcd = A†myu, where A†m = (AmTAm)−1ATm is the
pseudo-inverse of the matrix Am. This estimator will be used to
estimate the coefficients of the polynomial function f in our experiments.
IV. SIMULATIONRESULTS
A. Simulation Setup
This section demonstrates the efficiency of the proposed MRI/US fusion method using two sets of synthetic images with controlled ground truth. The observed MR images were
Fig. 2. US and MRI fusion: (a) True high resolution MR image, (b) Simulated US image using a polynomial function applied to the MR image in (a), (c) MR low-resolution and blurred image, (d) noisy US image, (e) high reso-lution MR image estimated using the fast super resoreso-lution algorithm in [30], (f) despeckled US image using TV regularization, (g) fused image obtained with Algo 1.
generated from the high resolution MR images displayed in Figs. 1(a) and 2(a), after blurring, decimation and conta-mination by an additive i.i.d. white Gaussian noise leading to Figs. 1(c) and 2(c). The blurring kernel was a 2D Gaussian
filter of size 9× 9 with variance σ2
m = 4. The decimation
factors were set to s = 4 for the first dataset and s = 2 for the second dataset. A Gaussian noise was finally added to the blurred and decimated MRI images with signal-to-noise ratios equal to SNR = 23.26 dB for the first image and SNR= 20.73 dB for the second image. Note that the sizes of the observed MR images were 64× 64 and 75 × 75 for the two datasets. A third order polynomial (d = 3) was used to generate the clean US images from the corresponding clean high-resolution MR images, as shown in Figs. 1(b) and 2(b). To generate the observed US images, log-Rayleigh noise was added to the B-mode US images yielding the images displayed in Figs. 1(d) and 2(d). Note that the SNRs for the Rayleigh noise affecting the US images were SNR= 13.72 dB for the first dataset and SNR = 13.80 dB for the second dataset. A linear normalization was finally applied to the observed MRI and US images in order to have pixel values in the interval (0, 1). This normalization ensures that MRI and US pixels have a comparable grey level scale and has been used successfully in many application such as [31].
B. Performance Evaluation
The performance of the proposed fusion algorithm was evaluated for synthetic data using four quantitative metrics: the root mean square error (RMSE), the peak signal to noise ratio (PSNR), the improved signal-to-noise ratio (ISNR) and the mean structural similarity (MSSIM) [32]. These metrics are defined explicitely in (19), where x denotes the ground truth image, ˆx is the estimated image and y is the bicubic interpolated MR image: RMSE= 0 1 N ∥ ˆx − x∥ 2 2 PSNR= 20 log10max(ˆx, x) RMSE ISNR= 10 log10 ∥y − x∥
∥ˆx − x∥2 MSSIM= 1 M M # j=1 SSIM(xj,ˆxj). (19)
The metric MSSIM is implemented blockwise, where M is the number of local windows, ˆxj and xj are local regions
extracted from ˆx and x and SSIM is the structural similarity index computed for each window as in [33]. Note that the different metrics were computed using the fused image (esti-mated as in Section III) and the US and MRI ground truth images. The proposed algorithm was compared to existing MR and US image restoration algorithms, whose objectives are 1) estimating the high-resolution MR image from the observed low resolution MR image or/and 2) denoising the observed US image.
C. Simulated Data
The fused images obtained using the proposed algorithm are displayed in Figs. 1(g) and 2(g). The first interesting result is that for both datasets, the fused image contains
information from both MR and US modalities in an enhanced image compared to the two observed MRI and US images. The fused images are compared visually in Figs. 1 and 2 to the despeckled US image (obtained by solving the denoising problem using a gradient descent algorithm, with a log-Rayleigh noise hypothesis and TV regularization) and to the super-resolved (SR) MR image obtained using the algorithm in [30] (that accounts for Gaussian noise and TV regularization). The quantitative results reported in Tab. I confirm the interest of fusing images of two different modalities, when compared to the images restored from each imaging modality separately. Considering MR and US data jointly allows both spatial resolution and image contrast to be enhanced.
V. EXPERIMENTALRESULTSWITHREALDATA
A. MR and US Image Acquisition
The proposed image fusion algorithm is adapted to regis-tered US and MR images. The multimodal registration task is challenging in most of the medical applications, including the one targeted by this study, i.e., endometriosis detection and localization [18]. For this reason, the experimental evaluation is performed hereafter on phantom data.
1) Experimental Model Design:To create our experimental model, we used a slice of beef steak of size 17× 10 × 1.5 cm, on top of which was stuck a polyvinyl alcohol (PVA) phantom, using cyanoacrylate instant glue. The phantom was created by using a spheroid plastic mold measuring 4.3×3×1.5 cm. The phantom substance was based on a mixture of deionized water (89%), PVA (10%, Aldrich) and silica (1%, Sigma-Aldrich). Water was heated until 90◦C. PVA was added slowly
and dissolved using a magnetic stirring (500 to 700 rpm during 1 hour). Silica was added just after PVA was fully solubilized. The prepared solution was then poured into the mold and submitted to freeze-thaw cycles until solidification.
The choice of beef meat was mainly motivated by its composition of muscular tissue and its echogenicity that is similar to uterus. Furthermore the presence of greasy bays facilitated the multimodality registration process. The use of PVA for manufacturing the phantom is interesting given its rel-atively low cost and widely availablity. Moreover, its US and
T1-weighted MRI features are close to those of endometriotic
cysts (homogenous low-level echogenicity in US images, high signal intensity in T1-weighted images, no signal loss in
fat-suppressed sequence).
2) Image Acquisition Protocol and Hyperparameters: MRI experiments were performed using a 3T clinical imaging sys-tem (Philips Achieva dStream, Inserm/UPS UMR1214 ToNIC Technical Platform, Toulouse, France). Axial fat-suppressed
T1-weighted sequences (multishot mode, 4mm slice thickness,
voxel matrix 4× 1 × 4 mm) and axial, sagittal and coronal
T2-weighted sequences (multishot mode, 2 mm slice thickness,
voxel matrix 0.8× 2 × 2 mm) were acquired. For the image fusion, only the T1-weighted image was used. For US image
acquisition, the experimental model was immersed in a bucket full of water. US examination was performed using a Voluson S9 system (General Electrics). All images were acquired with a 10-MHz linear array transducer.
TABLE I
QUANTITATIVERESULTS ONSIMULATEDDATA
Fig. 3. Error norms between experimental US and MR images versus the polynomial degree d.
In all the experiments below, the degree of the polynomial function relating US and MR pixel intensities was set to d= 4, which implies that the number of coefficients in cdis Nd= 15.
This choice was motivated by our results on experimental data showing that d= 4 is the smallest degree ensuring a good fit between US and MR images, as highlighted in Fig. 3. The estimation of the vector cd was considered in a preprocessing
step using (18). Fig. 4 shows the effect of applying the estimated polynomial function onto one MR image, which can be compared to the corresponding US image The same structures can be observed in the two images. In particular, the glue that is not visible in the MRI can be clearly seen in the transformed image displayed in Fig. 4(b). Finally, it is interesting to mention that the regularization parameters were fixed to their best values by visual inspection of the fused images, leading to τ1= 10−2, τ2= 3.10−6, τ3= 2.10−4 and
τ4= 10−5. Interestingly, these values were not modified for
the two experimental datasets considered in this study.
B. Performance of the Proposed Fusion Algorithm
The MRI and US observations displayed in Figs. 5(a-d) and 5(a-d) clearly contain complementary information. MRI provides a wide field of view and a good contrast between the beef steak and the polyvinyl alcohol phantom, but with limited spatial resolution. The lack of spatial resolution prevents, for example, the observation of the glue between the slice of meat
Fig. 4. (a) US image, (b) MR image obtained after applying the estimated polynomial function, representing the same imaged medium. The original MR image is shown in Fig. 5(b).
and the PVA phantom. On the other hand, US images have a limited field of view but provide a better spatial resolution, allowing for example the glue structure to be imaged very precisely. Figs. 5(e) and 6(e) show the fused images obtained with the proposed algorithm. The benefit of fusing the two imaging modalities can be observed, yielding a fused image having the good contrast of MRI and the fine spatial resolution of US. In addition to the visual inspection of the different images, the performance of the proposed fusion method was evaluated using two quantitative measures. The first measure is the contrast-to-noise ratio (CNR) [34], which can be used to evaluate the contrast between two different structures in MR, US and fused images. The CNR is defined as
CNR= 1|µi− µj| σi2+ σ2j
where µi, µj, σi2and σ2j are the means and standard deviations
of two blocks of pixels extracted from two different struc-tures. The two regions considered in this study were chosen inside the PVA phantom and the beef steak, respectively. The CNR values associated with these two regions are reported in Table II. They clearly demonstrate that image fusion allows the image contrast to be improved for both experiments (by factors of 82.1% and 191.67% for the two datasets) compared to US images.
Fig. 5. Image fusion results. (a,b) Full view and cropped MR images, (c,d) Full view and cropped US images, (e) fused image with the proposed method.
Fig. 6. Image fusion results. (a,b) Full view and cropped MR images, (c,d) Full view and cropped US images, (e) fused image with the proposed method.
The objective of the second quantitative measure is to evaluate the spatial resolution of MR, US and fused images. It is based on the image profiles crossing the boundary
between different structures. The slope of these profiles at the interface between two structures was computed and is used as an indicator of spatial resolution [35]. Fig. 7 and Table III
Fig. 7. (a) shows normalized pixel intensities of extracted lines from MRI, US and the fused image in (5). The MRI observation is in blue, the US observation is in green and the fused image is in red. The vertical straight lines indicate the delimited regions depicted in (b).
TABLE II
CNR COMPARISON FOR THEPHANTOMIMAGES
TABLE III
PROFILE SLOPE AT THEINTERFACESBETWEENDIFFERENTREGIONS OF
INTEREST IN THEMRI, USANDFUSEDIMAGES(FI), CORRESPOND
-ING TO THEVERTICALLINE INFIG. 7
highlight the improved spatial resolution resulting from the fusion of the two modalities. We observe that the fused image can differentiate neighbouring structures and highlight small structures as the glue, contrary to MRI images. For example, the second interface in Fig. 7, between the PVA phantom and the glue is not distinguishable in the MRI, while it is clearly visible in the US and fused images. This observation is confirmed by the slope coefficients reported in Table III. These two measures confirm the benefit of fusing the two imaging modalities, yielding a fused image having a good contrast (better than the one of US images) and a fine spatial resolution (better than the low spatial resolution of MRI).
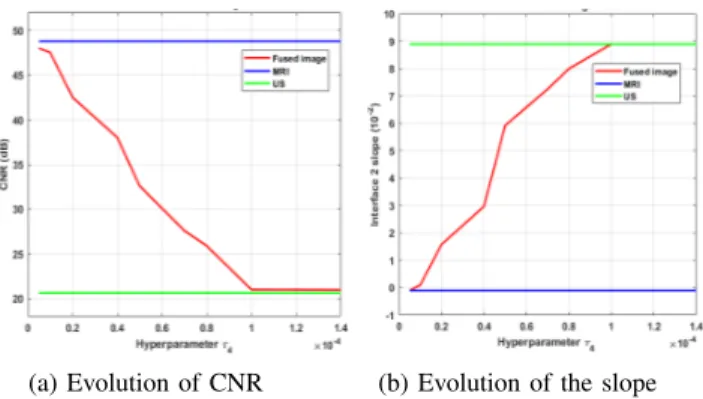
Similarly to most of the existing image reconstruction algorithms, the quality of the fusion algorithm investigated in this paper depends on the values of the hyperparameters. The hyperparameter τ4 was set to 10−5 to ensure a good
compromise between the MR and US data fidelity terms. A different choice of τ4would provide different fusion results.
As an example, for the experimental dataset #1, the fused image obtained for τ4 = 10−4 has similar features as the
US image, i.e., low contrast (CNR = 21.01dB) and good spatial resolution (with a profile slope at the interface between the PVA and the glue of 8.89× 10⁻²). On the contrary, for
τ4= 10−5, the fused image is close to the MRI, having good
contrast (CNR= 47.51dB) and a low spatial resolution (with
Fig. 8. Influence of the hyperparameter τ4on the fused image. (a) shows
the CNR evolution whereas (b) shows the evolution of the interface 2 slope for different values of τ4.
a profile slope at the interface between the PVA and the glue of−10−3) as shown in Fig. 8. Similar comments can be made
for the other hyperparameters, such as τ1and τ3balancing the
weight between the data fidelity terms and the total variation regularization (the reader is invited to consult the technical report [36] associated with this paper for more details).
VI. CONCLUSION
This paper studied a new fusion method for magnetic resonance (MR) and ultrasound (US) images. The proposed method was able to reconstruct a fused image containing infor-mation from both observations, by solving a super-resolution inverse problem for MRI and a despeckling problem for US images. These two problems were solved jointly by using appropriate statistical models and a polynomial relationship between the images of interest. A PALM algorithm was finally investigated to solve the resulting fusion problem. Results obtained on simulated and real images clearly showed the interest of combining the information contained in these two imaging modalities, instead of restoring them independently.
To the best of our knowledge, this work is a first attempt for fusing MR and US images. It opens several interesting perspectives. A natural progression of this work is to take into account the possible correlation of noise samples especially for the US image, to take into account the presence of potential artifacts and to adapt the algorithm to not-fully
developed speckle. Also, learning the functional dependence between MR and US images using machine learning tech-niques is an interesting prospect, which might help to under-stand the existing relationships between these two modalities. Finally, combining the proposed framework with multimodal image registration is also an interesting problem, which would allow the proposed MR/US image fusion to be robustified with a better applicability to in vivo data.
ACKNOWLEDGMENT
The authors would like to thank Mario Figueiredo and Alessandro Foi for fruitful discussions about this work.
APPENDIXA: IMPLEMENTATION OF THEPALM ALGORITHM OFSECTIONIII B
We denote hereafter by {(xk, vk)}
k∈N the sequence
gener-ated by the PALM algorithm.
1) Lipschitz Constants: Before going into the details of the PALM algorithm used to solve Problem (14), this section explains how the Lipschitz constants Lx(v) and Lv(x) of
x ,→ ∇xH (x, v) and v ,→ ∇vH (x, v) can be computed.
Eq. (17) leads to ∇vH (x, v)= 2τ4 . v− # p+q≤3 cpqxp(∇xHu)q / . (20) The computation of the Lipschitz constant Lv(x) is
straight-forward and leads to Lv(x)= 2τ4, ∀x. The Lipschitz constant
of x,→ ∇xH (x, v) is more complicated to evaluate. We
there-fore use PALM with a backtracking stepsize rule as suggested in [37]. Note that one of the pillars of PALM’s convergence proof is the following lemma for smooth functions.
Lemma 1: Let h: Rn→ R be a continuously differentiable
function with Lipschitz continuous gradient and Lipschitz constant Lh. Then for any L≥ Lh and∀x, y ∈ Rn
h(x)≤ h( y) + (x − y)H∇xh(x)+ L2 ∥x − y∥22. (21)
Using simple algebra, one can show that the function ψ defined in (14) satisfies the following relation
ψ(x, v)≤ QL(x, y, v) (22)
where
QL(x, y, v)= l(x) + g(v) + H ( y, v)
+ (x − y)H∇xH (y, v) + L2 ∥x − y∥2.
In order to ensure the convergence of the PALM algorithm, the backtracking rule consists of verifying that the inequality (22) is satisfied at every step. To estimate the Lipschitz constant, at each iteration k, we search for the smallest nonnegative integers ik such that Lk+1= λikLk verifies
ψ( p¯L(xk), vk)≤ Q¯L( p¯L(xk), xk, vk) with p¯L(xk)= proxlL k+1 . xk− 1 Lk+1∇xH (x k, vk)/.
Remark 2: The sequence of values ψ(xk, vk) computed by
PALM is decreasing for all xk and vk.
The proof is straightforward. For every k≥ 1 ψ(xk+1, vk)≤ QLk+1(xk+1, xk, vk) and QLk+1(xk+1, xk, vk)≤ QLk+1(xk, xk, vk)= ψ(xk, vk). Thus ψ(xk+1, vk)≤ ψ(xk, vk) and ψ(xk, vk+1)≤ ψ(xk, vk) which concludes the proof.
Remark 3: Since inequality (22) is satisfied for L ≥
Lx(v),∀v, where Lx(v) is the Lipschitz constant of x →
∇xH (x, v), the following inequalities can be obtained Lx(vk)≤ Lk+1≤ λLH(vk). (23)
Note that the inequality Lx(vk)≤ Lk+1 is sufficient to ensure
the convergence of PALM. However, the second inequality
Lk+1≤ λLH(vk) allows the convergence rate to be controlled
by an appropriate choice of λ.
In the following subsections, the updates of each variable within PALM algorithm are described in details.
2) Update ofx: The update of x is achieved by minimizing the sum of quadratic functions, leading to
xk+1 = proxl Lk+1 . xk− 1 Lk+1∇xH (x k, vk)/ = argmin x 1 2 ∥SC x − ym∥ 2+ τ 1∥∇x∥2 +Lk2 ∥+1 x − (xk− 1 Lk+1∇xH (x k, vk))∥2
where l is defined in (15) and Lk+1is the Lipschitz constant at
iteration k+1. This minimization problem admits an analytical solution, which can be computed efficiently in the Fourier domain. The practical tractability of this solution is possible for large images using the decomposition of the decimation matrix S proposed in [30], since the convolution operator is diagonalizable in the Fourier domain. The update of x at the (k+ 1)th iteration is then obtained as follows
xk+1=(CHSHSC + 2.τ 1D +Lk+1 2 IN /)−1 R (24) with R = CHSHy m+ 2Lk+1 . xk− 1 Lk+1∇xH (x k, vk)/ D = DhHDh+ DvHDv
where Dh and Dv are the horizontal and vertical finite
difference operators.
The direct computation of the solution (24) requires the inversion of high dimensional matrices. To overcome this problem, we adopt herein the solution proposed in [30],
Algorithm 1 Proposed MR/US Image Fusion Algorithm
which is recalled hereafter. Based on the circulant boundary conditions, the blurring matrix C is a block circulant with circulant blocks matrix (BCCB) that can be decomposed as
C = FH#F
where F and FH are 2D Fourier and 2D inverse Fourier
operators, #= diag(Fh), with h the first column of the matrix C. Taking into account this property and using the Woodbury inverse formula [30], the update of x can be rewritten as
xk+1 = τ 1 1Lk+1F HψFr − 1 τ1Lk+1F Hψ #H(2τ 1sIN + #ψ#H)−1#ψFr (25) where r = CHSHym+ Lk+1 . xk− L1 k+1∇xH (x k, vk)/
and the matrix # is defined as
#= diag(#1, . . . , #d)
where # is a block diagonal matrix and its diagonal elements are matrices #i, and where
ψ = F(τ1( DhHDh+ DvHDv)+
Lk+1
2 IN)−1F
H.
3) Update of v: The vector v is updated using a gradient descent algorithm with backtracking line search, given that the function to minimize in this step is differentiable and convex. More precisely, the following update has ben considered
vk+1 = argmin
v
τ2#
i
[exp(yu,i− vi)− γ (yu,i− vi)]
+τ3∥∇v∥2+ dk 2 ∥v− (v k− 1 dk∇vH (x k+1, vk))∥2 = proxgdk . vk− 1 dk∇vH (x k+1, vk)/ (26)
where g is defined in (16) and dk = Lv(xk) is the Lipschitz
constant of∇vH at iteration k.
4) Algorithm Summary: Algo. 1 summarizes all the steps of the proposed MR/US image fusion method.
REFERENCES
[1] M. Amin-Naji and A. Aghagolzadeh, “Multi-focus image fusion in DCT domain using variance and energy of Laplacian and correlation coefficient for visual sensor networks,” J. AI Data Mining, vol. 6, no. 2, pp. 233–250, 2018.
[2] A. P. James and B. V. Dasarathy, “Medical image fusion: A survey of the state of the art,” Inf. Fusion, vol. 19, pp. 4–19, Sep. 2014. [3] A. Loza, D. Bull, N. Canagarajah, and A. Achim, “Non-Gaussian
model-based fusion of noisy images in the wavelet domain,” Comput.
Vis. Image Understand., vol. 114, no. 1, pp. 54–65, Jan. 2010. [4] S. Marshall, G. K. Matsopoulos, and J. N. Brunt, “Fusion of MR and
CT images of the human brain using multiresolution morphology,” in
Mathematical Morphology and Its Applications to Image Processing, vol. 1994, pp. 317–324.
[5] H. Yésou, Y. Besnus, and J. Rolet, “Extraction of spectral information from landsat TM data and merger with SPOT panchromatic imagery— A contribution to the study of geological structures,” ISPRS J.
Pho-togramm. Remote Sens., vol. 48, no. 5, pp. 23–36, Oct. 1993. [6] C. O. Ancuti, C. Ancuti, C. D. Vleeschouwer, and A. C. Bovik,
“Single-scale fusion: An effective approach to merging images,” IEEE
Trans. Image Process., vol. 26, no. 1, pp. 65–78, 2016.
[7] Q. Guihong, Z. Dali, and Y. Pingfan, “Medical image fusion by wavelet transform modulus maxima,” Opt. Express, vol. 9, no. 4, pp. 184–190, Aug. 2001.
[8] Q. P. Zhang, W. J. Tang, L. L. Lai, W. C. Sun, and K. P. Wong, “Med-ical diagnostic image data fusion based on wavelet transformation and self-organising features mapping neural networks,” in Proc. IEEE Int.
Conf. Mach. Learn., vol. 5. Aug. 2004, pp. 2708–2712.
[9] S. Gautier, G. L. Besnerais, A. Mohammad-Djafari, and L. Blandine, “Data fusion in the field of non destructive testing,” in Maximum Entropy
Bayesian Methods, 1996, pp. 311–316.
[10] H. Roman et al., “High postoperative fertility rate following surgical management of colorectal endometriosis,” Hum. Reproduction, vol. 33, no. 9, pp. 1669–1676, 2018.
[11] V. Nisenblat, P. M. Bossuyt, C. Farquhar, N. Johnson, and M. L. Hull, “Imaging modalities for the non-invasive diagnosis of endometriosis,”
Cochrane Database Syst. Rev., vol. 2, no. 2, 2016, Art. no. CD009591. [12] O. Donnez and H. Roman, “Choosing the right surgical technique for deep endometriosis: Shaving, disc excision, or bowel resection?”
Fertility Sterility, vol. 108, no. 6, pp. 931–942, Dec. 2017.
[13] T. C. Aysal and K. E. Barner, “Rayleigh-maximum-likelihood filtering for speckle reduction of ultrasound images,” IEEE Trans. Med. Imag., vol. 26, no. 5, pp. 712–727, May 2007.
[14] S. Gupta, R. C. Chauhan, and S. C. Saxena, “Locally adaptive wavelet domain Bayesian processor for denoising medical ultrasound images using speckle modelling based on Rayleigh distribution,” IEE Proc.-Vis.,
Image, Signal Process., vol. 152, no. 1, pp. 129–135, 2005.
[15] N. Gupta, M. N. S. Swamy, and E. Plotkin, “Despeckling of medical ultrasound images using data and rate adaptive lossy compression,” IEEE
Trans. Med. Imag., vol. 24, no. 6, pp. 743–754, Jun. 2005.
[16] V. J. Mathews and G. Sicuranza, Polynomial Signal Processing. Hoboken, NJ, USA: Wiley, 2000.
[17] A. Roche, X. Pennec, G. Malandain, and N. Ayache, “Rigid registration of 3-D ultrasound with MR images: A new approach combining intensity and gradient information,” IEEE Trans. Med. Imag., vol. 20, no. 10, pp. 1038–1049, 2001.
[18] A. Yavariabdi, A. Bartoli, C. Samir, M. Artigues, and M. Canis, “Mapping and characterizing endometrial implants by registering 2D transvaginal ultrasound to 3D pelvic magnetic resonance images,”
Com-put. Med. Imag. Graph., vol. 45, pp. 11–25, Oct. 2015.
[19] S. Xu et al., “Real-time MRI-TRUS fusion for guidance of targeted prostate biopsies,” Comput. Aided Surg., vol. 13, no. 5, pp. 255–264, Jan. 2010.
[20] R. Narayanan, J. Kurhanewicz, K. Shinohara, E. D. Crawford, A. Simoneau, and J. S. Suri, “MRI-ultrasound registration for targeted prostate biopsy,” in Proc. IEEE Int. Symp. Biomed. Imag., Nano Macro, Boston, MA, USA, Jun. 2009, pp. 991–994.
[21] B. C. Porter, D. J. Rubens, J. G. Strang, J. Smith, S. Totterman, and K. J. Parker, “Three-dimensional registration and fusion of ultrasound and MRI using major vessels as fiducial markers,” IEEE Trans. Med.
Imag., vol. 20, no. 4, pp. 354–359, Apr. 2001.
[22] F. Shi, J. Cheng, L. Wang, P.-T. Yap, and D. Shen, “LRTV: MR image super-resolution with low-rank and total variation regularizations,” IEEE
[23] D. Kundu and M. Z. Raqab, “Generalized Rayleigh distribution: Differ-ent methods of estimations,” Comput. Statist. Data Anal., vol. 49, no. 1, pp. 187–200, Apr. 2005.
[24] T. Tuthill, “Deviations from Rayleigh statistics in ultrasonic speckle,”
Ultrason. Imag., vol. 10, no. 2, pp. 81–89, Apr. 1988.
[25] B. Cohen and I. Dinstein, “New maximum likelihood motion estimation schemes for noisy ultrasound images,” Pattern Recognit., vol. 35, no. 2, pp. 455–463, Feb. 2002.
[26] D. Boukerroui, J. A. Noble, and M. Brady, “Velocity estimation in ultra-sound images: A block matching approach,” in Information Processing
in Medical Imaging. Heidelberg, Germany Springer, 2003, pp. 586–598. [27] H. Gudbjartsson and S. Patz, “The rician distribution of noisy MRI data,”
Magn. Reson. Med., vol. 34, no. 6, pp. 910–914, Dec. 1995. [28] S. Boyd, “Distributed optimization and statistical learning via the
alter-nating direction method of multipliers,” Found. Trends Mach. Learn., vol. 3, no. 1, pp. 1–122, 2010.
[29] J. Bolte, S. Sabach, and M. Teboulle, “Proximal alternating linearized minimization or nonconvex and nonsmooth problems,” Math. Program., vol. 146, nos. 1–2, pp. 459–494, 2014.
[30] N. Zhao, Q. Wei, A. Basarab, N. Dobigeon, D. Kouamé, and J.-Y. Tourneret, “Fast single image super-resolution using a new analytical solution for ℓ2-ℓ2 problems,” IEEE Trans. Image Process.,
vol. 25, no. 8, pp. 3683–3697, May 2016.
[31] J. D. Christensen, “Normalization of brain magnetic resonance images using histogram even-order derivative analysis,” Magn. Reson. Imag., vol. 21, no. 7, pp. 817–820, Sep. 2003.
[32] A. Hore and D. Ziou, “Image quality metrics: PSNR vs. SSIM,” in
Proc. 20th Int. Conf. Pattern Recognit., Istanbul, Turkey, Aug. 2010, pp. 2366–2369.
[33] Z. Wang, A. C. Bovik, H. R. Sheikh, and E. P. Simoncelli, “Image quality assessment: From error visibility to structural similarity,” IEEE
Trans. Image Process., vol. 13, no. 4, pp. 600–612, Apr. 2004. [34] M. Welvaert and Y. Rosseel, “On the definition of Signal-To-Noise ratio
and Contrast-To-Noise ratio for fMRI data,” PLoS ONE, vol. 8, no. 11, Nov. 2013, Art. no. e77089.
[35] R. Morin, A. Basarab, S. Bidon, and D. Kouamé, “Motion estimation-based image enhancement in ultrasound imaging,” Ultrasonics, vol. 60, pp. 19–26, Jul. 2015.
[36] O. E. Mansouri, F. Vidal, A. Basarab, P. Payoux, D. Kouamé, and J.-Y. Tourneret, “Fusion of magnetic resonance and ultrasound images for endometriosis detection,” Univ. Toulouse, Toulouse, France, Tech. Rep., 2020. [Online]. Available: https://www.irit.fr/Adrian. Basarab/img/Technical_report_TIP_ImageFusion%.pdf
[37] A. Beck and M. Teboulle, “A fast iterative shrinkage-thresholding algo-rithm for linear inverse problems,” SIAM J. Imag. Sci., vol. 2, no. 1, pp. 183–202, Jan. 2009.
Oumaima El Mansouri (Student Member, IEEE)
received the degree in engineering in aeronautics and aerospace from l’Institut supérieur de l’aéronautique et de l’Espace (ISAE), Toulouse, France, in 2017, and a research master in Control, Signal and Image Processing (ATSI), Paris Saclay, Paris, in 2017. She is currently pursuing the Ph.D. degree with research group MINDS in IRIT Laboratory. Her Ph.D. thesis is fusion of MRI and ultrasound images for endometriosis detection. She is also working on a remote sensing project with TéSA Laboratory. Her research has been focused on medical imaging, satellite imagery, and inverse problems in image processing, particularly image fusion, registration, and segmentation.
Fabien Vidal received the Medical Doctor degree
from the University of Paris VI, France, in 2003. He is currently pursuing the Ph.D. degree with the IRIT Laboratory, MINDS Research Group. As a Gyne-cologist Surgeon, he is involved in the management of deep infiltrating endometriosis at the University Hospital of Toulouse, France. Its clinical research topics mainly comprise endometriosis, pelvic organ prolapse, and gynecologic oncology. His basic sci-ence research interests include fusion in medical imaging and augmented reality applied to breast conservative surgery.
Adrian Basarab (Senior Member, IEEE) received
the M.S. and Ph.D. degrees in signal and image processing from National Institute for Applied Sci-ences of Lyon, France, in 2005 and 2008, respec-tively. Since 2009, he has been an Assistant (Associate) Professor with University Paul Sabatier Toulouse 3 and a member of the IRIT laboratory (UMR CNRS 5505). His research interests include medical imaging and more particularly inverse prob-lems (deconvolution, superresolution, compressive sampling, beamforming, image registration, and fusion) applied to ultrasound image formation, ultrasound elastography, car-diac ultrasound, quantitative acoustic microscopy, computed tomography, and magnetic resonance imaging.
Pierre Payoux, photograph and biography not available at the time of
publication.
Denis Kouamé (Senior Member, IEEE) received
the Ph.D. and Habilitation Diriger des Recherches degrees in signal processing and medical ultrasound imaging from the University of Tours, Tours, France, in 1996 and 2004, respectively. He is currently a Professor with Paul Sabatier University of Toulouse, Toulouse, France, and a member of the IRIT Lab-oratory. He currently leads the Signals and Image Department, IRIT. His research interests are based on signal and image processing with the special focus on medical imaging and particularly ultra-sound imaging, including high resolution imaging, image resolution enhance-ment, Doppler signal processing, multidimensional parametric modeling, and inverse problems related to compressed sensing and restoration. He has been serving as an Associate Editor of the IEEE TRANSACTIONS ON
ULTRASONICS, FERROELECTRICS,AND FREQUENCYCONTROL and the IEEE TRANSACTIONS ONIMAGEPROCESSING.
Jean-Yves Tourneret (Fellow, IEEE) received the
ingénieur degree in electrical engineering from the Ecole Nationale Supérieure d’Electronique, d’Electrotechnique, d’Informatique, d’Hydraulique et des Télécommunications (ENSEEIHT) de Toulouse in 1989, and the Ph.D. degree from the National Polytechnic Institute from Toulouse in 1992. He is currently a Professor with the University of Toulouse (ENSEEIHT) and a member of the IRIT Laboratory (UMR 5505 of the CNRS). His research activities are centered around statistical signal and image processing with a particular interest to Bayesian and Markov chain Monte Carlo (MCMC) methods.