HAL Id: hal-01247159
https://hal.inria.fr/hal-01247159
Submitted on 21 Dec 2015
HAL is a multi-disciplinary open access
archive for the deposit and dissemination of
sci-entific research documents, whether they are
pub-lished or not. The documents may come from
teaching and research institutions in France or
abroad, or from public or private research centers.
L’archive ouverte pluridisciplinaire HAL, est
destinée au dépôt et à la diffusion de documents
scientifiques de niveau recherche, publiés ou non,
émanant des établissements d’enseignement et de
recherche français ou étrangers, des laboratoires
publics ou privés.
Distributed under a Creative Commons Attribution - NonCommercial| 4.0 International
License
Decentralized view prediction for global content
placement
Stéphane Delbruel, Davide Frey, François Taïani
To cite this version:
Stéphane Delbruel, Davide Frey, François Taïani.
Decentralized view prediction for global
content placement.
Middleware 2015 :
ARM Workshop, Dec 2015, Vancouver, Canada.
�10.1145/2834965.2834974�. �hal-01247159�
Decentralized view prediction for global content placement
Stéphane Delbruel
University of Rennes 1 IRISA - Inria Rennes, France
[email protected]
Davide Frey
Inria Rennes, France[email protected]
François Taïani
University of Rennes 1 - ESIR IRISA Rennes, France
[email protected]
ABSTRACT
A large portion of today’s Internet traffic originates from streaming and video services. Storing, indexing, and serving these videos is a daily engineering challenge that requires in-creasing amounts of efforts and infrastructures. One promis-ing direction to improve video services consists in predictpromis-ing at upload time where and when a new video might be viewed, thereby optimizing placement and caching decisions. Imple-menting such a prediction service in a scalable manner poses significant technical challenges. In this paper, we address these challenges in the context of a decentralized storage sys-tem consisting of set-top boxes or end nodes. Specifically, we propose a novel data placement algorithm that exploits information about the tags associated with existing content, such as videos, and uses it to infer the number of views that newly uploaded content will have in each country.
Categories and Subject Descriptors
H.3.2 [Information Systems]: Information Storage and Retrieval—Information Storage
General Terms
Measurement, Algorithm, Design
Keywords
User-generated content, YouTube, tag, prediction
1.
INTRODUCTION
On-line content production and consumption is explod-ing both in terms of volume and involved users. In June 2015, for instance, Youtube received 300 hours of video every minute, as opposed to 100 hours every minute in 2014 [11]. In order to maintain a high level of service, the correspond-ing data must be reliably stored and distributed to users through a globally distributed infrastructure.
Nowadays, most of this data is placed in private data cen-ters and served to requesting users using Content Distribu-tion Networks (CDNs) or by placing caching servers into the infrastructure of ISPs [5]. This approach tends to fa-vor big players, and both academia and practitioners have sought to explore alternative designs. In fully decentralized solutions [1, 2, 6, 9, 10], for example, each user (through her computer or set-top box) provides storage capacity and computing resources to the overall system, eschewing the need for any centralized element, either hosted in the cloud or on replicated servers.
Decentralized solutions rely primarily on local informa-tion (e.g. users profiles, bandwidth, latency, tags). While this helps with scalability, too strong a focus on locality con-strains the range of decisions that can be taken by individual nodes, and limits ability of such services to adapt to richer and more advanced phenomena occurring at a global scale. Recognizing this problem, we study how to make global
predictions in large-scale decentralized systems, with an
ap-plication to the placement of video storage in a decentralized UGC video service. Predictions provide a crucial ability to self-adaptive systems: they use information about the past to predict the future, and can help systems anticipate sys-temic changes, and adapt to new workloads. Global pre-dictions can unfortunately be difficult to achieve in a decen-tralized system in a scalable manner: for instance, predicting where a newly uploaded video might be most viewed would ideally require processing global viewing patterns of similar videos, a global and hence particularly costly computation.
2.
DECENTRALIZED PREDICTION
We propose a decentralized architecture that optimizes the storage of videos by predicting their viewing patterns. In our previous work [4], we suggested proactively placing videos in the countries where they were likely to be most viewed. To this end, we proposed an off-line tag-based prediction of video views in each countries. Here we explain how to decentralize this approach.
2.1
Baseline prediction with full information
The original insight behind our off-line prediction was to use the number of views currently associated with a tag t in a country c (noted viewsVcur(t)[c]) to compute the average
number of views that videos associated with t had received in country c (noted views p vidVcur(t)[c]).
views p vidVcur(t)[c] = viewsV cur(t)[c]
|{v ∈ Vcur: t∈ tags(v)}|
LetVcur be the set of videos currently in the system, and
tags(v) the set of tags associated with a video v. Then,
Eq. (1) counts the number of per-video views of a tag t in a country c, and normalizes this value by dividing it by the total number of videos containing t among those that are currently in the system. A real system should complement this by taking into account the number of views in a finite time window (discounting very old views). But, for simplic-ity, we ignore this aspect in the following. Viewing profiles based on sliding windows may easily be integrated by fol-lowing the example of [3].
Based on the average number of views per tag, equa-tion (2) then estimates the number of views of a new video as the arithmetic mean (notedE) of the number of per-video views of the uploaded video’s tags. Once we have predicted the number of views of a video for each country, we can then store the uploaded video in the country or countries associated with the largest prediction(s).
\
views(v)[c] = E
t∈tags(v)
(
views p vidVcur(t)[c]) (2)
2.2
Towards Decentralized Prediction
The major challenge in decentralizing Eq. (1) and (2) lies in computing the number of videos that contain a given tag across all countries (denominator in Eq. (1)). A precise com-putation would require a global aggregation process covering all users. But in practice, we do not need to predict abso-lute numbers of views to place videos, but we only need to rank countries according to where a video might be most viewed in the future. If we further decide to consider that all tags appear in the same number of videos (an obvious approximation), we can simplify Eq. (1) and concentrate on its numerator. This leads us to simply use the average num-ber of views of a video v’s tags in a country c as an estimator of the country’s fitness for hosting the video v.
fitness(v)[c] = E
t∈tags(v)
(
viewsVcur(t)[c]) (3)
2.3
From Countries to Hosts
Computing the fitness score in Eq. (3) would be easy if we had a system consisting of one storage server per coun-try that kept track of the videos and tags consumed in this country. However, our goal consists in storing videos on end nodes; and each country may comprise a very large num-ber of them. In this section, we therefore propose a novel approach that allows us to estimate the value of the fitness score in a large-scale decentralized system.
First, we observe that we can rewrite Eq. (3) by summing the average number of per-tag views of each individual user
u in country c.
fitness(v)[c] = E
t∈tags(v)
( ∑
u∈c
viewsVcur(t)[u])
=∑
u∈c
E
t∈tags(v)
(
viewsVcur(t)[u])
(4)
Based on Eq. (4), each user simply needs to record her own number of views for each tag, t. The only problem that re-mains then consists in estimating the value of the summation in a decentralized fashion.
We achieve this by creating a self-organizing overlay [2] in each country. Each user in each overlay maintains a
pro-file that contains all the tags associated with all the videos she has viewed, each weighted by a corresponding number of views. Each overlay organizes the users of a particular coun-try in a k-nearest-neighbor graph, with a similarity metrics that reflects the “fitness” of users to one another.
sim(u, v) = ∑
t∈tags(u)∩tags(v)
viewsVcur(t)[u]·viewsVcur(t)[v]
(5) The similarity considers the profile of a user as a “paradig-matic video” that captures this user’s tastes. Thus, we can interpret the above metric as the fitness of one “user-as-a-video” for another user, as we did in (4) for individual videos. The differences with (4) are that a user’s tags are weighted by the number of times this user was exposed to that tag, hence the multiplication; and that we do not divide by the number of tags in a video, hence a summation instead of an arithmetic mean.
2.4
Estimating Views using the Overlay
The country-level self-organizing overlay runs as a back-ground task and sets up a routing environment that allows us to estimate the number of views of a video in a given country. In addition, we also employ an additional over-lay: a global random-peer-sampling (RPS) protocol [7] that comprises all participating users, regardless of their country.
US DE
FR
BR
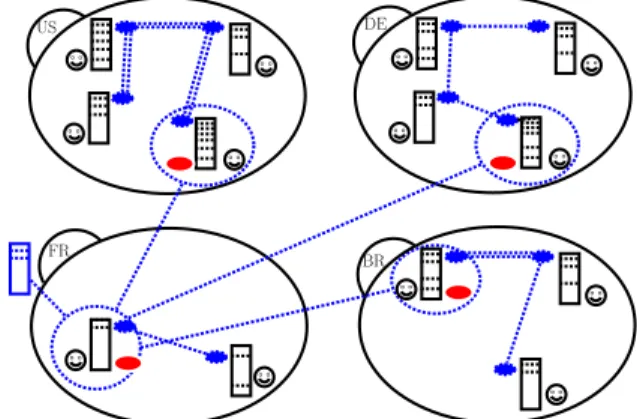
Figure 1: An uploading node with a virtual node in each country
Figure 1 outlines our decentralized prediction. Consider a user ˆu in country ˆc that uploads a new video ˆv with a set
of tags tags(ˆv). User ˆu uses the global RPS to identify one
node for each country. Depending on the size of the global RPS view, identifying one node per country may require ˆu
to wait for a few RPS rounds. However, we estimate that a identifying nodes for a sufficiently large subset of countries may be enough. Let W be the set of identified nodes.
Next, ˆu builds a profile data structure for video ˆv. This
profile, P (ˆv) contains all the tags associated with ˆv, each
with a value of 1. Node ˆu then asks each node in W to run
a virtual node in the country-level overlay using a copy of
P (ˆv). When computing the similarity between a user and P (ˆv), Eq. (5) reduces to Eq. (6).
sim(u, P (ˆv)) = ∑ t∈tags(u)∩tags(ˆv)
viewsVcur(t)[u]
= [
E
t∈tags(ˆv)
(
viewsVcur(t)[u])]· |tags(ˆv)|
k best nodes by similarity
Figure 2: Trend graph for an uploaded video. The dashed node scores are those that are ignored be-cause not within the k best. The linear-regression slope from the k bests is shown in red.
Each virtual overlay node participates in a country-level overlay until the corresponding view converges. When this happens, the view of each virtual node will contain a set of nodes with the highest similarity values, that is with the highest values of Eq. (6). If we plot all these similarity values in decreasing order, we obtain a plot like the one in Figure 2, which we refer to as a trend graph.
The trend graph lists all the entries in a virtual node’s view in decreasing order of similarity. Since similarity values correspond to the sum of the number of views of the video’s tags (Eq. (5)), the integral of the trend graph over the entire set of nodes in country ˆc corresponds to the fitness of video
ˆ
v in ˆc multiplied by|tags(ˆv)| (Eq. (4)).
Clearly, scalability reasons make it impossible for cluster-ing views to contain the entire set of a country’s nodes. We therefore compute an approximation of the integral of the trend graph. For example, we can consider only its “visible” portion, or approximate Eq. (4) by using the area under its linear regression. We leave the evaluation of these and other heuristics, including higher-order approximations, to future work.
After computing the approximation for all the considered countries, user ˆu selects the highest ranked ones and stores
the videos on the top scoring host(s) in each of them. We plan to experiment with different options: one versus mul-tiple countries, and one versus mulmul-tiple top-scoring hosts.
3.
CONCLUSION AND DISCUSSION
In this paper, we have outlined a protocol and an archi-tecture to estimate where a newly uploaded video might be most viewed, and place this video accordingly, in a fully de-centralized manner. Because it avoids the need for a central support infrastructure, our approach hints at the possibility of smart analytics in pure peer-to-peer systems. This can be useful both to promote alternatives to the cloud-centered model of current UGC video services, but also to improve the hybrid P2P/cloud architectures already used by some leading companies (Spotify [8], Akamai [12]) by offloading
complex adaptive tasks to the P2P part of a hybrid system. We are currently continuing this preliminary work by eval-uating several approximation techniques on realistic traces.
Acknowledgments
This work was partially funded by the French ANR project So-cioPlug (ANR-13-INFR-0003), and by the DeSceNt project of the Labex CominLabs excellence laboratory (ANR- 10-LABX-07-01). This work is also supported by the project Towards a Decentral-ized Embryomorphic Storage System, a “Politique doctorale 2013” grant of the University of Rennes 1.
4.
REFERENCES
[1] S. Androutsellis-Theotokis and D. Spinellis. A survey of peer-to-peer content distribution technologies. ACM
Comput. Surv., 36(4):335–371, Dec. 2004.
[2] M. Bertier, D. Frey, R. Guerraoui, A.-M. Kermarrec, and V. Leroy. The gossple anonymous social network. In Middleware, 2010.
[3] A. Boutet, D. Frey, R. Guerraoui, A. J´egou, and A.-M. Kermarrec. WhatsUp Decentralized Instant News Recommender. In IPDPS, 2013.
[4] S. Delbruel, D. Frey, and F. Ta¨ıani. Exploring the Geography of Tags in Youtube Views. Research Report RT-0461, IRISA, Inria Rennes, Apr. 2015. [5] Google. Google peering and content delivery .
https://peering.google.com/about/ggc.html. (accessed 2/5/2015).
[6] K. Huguenin, A.-M. Kermarrec, K. Kloudas, and F. Ta¨ıani. Content and geographical locality in user-generated content sharing systems. In NOSSDAV, 2012.
[7] M. Jelasity, S. Voulgaris, R. Guerraoui, A.-M. Kermarrec, and M. van Steen. Gossip-based peer sampling. ACM TOCS, 25, 2007.
[8] G. Kreitz and F. Niemel¨a. Spotify – large scale, low latency, P2P music-on-demand streaming. In P2P, 2010.
[9] J. Kubiatowicz, D. Bindel, Y. Chen, S. Czerwinski, P. Eaton, D. Geels, R. Gummadi, S. Rhea,
H. Weatherspoon, W. Weimer, et al. Oceanstore: An architecture for global-scale persistent storage. ACM
Sigplan Notices, 35(11):190–201, 2000.
[10] J. M. Pujol, V. Erramilli, G. Siganos, X. Yang, N. Laoutaris, P. Chhabra, and P. Rodriguez. The little engine(s) that could: scaling online social networks. In
SIGCOMM, 2010.
[11] L. Youtube. Statistics, viewership . http://www.youtube.com/yt/press/statistics.html. (accessed 2/5/2015).
[12] M. Zhao, P. Aditya, A. Chen, Y. Lin, A. Haeberlen, P. Druschel, B. Maggs, B. Wishon, and M. Ponec. Peer-assisted content distribution in Akamai NetSession. In IMC. ACM, 2013.