UNIVERSITÉ DE SHERBROOKE
Dépistage pour la réussite dans un programme d'arts visuels
par Lucy Trahan
Essai présenté à la Faculté d’éducation En vue de l’obtention du grade de
Maître en éducation (M.Éd.) Maîtrise en enseignement au collégial
Décembre 2007 © Lucy Trahan, 2007
UNIVERSITÉ DE SHERBROOKE
Screening for success in a visual arts program
by Lucy Trahan
Essay presented to the Faculty of Education in order to obtain a
Maître en éducation (M.Éd.) Maîtrise en enseignement au collégial
December, 2007 © Lucy Trahan, 2007
UNIVERSITÉ DE SHERBROOKE
Faculty of Education
Screening for success in a visual arts program
by
Lucy Trahan
has been evaluated by a jury consisting of the following persons :
__________________________ Research Director (Name and Title of Director)
__________________________ Research Evaluator (Name and Title of Evaluator)
ABSTRACT
In recent years, there has been a consistent focus on improving student success across all levels of the educational system. However, little research has been directed towards determining means of predicting success in visual arts programs. Therefore, this study attempts to profile a typical successful student in a visual arts program, namely the Illustration & Design program at Dawson College. To this end, questionnaires, designed by the researcher, served to investigate the students’ reasons for choosing the program as well as provide demographic data. In addition, students’ personality types were investigated by means of the online Sternberg & Wagner Thinking Styles Inventory (SWTSI) questionnaire. Using the SPSS statistical software, an analysis was done to determine whether students who offer intrinsically motivated reasons for applying to the Illustration & Design program are those who also demonstrate greater academic success. Furthermore, grounding this study in Sternberg’s theory of mental self governance, students’ college grades were correlated to their personality type to determine if Type I personality types perform better academically than Type II or Type III (Zhang, 2005). The participants consisted of three cohorts (128 students from semester 1, 3 and 5) of the Illustration & Design program, as well as two comparison groups, one from the Fine Arts program (24 students), and another from the Business Administration program, a non-visual arts program at Dawson College (20 students).
Using Sternberg & Zhang’s typology, it was found that a typical successful student of Illustration & Design is either Type I or Type II personality types. While the majority of students gave intrinsic reasons for applying to the program, it did not appear to translate in a difference in academic achievement. The greatest predictor of
Screening for success in visual arts 5
success was found to be High School Averages. Although there was no significant difference in the Entrance Portfolio Scores between males and females, female students showed significantly greater scores in academic achievement at all levels. Therefore, these findings indicate that the entrance criteria for admission into the program should be redesigned to include a criteria for High School achievement, but not to include a personality test as this did not prove to be significant in predicting their success.
RÉSUMÉ
Au cours des dernières années, il y a eu une focalisation constante sur l'amélioration de la réussite des élèves à tous les niveaux du système éducatif. Cependant, les recherches portant sur l’identification de moyens qui permettent de prédire la réussite dans les programmes d’arts plastiques sont très rares. Par conséquent, cette étude tente de dresser le profil de l’élève type qui réussit dans un programme d'arts visuels, à savoir le programme Illustration & Design au Collège Dawson. À cette fin, des questionnaires conçus par le chercheur ont servi à déterminer les raisons pour lesquelles l’élève a choisi ce programme et ont permis de fournir des données démographiques. En outre, les étudiants ont été catégorisés par type de personnalité au moyen du questionnaire Sternberg & Wagner Thinking Styles Inventory (SWTSI). Grâce au logiciel statistique SPSS, une analyse a été effectuée afin de déterminer si les élèves dont la motivation comptait beaucoup dans leur choix du programme Illustration and Design étaient aussi ceux qui affichaient un taux de réussite plus élevé. En outre, en s’appuyant sur la théorie d’autonomie de gestion mentale de Sternberg, cette étude avait pour but de corréler les résultats scolaires des élèves à leur personnalité afin de déterminer si les étudiants du Type de personnalité I avaient de meilleurs résultats scolaires que ceux de Type II et de Type III (Zhang, 2005). Les participants étaient composés de trois cohortes (128 étudiants des 1er, 3e et 5e semestres) du programme Illustration et Design ainsi que de deux groupes témoins, un groupe de 24 élèves du programme de Beaux-Arts, et un groupe de 20 élèves du programme de Techniques de l'Administration, programme en dehors des arts visuels.
L’étude a démontré que l’élève type qui réussit dans le programme Illustration & Design appartient soit au type de personnalités I ou II de Sternberg & Zhang. Alors que pour une majorité d’étudiants la motivation explique leur choix de programme, cette motivation ne semble pas influencer leurs résultats scolaires. Le facteur le plus prédictif de la réussite scolaire au collégial s’est révélé être le résultat scolaire au secondaire. Bien qu'il n'y ait pas de différence significative entre les notes obtenues pour la qualité des portfolios soumis par les garçons et les filles lors de l’inscription, les filles obtiennent de meilleurs résultats scolaires à tous les niveaux. Ainsi, les résultats de cette étude indiquent que les critères d'entrée pour l'admission dans le programme Illustration & Design devraient être modifiés de façon à inclure un critère relié à la réussite scolaire au secondaire. Par contre, il ne semble pas nécessaire de faire appel à un test de personnalité puisque ce dernier ne s’est pas avéré être un facteur prédictif significatif en matière de réussite scolaire.
TABLE OF CONTENTS
ABSTRACT ………... 4
RÉSUMÉ ………..…... 6
INTRODUCTION ………...13
1. BACKGROUND INFORMATION ………... ... ..13
CHAPTER ONE - REVIEW OF THE LITERATURE ……….….15
1. ARTS - A NECESSARY PART OF THE CURRICULUM ………... .. 15
2. GRADE-POINT AVERAGE AS PREDICTORS ………... ... 18
3. GENDER EFFECTS …...………... . 20
4. THINKING STYLES ..………... .. 20
5. LOCAL FINDINGS …...……….………... . 25
CHAPTER TWO - FORMULATION OF THE PROBLEM …...27
1. RESEARCH QUESTIONS …...………..……….……... ...30
CHAPTER THREE - METHOD AND DESIGN ………... 32
1. SAMPLE ………... ... ... 32 2. DATA COLLECTION ………...………... ... ... 33 3. INSTRUMENTS ………...………... 33 4. PROCEDURES ………... ... ... 36 5. DATA ANALYSIS ………...…... 39 5.1 Qualitative ………... ... 39 5.2 Quantitative………....…... 39 6. ETHICAL CONSIDERATIONS .………...…... .. 41
Screening for success in visual arts 8
CHAPTER FOUR - PRESENTATION OF FINDINGS ………... ... 42
1. DEMOGRAPHIC DATA FOR ILLUSTRATION & DESIGN, FINE ARTS AND BUSINESS ADMINISTRATION………...………... ... ... 42
2. LEVEL OF MATURITY………..………...…... ... 42
3. RELATIONSHIP OF PERSONALITY TYPES AND THINKING STYLES WITH PROGRAM OF STUDY………... 44
4. RELATIONSHIP OF THINKING STYLES WITH GENDER AND LEVELS OF MATURITY.…47 5. RELATIONSHIP OF ACADEMIC PERFORMANCE AND GENDER, LANGUAGE, LEVEL OF MATURITY, AGE, AND MOTHER TONGUE………... ... 49
6. RELATIONSHIP OF ACADEMIC PERFORMANCE WITH PERSONALITY TYPE AND THINKING STYLES………...………... 53
7. CORRELATIONAL ANALYSIS WITH RESPECT TO ACADEMIC PERFORMANCE …... .. 61
8. RELATIONSHIP OF PORTFOLIO SCORES WITH PERSONALITY TYPES AND THINKING STYLES………...………... 62
9. RESULTS - MOTIVATING FACTORS 9.1. Reasons for applying to program of studies (motivation) …………... ... 62
9.2. Motivation and academic performance ………... ... 64
9.3. Motivation, gender and program of study ………...………... 64
CHAPTER FIVE - DISCUSSION …... 67
1. DATA COLLECTION ………...……….………... 67
2. PARTICIPANTS ……...……….….………... 68
3. DISCUSSION OF THE RESULTS………...………..…... ... 69
3.1. Thinking styles and personality types …………... ...………... ... 69
4. ACADEMIC PERFORMANCE ………...……….………... .73
4.1. Discussion of limitations………...………... ... .77
Screening for success in visual arts 9
REFERENCES …………...……….………... ... 80
APPENDIX A - DEMOGRAPHIC SURVEYS ……….…. 84
APPENDIX B - CONTENT ANALYSIS DATA GROUPING CHARTS - QUESTION #32…..97
APPENDIX C - CONTENT ANALYSIS - MCA & FREQUENCY CHARTS ……...…….. 106
APPENDIX D -STERNBERG & WAGNER THINKING STYLES INVENTORY …..……. 108
APPENDIX E - PERSONALITY SUMMARY CHARTS ……… 112
APPENDIX F - FOCUS GROUPS QUESTIONS, ITINERARY AND CONSENT FORMS …115
LIST OF TABLES
Table 1 Thinking styles according to Sternberg’s theory of mental self governance ... 21
Table 2 Personality types according to Zhang (Wooley, 2005) ………..………...……. 23
Table 3 Male / female ratio by program of study ………..……….. 42
Table 4 Participants’ level of maturity……….…………..………... 43
Table 5 Personality types by program of study ……….….…..44
Table 6 Thinking style (function) by program of study ……….…..…….……….. 45
Table 7 Thinking style (forms) by program of study ………..……….45
Table 8 Thinking styles (levels) by program of study ……….…..…….…..……46
Table 9 Thinking styles (orientations) by program of study ………….…...….……..… 47
Table 10 Thinking styles (ideologies) by program of study ………..…..……..… 47
Table 11 Thinking styles (function) and gender ………..……….…...… 48
Table 12 Thinking styles (forms) and gender ………..……….…..…... 48
Table 13 Thinking styles (levels) and gender ………..………...……... 49
Table 14 Thinking styles (ideologies) and gender ………...……….…..…... 49
Table 15 Total college average by program of study ………...……..………...…….50
Table 16 Secondary 5 average by program of study …………...………..…………...…..51
Table 17 Mean (m) average of core courses by program of study ……..……….…...….. 51
Table 18 Grade averages by gender ………..………….…..…..52
Table 19 Performance by gender ……….…...52
Table 20 Performance in 510, 520 and 570 courses by gender ………. 53
Table 21 Relationship of TSI orientations with performance in 570 courses ……. 53
Screening for success in visual arts 11
Table 23 Academic performance in visual arts courses by personality type……... 60
Table 24 Academic performance in concentration and total college averages by personality type……… 60
Table 25 Correlations predicting academic performance in college…………... ... 61
Table 26 Participants’ reasons for choosing their program of study ………...….. 63
Table 27 Grade averages by motivation ………...….… 64
Table 28 Statistical difference in grade averages by motivation …... ... 64
Table 29 Motivation according to gender ………...……65
Table 30 Participants’ reasons for choosing their program………...……. 66
LIST OF FIGURES
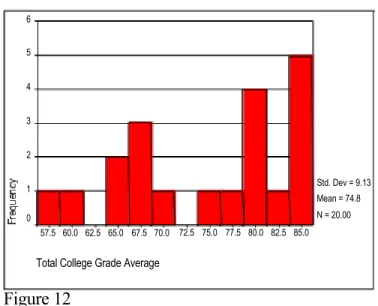
Figure 1 510 / 520 average by program ……….… 50 Figure 2 College average by thinking styles (forms) and program of study …... .. 54 Figure 3 Concentration average by thinking styles (forms) and program ………. 55 Figure 4 Concentration average by thinking styles (forms) ………. 55 Figure 5 570 grade averages according to thinking styles (forms) ………... . 56 Figure 6 Concentration average by thinking styles (function) and program ……. 58 Figure 7 Concentration average by thinking styles (levels) and program ……... .. 58 Figure 8 Concentration average by thinking styles (orientations) and program ... . 59 Figure 9 Concentration average by thinking styles (ideologies) and program ….. 59 Figure 10 Academic performance for Fine Arts students ……… 74 Figure 11 Academic performance for Business Administration students ……...…. 74 Figure 12 Academic performance for Illustration & Design students ………...….. 75
INTRODUCTION
In recent years, there has been a consistent focus on improving student success across all levels of the educational system. Since the Illustration & Design program at Dawson College is the only program of its type in Quebec, students with artistic talent who want to earn a living as illustrators have no real other choice locally. Because there are twice as many applicants as there are available seats, it is crucial to select those with the greatest chances of success, both in the program and in their chosen career. Once the factors contributing to student success in this program are identified, the admission process should be designed in order to admit those applicants who demonstrate the characteristics most closely related to the identified predictors, therefore increasing the success rate of not only the individual students, but also the entire cohort.
1. BACKGROUND INFORMATION
During the last decade, the faculty of the Illustration & Design program at Dawson College have been contemplating the admissions process and trying to design entrance criteria that would maximize the chances of student success in the program. For many years, acceptance into the program has hinged on a Portfolio Evaluation Score, which consisted of a 50 % mark given for the presentation and contents of a portfolio (following specified criteria) and another 50 % mark for a drawing test of a still life or part thereof. Although many programs specify a minimum High School average as an entrance requirement, the Illustration & Design program requires no more than the college’s basic admission criterion of a 65 % High School average. However, by means of promotional mailers distributed to
Screening for success in visual arts 14
counsellors throughout the province, potential applicants are encouraged to complete the Art 512 course at the High School level prior to applying to the program.
At the close of the 2004-2005 academic year, when comparing Portfolio Evaluation Scores of the current graduating group with their final marks, it was noticed that those who had the highest Portfolio Evaluation Scores at admission also did well in their concentration (Illustration & Design or program-specific courses) marks (Trahan, 2005). However, the correlations of highest significance proved to be those of High School grades and of Average College Grades, implying that students’ achievement in High School was more predictive of academic success in college than any other isolated factor. This finding led to this investigation of which other factors, if any, can serve to best predict success in this visual arts program, and which could possibly be extrapolated to other visual arts programs.
CHAPTER ONE
REVIEW OF THE LITERATURE
Since student success has been at the heart of educational debates for years, a large number of studies have been undertaken to determine the factors that contribute to student success. This knowledge can be used to more effectively teach the students, and to predict graduation and retention outcomes more accurately.
In the general academic environment, many factors contribute to success in post-secondary education. Some factors pertain to prior experience, such as High School performance (Noble & Sawyer, 1989; Wade & Walker, 1994; Skidmore, 2003), failures or successes in certain academic fields, self-efficacy, etc. (Urdan, 2004). Other factors consist of present circumstances and characteristics such as a student’s socio-economic status, parental pressures, level of schooling, and cultural factors but can also be greatly influenced by personality traits such as learning styles (Woolley, 2005), thinking style and personality type (Zhang, 2005), as well as level of motivation (Breen & Lindsay, 2002). Even students’ perception of the future or the economic shifts in industries can have a bearing on their level of involvement and hence their ultimate success in a specific field of study.
1. ARTS - A NECESSARY PART OF THE CURRICULUM
In the United States, since the 1990’s there has been a movement to reform the educational system. Much of the research done to this end concluded that incorporating the teaching of the arts as part of the curriculum not only enhanced students’ potential as students but as citizens as well (Critical Links, 2002).
To support these conclusions, ‘Americans for the Arts’ (2004) makes the following claims:
Screening for success in visual arts 16
1. Students who participate in arts for a minimum of 3 hours/day for 3 days/week for a full year are fourfold more recognized for academic achievement;
2. Students who participate in arts for a minimum of 3 hours/day for 3 days/week for a full year are fourfold more likely to win awards for essay or poem writing; 3. Arts education “strengthens student problem-solving and critical thinking skills, adding to overall academic achievement and school success”;
4. Art education contributes to students’ development of “craftsmanship, quality task performance, and goal-setting--skills” ;
5. Art education contributes to development of the mind and body, reflection, higher level thinking and fosters active learning;
6. Art education stimulates imagination, cognitive skills, creative skills, and critical thinking;
7. Art education fosters the development of life skills, informed perception, articulation, problem solving, and decision-making; it builds self-confidence, self-discipline and responsibility. (Americans for the Arts, 2004,
http://www.americansforthearts.org).
Similarly, H. Gardner (1985), a psychologist from Harvard University best known for his theory of multiple intelligences (linguistic, logical/mathematical, spatial, musical, bodily kinaesthetic, interpersonal, intrapersonal, naturalist, and possibly existentialist), claims that all forms of intelligence are equally important. When exploring the roles of intelligence and creativity in the development of learning, he concluded that arts education played a major role in the development of basic cognitive skills. He proposed that when teachers only teach to the linguistic and logical-mathematical domains, they actually deprive students and by extension, limit their scope of intelligence.
Finally, E. Oddleifson, (a founding member of the Center for the Arts in the Basic Curriculum in Washington, DC.) voiced his concern in reaction to a movement from schools in the US to cut back on the arts in order to strengthen their base
Screening for success in visual arts 17
curriculum. He stated, “The arts represent forms of cognition every bit as potent as the verbal and logical-mathematical forms of cognition that have been the traditional focus of public education.” (Oddleifson, 1991, p.46)
Brain research has also shown how the arts may involve the neurological functions of the brain, resulting in greater learning across the curriculum. Nobel Prize winner Dr. Robert Sperry studied the “analytical, verbal, and sequential thought patterns of the left hemisphere” as well as the “creative, sensory, and global thinking patterns of the right hemisphere.” He concluded that “when left and right hemispheric processes are used in tandem, learning and retention increase" (MAETF, 1990, p4). By integrating the arts into the traditional curriculum, both hemispheres of the brain are engaged in the learning process, and the inter- hemispheric functioning of the brain itself is neurologically strengthened (MAETF, 1990; Begley, 1996).
Much recent research has also shown that integrating arts into the school curriculum fosters learning, self-discipline, risk-taking, creative and critical thinking, problem solving, teamwork, and communication. The Arts Education Partnership’s (AEP) Task Force on Research commissioned James S. Catterall (of the Imagination Group at the University of California at Los Angeles), Lois Hetland (of Project Zero at the Harvard Graduate School of Education), and Ellen Winner (of Project Zero at the Harvard Graduate School of Education and the Psychology Department at Boston College) to look at recent research in five art form areas: dance, drama, music, visual arts, and multi-arts. They summarized the effects of the arts in the education of children by compiling information from over 60 different research studies. They, also, found that controlled studies revealed “a powerful, positive relationship between study in the arts and other academic subjects, attitudes, and behaviours.” (Critical Links, 2002) As an example, when investigating the data from 2500 students who had participated in the National Educational Longitudinal Study, and who had been followed from grades 8 to 10, researchers found that students who
Screening for success in visual arts 18
had been involved in an art-rich curriculum had better grades than those with low arts involvement. Students with high arts involvement were also less likely to drop out, watched less television, showed greater involvement in serving the community, and had a more positive self-concept (Catterall, 1998 in Critical Links, 2002).
Therefore, one could surmise that students who receive art education would perform better academically in any discipline or subject. If we accept this conclusion, why is previous experience in art courses not a requirement of art schools and programs? For that matter, why is it not a requirement of education in general?
2. GRADE-POINT AVERAGE AS PREDICTORS
When investigating the multitude of schools offering post-secondary education in the visual arts, a standard criterion emerged. Most visual arts programs screen their applicants by means of a portfolio of work, usually within the confines of an interview with a designated person or body of evaluators/advisors. Usually, a High School diploma is required as well. Most do not state any specific requirements for prior art courses, although some mention these as ‘recommended’ courses and emphasize that they will not be used for selection purposes. For example, the Ottawa School of Art lists as admission requirements: Grade 12 diploma or equivalency, application fee, portfolio presentation and an interview with the Diploma Program Advisor. No mention is made of a minimum grade required except for the High School diploma, nor is there any requirement for a specific art background. Other well-known schools, such as Ontario College of Art (OCA) and the Dundas Valley School of Art (DVSA), have the same requirements. Although some may require a minimum high school average, these are normally substantially lower than the requirements for the other programs they offer.
Screening for success in visual arts 19
However, in the last few years, there has been a change in attitude in some recognized art schools. The Art Institute of Toronto mentions only a High School graduation or a General Education Diploma (GED) as a prerequisite for admission. In 1997, the Pratt Institute changed their admission policy to focus more on academic achievement rather than solely on portfolios. Similarly, in 2004, Brock University posted their new admission requirements, primarily selecting students based on a 75 % high school average, and only subsequently selecting visual arts applicants based on a portfolio and interview process. Rather than increasing their demand for more art preparation, most schools are pre-selecting students by means of prior academic achievement scores.
This more recent development could result from prior studies claiming that high school averages were the best determinant of post-secondary achievement (Noble & Sawyer, 1989; Skidmore, 2003; Trahan, 2005; Wade & Walker, 1994). One of these studies by Wade and Walker (1994) tested for the effect of five academic and non-academic parameters on the performance of honours students at Southern University-Baton Rouge by means of their cumulative grade point average. They determined that high school grade point averages were the most consistent predictors of college success. Such measures as standardized tests of academic achievement, such as the American College Test (ACT), or the Scholastic Aptitude Test (SAT), had previously proven to be reliable predictors of college achievement (Noble & Sawyer, 1989).
More recently, in 2003, Robert L. Skidmore from Morehead State University conducted a study on the “Proximal Factors Predicting Student Performance in a Self-Paced College Psychology Course.” He studied 149 students using self-report measures to assess motivational orientation, learning strategies, procrastination, and perceptions of daily hassles in order to predict student engagement in a self-paced introductory psychology course (122 of whom completed the course). In addition to a demographic survey, four other surveys were administered to measure the above-
Screening for success in visual arts 20
mentioned constructs. In agreement with Walker & Wade (1994), only high school GPA proved to be a significant factor in distinguishing early from late course completers (Skidmore, 2003).
Even if these investigations did not specifically focus on visual arts programs, they were nevertheless studying diverse subjects and programs and the results seem to extrapolate to the college experience in general. High School grade point averages appear to be the latest trend in admitting students into higher education, regardless of the program.
3. GENDER EFFECTS
Since researchers are aware that other factors affect academic achievement, they continue to investigate other predictors of success. Another such factor found to be significant has been that of gender. Several studies concluded that males were significantly more likely to drop out than females at any educational level. (Lamb, 1994; Wyn and Lamb, 1996; Thiessen and Looker, 1999). Females perform better in school, demonstrate a lower frequency of failure, are more often selected for honours, and are more likely offered more advanced levels of classes (Looker, 1993). Females claim to like school better (Looker, 1993), appear to be better students and more cooperative, and have higher educational aspirations than males (Looker, 1997).
4. THINKING STYLES
In another direction of research, Li-fang Zhang, from the Faculty of Education at the University of Hong Kong, has recently published several studies pointing to the claim that various thinking styles can predict academic achievement. Her theory follows in the footsteps of the research done by R.J. Sternberg who proposed a theory of thinking styles where he specifies that styles are not abilities but
Screening for success in visual arts 21
preferences in how people choose to use their abilities. Sternberg also calls this a theory of mental self-government because, as he contests, people operate in a similar way as governments do; they govern themselves the way governments do for communities or countries. He claims that people opt for various preferences in their daily functioning. A legislative person will prefer to create their own ideas and to self-dictate what and how they do things. An executive person will prefer to follow the dictates of others. A judicial person will tend to judge others’ ideas. Sternberg offered 13 various thinking styles and explained that people are generally not governed by only one but rather, by a combination of thinking styles. The following chart lists Sternberg’s 13 thinking styles and how these are reflected in people’s preferences when approaching tasks (taken from Zhang & Sternberg, 2005):
Table 1
Thinking styles according to Sternberg’s theory of mental self governance Thinking Will prefer to work on tasks:
Executive With clear instructions and structures
Legislative That require creative strategies and like to choose their own activities Judicial That allow them to evaluate and judge the performance of others Monarchic That allow complete focus on one thing at a time
Hierarchic That are multiple but prioritized according to their own valuing of the tasks Oligarchic That are multiple with multiple objectives but without setting priorities Anarchic That would allow flexibility as to what, where, when and how one works Global Allowing to pay more attention to the overall picture and to abstract ideas Local That require working with concrete details
Internal That allow them to work as an independent unit External That allow for collaborative ventures with others Liberal That involve novelty and ambiguity
Screening for success in visual arts 22
Based on Sternberg’s theories, Zhang conducted studies in Hong Kong among school children (Zhang, 2001a) as well as on university students (Zhang, 2001b; Zhang & Sternberg, 1998). One such study examined 131 boys from a Catholic High School and 119 girls from a Protestant girls’ school, where participants’ scores on the Thinking Styles Inventory (Sternberg & Wagner, 1992, in Zhang, 2004) were gathered to predict achievement in sixteen different academic subjects. Variables such as age, gender, school class level and performance on the Sternberg Triarchic Abilities Test (Sternberg, 1993, in Zhang, 2004) were controlled. The results of the participants’ scores were divided into the various thinking styles and correlated with their achievement in specific disciplines. Thus, a significant relationship was found between students who preferred a hierarchic style of thinking and achievement in social sciences and humanities. Similarly, a judicial thinking style correlated with achievement in the natural sciences, and a monarchic style correlated with achievement in design and technology.
Interestingly, in another research study, Zhang (2005) delineates three personality types (see Table 2 below). She describes Type I, the ‘artistic’ career personality type, as using a holistic mode of thinking and a divergent thinking intellectual structure. Type I is also delineated as having a perceptive and intuitive personality, a concrete random mind and an innovation decision-making style. Zhang also claims that while being field independent in perceptual style, they demonstrate a combination of legislative / judicial / global / hierarchical thinking style. Despite the fact that Sternberg (1993) and Zhang (2004) had correlated designing with monarchic thinking, in this more recent study by Zhang, the monarchic thinking style was attributed to a more conventional career personality type. The following chart illustrates a comparison of the various intellectual styles according to Zhang (modified from Woolley, 2005).
Screening for success in visual arts 23
Table 2
Personality types according to Zhang (Wooley, 2005)
TYPE I TYPE II TYPE III
Learning approach Career personality type Mode of thinking Personality type Mind style Decision-making style Conceptual tempo Intellectual structure Perceptual style Thinking style Deep Artistic Holistic Intuitive, perceiving Concrete random Innovative Reflective Divergent Field independent Legislative, judicial, global, hierarchical, external, liberal Surface Conventional Analytic Sensing, judging Concrete sequential Adaptive Impulsive Convergent Field dependent Executive, local, internal monarchic, conservative, Achieving Realistic, investigative, social, enterprising Integrative Thinking, feeling, introverted, extroverted Abstract random, abstract sequential Oligarchic, anarchic, internal, external
Other studies found a significant relationship between certain thinking styles and creativity (Jacobson, 1993; Kim and Michael (1995), for instance, identified a relationship between creativity measures and thinking style preferences and found that those demonstrating a thinking style associated with right-brain dominance tended to perform better on creativity measures than those with either left-brain or integrated-brain dominance.
Screening for success in visual arts 24
In Zhang's cross-cultural study of students’ thinking styles (1999), she concluded that legislative and liberal styles are creativity-relevant styles, but that there was a negative relationship between the artistic type and the executive, local and conservative thinking styles. In a later study, she added that thinking styles requiring conformity (conservative), respect for authority (executive), and a sense of order (hierarchical) correlated positively to academic achievement, whereas those which were creativity-generating (legislative and liberal styles) contribute negatively. For students in the US, those demonstrating executive thinking styles (preferring to be guided by existing rules) were those demonstrating greater academic achievement scores (Zhang, 2004).
The study also found that Pearson correlation analysis shows that external types have significant positive relationship with legislative, judicial, hierarchical, oligarchic, anarchic, global, external, and liberal, but a negative relationship with executive, internal and conservative. Internal types have significant negative relationship with legislative, judicial, hierarchical, oligarchic, anarchic, global, external, and liberal, but a positive relationship with executive, internal, and conservative. (Yang, 2004),
In relation to artistic types, Zhang also mentions that ‘field independence’ relates to styles that are creativity-generating and are associated with higher levels of cognitive complexity. She concludes that Type I intellectual styles reflect the positive values sought after by academic fields (e.g., higher levels of cognitive development, higher self-esteem). On the other hand, Type II styles are usually linked to negative values (e.g., lower levels of cognitive development, lower self- esteem, and neuroticism or a tendency to experience negative emotional states). Type III styles are said to be less stable as they depend on the task being done or the person’s feelings while approaching the task. Therefore, it appears that, using Zhang’s thinking styles, those categorized as ‘Type I’ style should be the target of visual arts programs, or any program, if one aims at predicting academic success.
Screening for success in visual arts 25
5. LOCAL FINDINGS
Notwithstanding all the previous schools of thought, in August 2005, research was undertaken to investigate which factor(s) most contributed to student success specifically in the Illustration & Design program at Dawson College (Trahan, 2005). This correlational study looked at the existing data for the Illustration & Design program from four cohorts (209 students admitted to the fall 2000, 2001, 2002, and 2003 academic years). It analyzed the relationship of High School average marks, gender, prior art instruction, and portfolio scores with the students’ College averages (as a determinant of college success). Consistent with the Dawson College’s Institutional Research findings (Dawson, 2005) and other gender related studies (Looker, 1993; Corbett, 2005), females showed better success rates than males. Although correlations were significant at the 0.01 level for portfolio scores, High School (Secondary V) averages as well as for gender, the highest correlation was for High School averages. Although much research in the U.S. has pointed to the significant impact of art in High School on students’ academic achievement in general (Critical Links, 2002), the most unexpected finding in this particular study was that previous art instruction appeared to have no significant effect on either the concentration average or College grade average.
In another small study, entitled ‘Promoting Student Success - A Focus Group’, Taylor & Trahan (2005) investigated factors contributing to student success in two of Dawson’s career programs: Community Recreational Leadership Training (CRLT) and Illustration & Design. Six third year students (3 from each program) were interviewed to determine what they perceived as factors contributing to their success in their respective programs. Analysis of the data showed that successful students are those who are prepared and correctly informed, talented and passionate about their field, in addition to being intrinsically motivated and committed to the courses. The data analysis pointed to three conclusions, one of which is that criteria
Screening for success in visual arts 26
for acceptance in a career program “should involve factors such as volunteer experience, interest, and motivation to want to be there” (Taylor & Trahan, 2005).
It appears that no one single factor contributes to college success. In addition to the previously mentioned contributors such as art instruction, high school grades, gender, intrinsic motivation associated with their field of study, one could add many more: socio-economic status, cultural background, living arrangements, etc. However, from analyzing such a multitude of variables, it appears that some factors are more significant than others. It is incumbent on educational institutions, then, to target the most appropriate predictors and maximize the potential for student success within their institution, which translates to better life-long learning and empowerment for the individual student as well.
Apart from the local studies done on the Illustration & Design program, there seemed to be a gap in the body of scholarship focusing on predicting success specifically in visual arts. Therefore, it was imperative that some research endeavoured to focus on this field.
CHAPTER TWO
FORMULATION OF THE PROBLEM
More specific to visual arts, and not ignoring the studies pointing to the types of intelligence or the inclusion of art in high school to develop other transversal skills, it was still not clear how one could screen for success in a visual arts program. Certainly, including a portfolio component in admissions policies could not be eliminated as this is a means to measure or assess an applicant’s artistic skills and prior art experience. However, portfolios do not tell the entire picture. At times these can also be misleading as students select what they want to portray, and the work shown usually gives no indication of how long the artwork took, with what external help or guidance, or if it was entirely done by the students themselves. Furthermore, although drawing skills are essential for a career in visual arts, if students are skilled but not intrinsically motivated to want to persevere in it, retention within a program is not assured. Therefore, how could we test for intrinsic motivation? Survey questionnaires could investigate: how and when students do their art; what activities they tend to persist in or conversely give up quickly, which areas students feel they are good at, and which they feel is their weakness. Furthermore, sketchbooks could determine the amount of invested time students put into their art, by considering the volume and/or the dates.
Considering that intrinsic motivation appears to be directly related to academic achievement (Lepper, 2005), that successful career students are those who ‘really want to be in their program’ (Taylor & Trahan, 2005), and that the level of maturity may have an effect on student motivation, surveys could investigate if and why certain students are more motivated than others are. One should examine whether those who apply to this program (Illustration & Design) are applying to the only program they truly want to be in, whether they have always been driven towards this type of activity (namely the visual arts and related activities) or whether
Screening for success in visual arts 28
they simply chose this program because they felt it would be easier than more academic subjects. A survey questionnaire should prove beneficial to distinguish which applicants choose Illustration & Design as only one of many options or as a career choice because of their passion for art. Investing in a longitudinal study to look for relationship between applicants whose only desire is to study Illustration & Design and their academic achievement in the program, may determine if those who truly desire to be in the Illustration & Design program are indeed those who perform best. A positive result could imply that entrance requirements should systematically involve a component to inquire into applicants’ reasons for choosing Illustration & Design.
Although, academic achievement in High School can also govern a measure of intrinsic motivation (if students consistently do well, their self-efficacy should be enhanced), studies seem to point to certain thinking types as having predispositions that can predict achievement in artistic fields (Zhang, 2004). In addition to a survey questionnaire, a personality type test could be included to establish if, as Zhang claims (2005), those who score highly on the Type I (Artistic) personality styles are indeed those who perform best and consequently are best suited for this career. If a relationship is found between those who are categorized as Type I personality styles and those who demonstrate greater achievement in their concentration (Illustration & Design courses), then this type of testing could also be included in the admission process. Furthermore, positive relationships could add support to Sternberg and Zhang’s theories and could be applied in the general profiling of students not only in visual arts careers, but also for other career programs.
In addition, no investigation has yet differentiated between students applying directly from high school, applicants who had previously studied in other programs in the same or other colleges, and those who had been in the work force before applying to Illustration & Design.
Screening for success in visual arts 29
Although several mature students apply while studying at a university, many apply from the work force. From anecdotal evidence, it has been observed that many members of faculty hold the perception that mature students demonstrate a more serious commitment to their studies, greater motivation, and interest in their learning. Assumptions are made that this higher level of motivation can be attributed to the fact that some mature students have exerted greater effort to enter this program. Some had to forfeit full time employment in order to devote their time to a full-time three-year program. Others had time to experiment with other fields of education, and as a result, have a stronger conviction that their chosen field of study is the right career path. One could argue that those who come directly from the work force may have left school for quite some time, and may have gone directly in the work place from High School because they might not have been academically oriented. Nevertheless, mature applicants who have experience working for menial wages may strive to achieve higher goals and put greater effort in order to increase their employment potential upon graduation. This could positively affect their motivation, which, in turn, could translate into greater academic success.
Consequently, to begin addressing the lack of research related to student success in visual arts, studies were necessary to determine if the above-mentioned variables have a significant effect on student success in their program. Firstly, it was necessary to investigate whether mature students perform better in this program than those who apply directly from High School. Secondly, it would be useful to determine if those with the highest ‘degree of wanting to be in the program’ are those who perform best. Thirdly, a testing of the typical profile of visual arts students and a correlation with their college grades could help determine if those with Type I thinking styles perform better that Type II or III (Zhang, 2005). Lastly, an analysis could be done to see whether age, as a measure of the level of maturity, has any bearing on students’ level of academic performance in this program. The implications are that the admission policies for Illustration & Design at Dawson
Screening for success in visual arts 30
should be redesigned to better screen the applicants and ensure that they have the greatest chances of success in their college experience.
1. RESEARCH QUESTIONS
In considering the issues discussed above, the questions that have provoked this research endeavour are: Why do students choose Illustration & Design as their career choice? If they have chosen Illustration & Design because they are passionate about the field, do they perform better academically than those who chose this program for other reasons? Is there a personality type that can be identified as being most compatible with the performance required in Illustration & Design? In addition, are there particular thinking styles most predictive of student success in Illustration & Design?
Extrapolating from these questions, the researcher posed four hypotheses. First, students choose Illustration & Design because they are passionate about making a living doing art. It is assumed that the student’s passion motivates them and is determined by personal choice as opposed to being directed by external factors or people. Second, students who choose Illustration & Design because they are passionate about making a living doing art, will perform better academically in college. Third, students who score highest on the Type I personality style will perform better academically than those with other personality types (referring to Type I, II, and III as defined by Zhang, 2005). Fourth, students who demonstrate a monarchic thinking style will perform well in design (compared with students demonstrating other forms of thinking styles) but not necessarily in general studies (Sternberg & Zhang, 2004).
Although not specifically part of the above hypotheses, gender was also considered in relationship to its effects on academic performance, thinking styles and personality types. Other variables, such as mother tongue, age, level of previous
Screening for success in visual arts 31
schooling, and reasons for choosing the program were measured and were to some extent taken into consideration, when deemed appropriate. Finally, the place where the data was collected (Dawson College) and the age of the participants (approximately 17-24) were factors taken into consideration.
CHAPTER THREE METHOD AND DESIGN
This study was of an exploratory nature investigating the reasons why applicants chose Illustration & Design as their career choice and attempted to profile the typical applicant in relation to their personality types (according to Sternberg & Zhang, 2004).
1. SAMPLE
As this study aimed to establish what factors determine success in Illustration & Design, it was important to select participants in this program. Therefore, the sample consisted of all current students in the Illustration & Design program (128 students). Two additional groups were studied to serve as comparison: one firstsemester class, a pre-university visual arts program ( Fine Arts, 23 students) and one first-semester class from a non-visual arts field (Business Administration, 20 students). The purpose of these two additional samples served to not only profile the students of these programs but determine if there is significant difference in the targeted variables (reasons for choosing this program, age, mother tongue, level of previous schooling, thinking style, etc.).
Participants ranged approximately between 17 and 24 years of age. The sample was heterogeneous, and although the gender distribution showed a greater number of females for the entire group of participants (58 % to 42 %), the Illustration & Design program showed more males than females (86 males and 67 females). As in previous studies (Trahan, 2005) participants were ethnically diverse (from 19 different countries of birth and speaking 27 different languages, 21 different mother tongues) and have varied socio-cultural backgrounds.
Screening for success in visual arts 33
2. DATA COLLECTION
Two surveys were used. The first survey was designed by the researcher and sought to collect demographic information from the participants as well as other pertinent personal characteristics (See Appendix A). The second survey consisted of the Sternberg & Wagner Thinking Styles Inventory (SWTSI), because it was available on line, free of charge and readily accessible. It was short and easy to administer within an existing introductory computer class (See Appendix D). The goal of the SWTSI survey was to determine which type of thinking style each student demonstrated. Focus groups were conducted to determine what prompted applicants to choose Illustration & Design at Dawson (See Appendix F). These were practical and convenient methods of getting qualitative data for the purpose of triangulation with the data collected from the demographic surveys, especially Question #32. Finally, the researcher used the College’s available statistics to correlate student grades with the data collected on independent and intervening variables (previously stated) obtained by the other methods.
3. INSTRUMENTS
The first survey (for survey instruments, see Appendix A), designed by the researcher, was administered to each of the various groups of participants. The objective of the survey was to determine what factors affected the participants’ choice of their program of study. Question 32 (an open-ended question) served as a validity check for students’ reasons for choosing their program as a career choice. Data collected from the two comparison groups (Fine Arts and Business Administration) were used to determine if there were similarities between visual arts programs (Illustration & Design and Fine Arts) or whether there were significant contrasts to other non-visual arts programs.
Screening for success in visual arts 34
The surveys were designed to ascertain demographic information: (age, province or country of birth, mother tongue, languages spoken, High School attended, type of High School, whether the applicant came directly from High School, from a post-secondary environment, or from industry, their socio economic condition, whether they live at home with their parents, on their own, must work to support themselves, have children and/or other responsibilities, information on their parents’ level of education, etc). For the purpose of this study, not all of these variables are taken into consideration, but may serve to inform the department for pedagogical decisions. Some questions required simple Yes or No answers, but others involved choices such as those that appear on Likert scales. Other questions investigated students’ or applicants’ ‘level of wanting’ to be in their program, what/who influenced them in their choice of Illustration & Design as a career choice, the role of parents, High School counsellors, peers, the influence of publicity, web search, etc., as well as what they prefer to do in their free time, with their friends? Certain results were recorded using nominal scales (Ex: reasons given for their choice of program were described as ‘passion’, ‘interest’, ‘program reputation’, ‘personal traits’, etc. The responses were coded by the author as ‘intrinsic’ and ‘extrinsic’ and served as indices of their motivation. Finally, a single essay question (question #32 in the demographic survey) was included to ascertain why participants chose Illustration & Design (or their selected program of study) as their career choice. (For a complete list of questions, see Appendix A)
Thinking styles were assessed using an abbreviated form (65 items) of the Sternberg-Wagner Thinking Styles Inventory (TSI or SWTSI) which was, at the time, readily accessible online through Trent University. A longer version of this test is available through the LDRC site (http://www.ldrc.ca/projects/tscale/). A variation can also be taken with permission from the author’s book, Thinking Styles (Sternberg, 1997).This instrument has been examined against other inventories based on different theories of thinking (such as the Myers-Briggs Type Indicator) and
Screening for success in visual arts 35
resulted in the confirmation that it is a reliable and valid instrument for examining thinking styles (Zhang, 1999).
The abbreviated questionnaire included eight statements on each subscale (executive, legislative, judicial, global, local, internal, and external). The students used a scale of 1 to 7 to rank the degree to which the statements reflected their thinking styles. The following are examples of the types of questions included and, in brackets, the corresponding thinking style is indicated:
1. I tend to pay little attention to details. (Global)
2. I tend to break down a problem into many smaller ones that I can solve, without looking at the problem as a whole. (Local)
3. I enjoy working on things I can do by following directions. (Executive) 4. I like to check and rate opposing points of view or conflicting ideas. (Judicial) 5. I like situations where I can use my own ideas and ways of doing things. (Legislative)
6. When starting a task, I like to brainstorm ideas with friends or peers. (External)
7. I like to control all phases of a project, without having to consult others. (Internal)
Focus group interviews were conducted to determine what prompted applicants to choose Illustration & Design at Dawson. The researcher also investigated whether students believed that their personality types could affect their academic achievement. (See sample questions in Appendix F). These interviews were video taped, and the recordings were destroyed once transcriptions were complete.
Screening for success in visual arts 36
4. PROCEDURES
The first demographic survey was administered by the researcher at the Portfolio Evaluation Day to Term 1 (of Illustration & Design) in April 2006, prior to their admission to the 2006-2007 academic year, and in the first week of classes in the Fall 2006 semester to Term 3 and Term 5 students. Similarly, a modified survey (to accommodate different programs) was also administered in the first week of classes to Term 1 Fine Arts students as well as a selected class from Term 1 of a non-visual arts program, Business Administration.
During the first week of class, all of the above students (from the first, second and third year of Illustration & Design, first year Fine Arts and a first year class in Business Administration) were given a Thinking Styles Inventory questionnaire (see Appendix D) in their introductory class to a computer component of their program.
All students were given an explanation as to the purpose of the study and their right to abstain from participation. Those volunteering to take part in the study were directed to go online at site: http://www.trentu.ca/cgi-bin/SpNeeds/Profiler/ Profiler.pl (see sample questions in Appendix D). Participants were given 30 minutes of class time to complete the questionnaire and hand in a printout of the results. As many were not able to print the results immediately, they were authorized to print it at a later date and submit them via email. Results were tabulated and the data was inputted into the SPSS software (to determine correlation with college grades). One of the benefits of doing this survey was the immediate results supplied which gave not only the students thinking styles but also gave the participants information on how to succeed in their studies by means of specific learning strategies to incorporate in their study methods. Furthermore, the students were informed that if they included their email address on the consent sheet, they would be sent the results of the research via email. Once the data collection and analysis
Screening for success in visual arts 37
was complete, a document outlining the results of the research was written and distributed to all participants who had expressed an interest.
Focus group interviews were scheduled to be conducted in September 2006 with select students from the various programs to determine what prompted applicants to choose their program of study. However, these had to be rescheduled to the following semester (March 2007) as the college experienced a tragic shooting in September 2006 which greatly disrupted not only this research but the entire student and faculty life for a substantial amount of time.
The focus group participants were selected from first and second year and, as can be seen from the description below, were chosen so as to represent both students coming directly from High School and those who had prior post-secondary schooling, as well as representing various cultural backgrounds, language, and gender, etc.
For one focus group (March 13, 2007), the researcher selected six (6) first year Illustration & Design students, three females and three males equally from each of the two starting cohorts. They were chosen in order to have the widest possible variety of opinions, cultural background and experience. The three females were of Asian, Israeli and Canadian origin respectively, while the males were of African American, Philippino and Canadian origins. All participants spoke a minimum of two languages, with French, English, Tagalog, Hebrew and Korean mother tongues.
One female participant was a 27 year old mature student, born in Israel, who spoke four languages. She had extensive educational experience, having been to trade school, completed a DEC in Fine Arts at Dawson, had attended university and had also worked in the industry. The second female participant, of Korean origin, had been in a Performing Arts high school, in dance, then had completed one year of Visual Arts within the Creative Arts and Letters program ( C.A.L.L.) at Dawson
Screening for success in visual arts 38
before requesting a program transfer into Illustration & Design. The third female participants was bilingual and born in Canada, had done one year in the Commerce program at Dawson, then had been accepted to both York and the University of Toronto , but decided to pursue art instead.
One male, bilingual and born in Canada, had graduated from High School five years before, had completed grade 12 in a Quebec High School, and then attended the Fine Arts program at the Ontario College of Art and Design in Toronto. He had not found satisfaction in this program and returned to Montréal, took a year off, then completed one year in the Graphic Design at Dawson before transferring into the program. The second male, of mixed ancestry, whose mother tongue is French but also is fluent in English, had attended the Fine Arts program at Rosemont College but left it, unsatisfied and worked as a beta tester prior to applying to Illustration & Design. The last male participant, was born in the Philippines, speaks Tagalog as his mother tongue and also speaks French and English fluently. He had not successfully completed High School, but subsequently completed his Math and French in an Adult Education facility, then took one year off before applying to Illustration & Design.
The second focus group (March 12, 2007) was comprised of six second year Illustration & Design students, 3 females and 3 males also taken equally from each cohort group. The first female was a mature student, born in Canada but of Bengali origin and speaks 4 languages: Japanese, Bengali in addition to French and English. Prior to applying to Illustration & Design, she had been in Pure and Applied Sciences in McGill University but decided to redirect her studies as she felt that she would have more satisfaction pursuing a career where she could profit from her talents. The second is of French Canadian origin, born in Quebec, and comes directly from an entirely French High School environment. The third female is of English Canadian origin, bilingual, and applied to the Illustration & Design program directly from High School. One male, bilingual, born in Canada but of French West Indian
Screening for success in visual arts 39
origin, had completed one year of Fine Arts at Dawson and transferred into the Illustration & Design program. Another male was of Spanish origin, spoke 3 languages and was previously in a Pre-University Science program at Vanier College. The last male was of Chinese origin and spoke French and English in addition to Chinese, his mother tongue, and came directly from High School.
During these two focus groups, the researcher not only investigated the students’ reasons for choosing this program, but also whether students believed that their personality types could affect their academic achievement. (See sample questions in Appendix F).
5. DATA ANALYSIS
5.1. Qualitative
Qualitative data was collected by means of open-ended questions, one of which is included in the survey (see question #32 in Appendix A), as well as the discussions generated from the focus groups. This data was then evaluated by means of content analysis techniques described by Glicken (2003). Content of answers were grouped according to nouns and verbs, associated with the types of reasons for choosing Illustration & Design, and whether they demonstrated intrinsic or extrinsic motivation (see Appendices B and C for Data Grouping Charts and Membership Categorization Analysis Charts respectively).
5.2. Quantitative
Dawson College’s Fall 2006 and Winter 2007 student grades were used as well as any High School grades which were available. The college grades retained for analysis were the concentration average (or the average of the program specific courses only), the overall college average (or the average of all the college courses taken while in their present program), as well as any current English, French or
Screening for success in visual arts 40
Humanities grades listed on the college transcripts for the above mentioned semesters . In addition, 510/520 (Fine Arts specific) and 570 (Illustration & Design specific) courses were inputted separately in order to distinguish between ‘concentration’ courses in artistic programs from those of a non-artistic nature, as in the (410) Business Administration program.
The researcher performed a quantitative analysis of the student grades looking at correlations with several variables taken from the surveys (ex. Motivation operationalized as students’ reasons for choosing their program, age, mother tongue, level of previous schooling, thinking style, etc.). The variables and data were incorporated and analysed by means of the ‘SPSS® for Windows’ statistical software to determine the incidence and significance of recurrent patterns. Measures of central tendency, percentages, chi-squares, T-Tests, and the ANOVA test were used to analyse the data. A Pearson product-moment correlation was drawn using student grades accessible through Dawson College’s Institutional Research Department (existing grades in the database of all current, Term 1, 3 and 5 Illustration & Design students, as well as Term 1 students from Fine Arts and Business Administration) and for variables investigated through the questionnaires (reasons for choosing this program, age, gender, mother tongue, level of previous schooling, thinking type, etc). Upon request, the author is willing to make the tabulations of the raw data available.
Strength of correlations was interpreted and reported using the Davis convention (Davis, 1971). An alpha level of .05 was established a priori. Analyses were carried out to determine whether students who claimed to have passion and the sole desire to illustrate (or to be in the field they have chosen) were those with highest success rates in the program. Analyses were also carried out to determine whether students who demonstrated a Type I personality were those with highest academic success rates in the Illustration & Design program.
Screening for success in visual arts 41
6. ETHICAL CONSIDERATIONS
6.1 Privacy, confidentiality and consent
Although this research involved human participants, there were no ethical considerations to worry about as all participants acted on a voluntary basis, and their participation had no impact on their status in the program (for potential or current students). A statement of confidentiality and purpose was included with all communications / surveys / questionnaires. Participants were informed that their name would be included only on a cover page of the surveys along with a number. These cover pages were detached from all the questionnaires and kept in a safe place to ensure anonymity. They were told that the names were be used for the purpose of correlation of the collected data with the student grades. Only the researcher ever had access to their names. All participants were informed of their right to withdraw at any time. A signed consent form was required for all participants in a Focus Group (see Consent Form in Appendix F). All surveys and SWTSI results were destroyed once the data was tabulated and recorded.
Furthermore, an application to conduct this study was submitted to Dawson College’s Ethics Review Board and included a completed form signed by the research instructor, an informed consent and debriefing statement, a copy of all the instruments used, as well as a summary of the design and procedures used. The Ethics Review Board approved the research proposal on June 5th, 2006.
CHAPTER FOUR
PRESENTATION OF FINDINGS
1. DEMOGRAPHIC DATA FOR ILLUSTRATION & DESIGN, FINE ARTS AND BUSINESS ADMINISTRATION
Whereas students in Illustration & Design are evenly distributed as to gender, there were significantly more females than males in both Business Administration and Fine Arts programs (see Table 3). As predicted, except for a few outliers, most students surveyed in the Fall 2006 semester averaged 17-24 years old, with a mean (m) age of 20 years. However, first semester Illustration & Design students appear to be older than first semester Fine Arts students.
Table 3
Male / female ratio by program of study Program of Study Gender Male Female Totals Business
Administration Fine Arts % N % N 30 6 17.4 4 70 14 82.6 19 100 20 100 23 Illustration Total & Design % N % N 48.4 62 42 72 51.6 66 58 99 100 128 100 171 2. LEVEL OF MATURITY
A participant determined to be ‘mature’ consisted of anyone not straight out of high school (based on answers for ‘prior occupation’, or based on ‘year of birth’ or ‘student number’ according to year of entry). Therefore, a student was not deemed mature if he/she was a first year student and his/her student number (typically listed as