The AlborEX dataset: sampling of submesoscale features in the
Alboran Sea
Charles Troupin
1, Ananda Pascual
2, Simon Ruiz
2, Antonio Olita
3, Benjamin Casas
2, Félix Margirier
4,
Pierre-Marie Poulain
5, Giulio Notarstefano
5, Marc Torner
6, Juan Gabriel Fernández
6, Miquel
Àngel Rújula
6, Cristian Muñoz
6, John T. Allen
6, Amala Mahadevan
7, and Joaquín Tintoré
6,21GeoHydrodynamics and Environment Research (GHER), Freshwater and OCeanic science Unit of reSearch (FOCUS),
University of Liège, Liège, Belgium
2Instituto Mediterráneo de Estudios Avanzados (IMEDEA, CSIC-UIB), Esporles, Spain
3Institute for Coastal Marine Environment-National Research Council (IAMC-CNR) Oristano, Oristano, Italy
4Sorbonne Universités (UPMC, Univ Paris06)-CNRS-IRD-MNHN, Laboratoire LOCEAN, Paris, France
5Istituto Nazionale di Oceanografia e di Geofisica Sperimentale (OGS), Trieste, Italy
6Balearic Islands Coastal Observing and Forecasting System (SOCIB), Palma de Mallorca, Spain
7Woods Hole Oceanographic Institution, Woods Hole, MA, USA
Correspondence: Charles Troupin ([email protected])
Abstract. AlborEX (Alboran Sea Experiment) consisted of a multi-platform, multi-disciplinary experiment carried out in the Alboran Sea (Western Mediterranean Sea) between May 25 and 31, 2014. The observational component of AlborEx aimed to sample the physical and biogeochemical properties of oceanographic features present along an intense frontal zone, with a particular interest in the vertical motions in its vicinity. To this end, the mission included 1 research vessel (66 profiles), 2 underwater gliders (adding up 554 profiles), 3 profiling floats and 25 surface drifters.
5
Near real-time ADCP velocities were collected nightly and during the CTD sections. All of the profiling floats acquired temperature and conductivity profiles, while the Provor-bio float also measured oxygen and chlorophyll-a concentrations, col-ored dissolved organic matter, backscattering at 700 nm, downwelling irradiance at 380, 410, 490 nm, and photo-synthetically active radiation (PAR).
In the context of mesoscale and submesoscale interactions, the AlborEX dataset constitutes a particularly valuable source 10
of information to infer mechanisms, evaluate vertical transport and establish relationships between the thermal and haline structures and the biogeochemical variable evolution, in a region characterised by strong horizontal gradients provoked by the confluence of Atlantic and Mediterranean Waters, thanks to its multi-platform, multi-disciplinary nature.
The most recent version of the dataset is available at http://doi.org/10.5281/zenodo.1328238. 1 Introduction
15
The variety of physical and biological processes occurring in the ocean at different spatial and temporal scales requires a combination of observing and modelling tools in order to properly understand the underlying mechanisms. Hydrodynamical models make it possible to design specific numerical experiments or simulate idealised situation that can reproduce some Earth Syst. Sci. Data Discuss., https://doi.org/10.5194/essd-2018-104
Open Access Earth System
Science
Data
D iscussionsManuscript under review for journal Earth Syst. Sci. Data Discussion started: 3 September 2018
c
of these processes and assess the impacts of climate change. Despite the continuous progresses made in modeling (spatial resolution, parameterization, atmospheric coupling, . . . ), in situ observations remain an essential yet challenging ingredient when addressing the complexity of the ocean.
The perfect observational system would consist in dense array of sensors present at many geographical locations, many depths and measuring almost continuously a wide range of parameters. Obviously such a system is not the reality: researchers 5
have to rely on the combination of various platforms during a limited period of time, each platform measuring a given set of variables at different spatial and temporal resolutions, spatial coverage, accuracy and depth levels. We will refer to this as multi-platform systems, by opposition to experiments articulated only around the observations made using a research vessel. Further details can be found in Tintoré et al. (2013).
The western Mediterranean Sea is a particularly relevant region for multi-platform experiments, thanks to the wide range of 10
processes taking place and intensively studied since the work of Wüst (1961) on the vertical circulation: influence on climate (e.g., Giorgi, 2006; Giorgi and Lionello, 2008; Adloff et al., 2015; Guiot and Cramer, 2016; Rahmstorf, 1998) and sea-level change (e.g., Tsimplis and Rixen, 2002; Bonaduce et al., 2016; Wolff et al., 2018), thermohaline circulation (e.g., Bergamasco and Malanotte-Rizzoli, 2010; Millot, 1987, 1991, 1999; Skliris, 2014; Robinson et al., 2001), water mass formation and con-vection process (e.g., MEDOC-Group, 1970; Stommel, 1972; Send et al., 1999; Macias et al., 2018), mesoscale (e.g., Alvarez 15
et al., 1996; Pinot et al., 1995; Pujol and Larnicol, 2005; Sánchez-Román et al., 2017) and submesoscale processes (e.g., Bosse et al., 2015; Damien et al., 2017; Margirier et al., 2017; Testor and Gascard, 2003; Testor et al., 2018). Other recent instances of multi-platform experiments in the Mediterranean Sea were focused on the Northern Current (December 2011, Berta et al., 2018), deep convection in the Northwestern Mediterranean sea (July 2012–October 2013, Testor et al., 2018), the Balearic Current system (July and November 2007, April and June 2008, Bouffard et al., 2010) and coastal current off west of Ibiza 20
island (August 2013, Troupin et al., 2015).
Recently, the efforts carried out by data providers and oceanographic data centers through European initiatives such as SeaDataNet (http://seadatanet.org/) makes it possible the creation and publication of aggregated datasets covering the Mediter-ranean Sea (Simoncelli et al., 2014), upon which hydrographical atlas are build (e.g. Simoncelli et al., 2016; Iona et al., 2018b). These atlas are particularly useful for the description of the general circulation, the large-scale oceanographic features or for 25
the assessment of the long-term variability (Iona et al., 2018a). However their limitation to temperature and salinity variables (as of July 2018) and their characteristic spatial scale prevent them to be employed for the study of submesoscale features.
The AlborEx multi-platform experiment was performed in the Alboran Sea from from May 25 to 31, 2014, with the ob-jective of capturing meso and submesoscale processes and evaluating the interactions between both scales, with a specific focus on the vertical velocities. The observing system, described in the next section, is made up of the SOCIB coastal R/V, 2 30
underwater gliders, 3 profiling floats and 25 surface drifters, complemented by remote-sensing data (sea surface temperature and chlorophyll concentration). The resulting data set is particularly rich thanks due to the variety of sensors and measured variables concentrated on a relatively small area.
Section 2 strives to summarize the motivations behind the sampling and deployments. The presentation of the available data is the object of the Section 3.
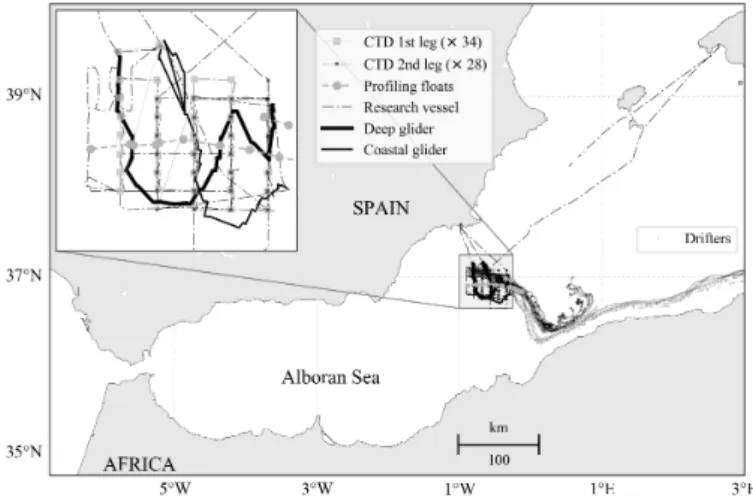
Figure 1. Area of study, positions and trajectories of the main platforms. The close-up view on displays the glider and the CTD measurements. 2 The AlborEx mission
The mission took place from May 25 to May 31, 2014 in the Alboran Sea frontal system (Cheney, 1978; Tintoré et al., 1991, see Fig. 1), scene of the confluence of Atlantic and Mediterranean waters. The mission itself is extensively presented in Ruiz et al. (2015) and the features and processes captured by the observations are discussed in Pascual et al. (2017). Olita et al. (2017) examined the deep chlorophyll maximum variation combining the bio-physical data from the gliders and the profiling 5
floats. The present papers focuses solely on the description of the original dataset, graphically summarised in Fig. 1). 2.1 General oceanographic context
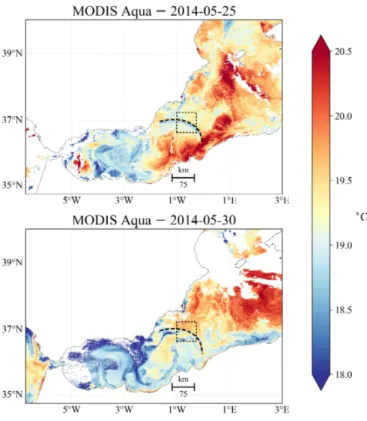
The definitive sampling area was not firmly decided until a few days before the start of the mission. Prior to the experi-ment, satellite images of sea surface temperature (SST) and chlorophyll-a concentration were acquired from the Ocean Color Data server (https://oceandata.sci.gsfc.nasa.gov/, last accessed August 3, 2018) in order to provide an overview of the surface 10
oceanic features apparent in the Alboran Sea. A well-defined front separating Atlantic and Mediterranean waters and exhibiting filament-like structures was selected as the study area (see rectangular boxes in Figs. 1 and 2).
The pair of images indicates that the front position slightly changed between May 25 and 30. An anticyclonic eddy centered
around 36◦30’N, 0◦30’W, according to altimetry data (not shown), slowly followed an eastward trajectory in the following
days. Other SST images during the period of interest (not shown here) displayed different temperature values near the front, 15
yet the front position remains stable. 2.2 In situ data
Whereas the remote sensing measurements helped in the mission design and the front detection, in situ observation were essential to fulfill the mission objectives. The different platforms deployed for the data collection are presented hereinafter. Earth Syst. Sci. Data Discuss., https://doi.org/10.5194/essd-2018-104
Open Access Earth System
Science
Data
D iscussionsManuscript under review for journal Earth Syst. Sci. Data Discussion started: 3 September 2018
c
Figure 2. Sea surface temperature in the western Mediterranean Sea from MODIS sensor onboard Aqua satellite corresponding to May 25 and 30, 2014. The dashed black line indicates the approximative position of the front based on the temperature gradient for the period 25–30 May. Level-2, 11 µm, night-time images were selected. Only pixels with a quality flag equal to 1 (good data) were conserved and represented on the map. Note that the same front position is used in the subsequent figures.
2.2.1 Research vessel
The SOCIB coastal research vessel (R/V) was used to sample the area with vertical profiles acquired though the CTD. Two distinct CTD surveys were performed on a 10 km × 5 km resolution grid, as depicted in Fig. 3: the first survey was run from May 26 to 27 and consisted of 34 casts along 5 meridional legs. The second survey took place from May 29 to 30 and was made up of 28 casts. The casts from both surveys were performed at almost similar locations in order to allow for detecting 5
changes between the two periods. On average the profiles reached a maximal depth of approximatively 600 m.
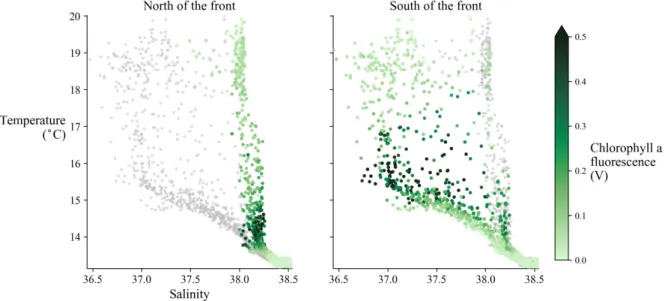
The distinct water properties on both sides of the front are evidenced by the T-S diagrams in Fig. 4, where the colors represent the fluorescence. The salinity range north of the front is roughly between 38 and 38.5, with the exception of a few measurements, and confirms the nature of the Mediterranean Water mass. The fluorescence maximum appears between 14 and
15◦C. South of the front the salinity range is wider while the temperature values are similar to the north.
10
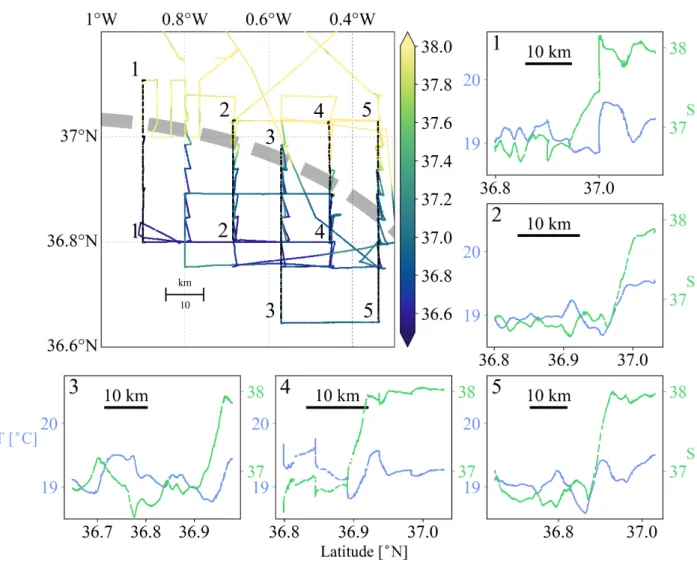
In addition to the CTDs, the R/V thermosalinograph continuously acquired temperature and conductivity along the ship track, from which near surface salinity is derived (Fig. 5). The R/V weather station acquired air temperature, pressure, wind
Figure 3. The CTD casts were organised in 5 legs that crossed the front and were repeated over 2 periods, at the beginning and the end of the mission..
Figure 4. The T-S diagrams are shown separately for the casts located north and south of the front (broad, dashed line) .
speed and direction during the whole duration of the mission. Direct measurements of currents were performed with acoustic Doppler current profiler and are presented in Sec. 2.2.5.
Earth Syst. Sci. Data Discuss., https://doi.org/10.5194/essd-2018-104
Open Access Earth System
Science
Data
D iscussionsManuscript under review for journal Earth Syst. Sci. Data Discussion started: 3 September 2018
c
Figure 5. The near-surface salinity (colored dots) measured by the thermosalinograph evidences the strong horizontal gradients, in agreement with the front position as obtained using the SST (broad, dashed line). The 5 subplots depict the temperature and salinity along select meridional tracks.
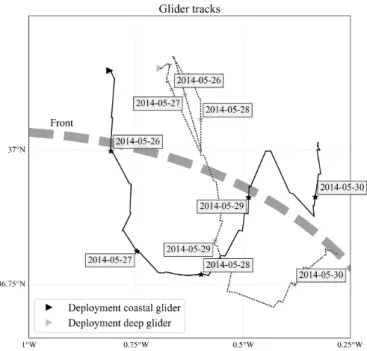
2.2.2 Gliders
To collect measurements addressing the submesoscale, two gliders were deployed on May 25 inside the study area. The coastal glider carried out measurements up to 200 m depth and the deep glider up to 500 m. The horizontal resolution was about 0.5 km for the shallow and 1 km for the deep glider. The initial sampling strategy consisted in two 50-km long, meridional tracks, 10 kilometers away one from the other, and to repeat these tracks up to 4 times during the experiment. However, due to the strong 5
Figure 6. Deployment positions and trajectories of the gliders. Different time instances separated by one day are indicated on the tracks to provide a temporal dimension.
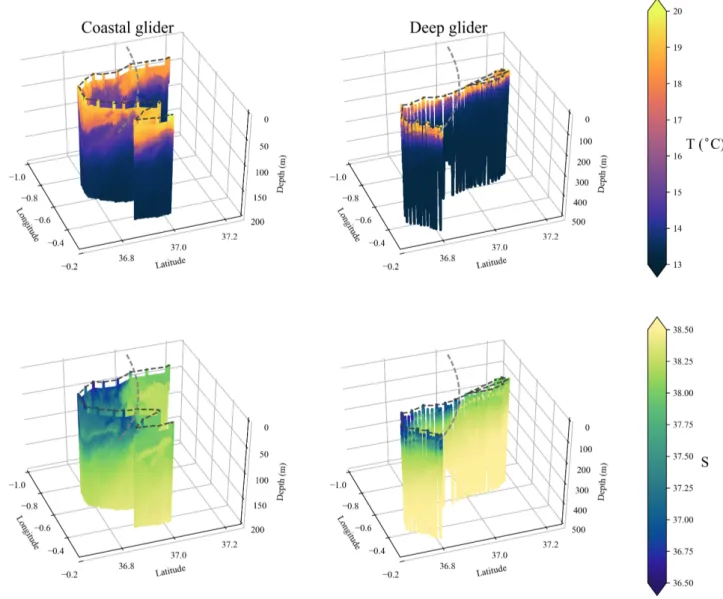
The total number of valid measurements (i.e., discarding the bad and missing values) acquired are 121513 for the deep glider and 226717 for the coastal. The mean vertical separation between 2 consecutive measurements is around 16 cm. Figure 7 displays the temperature and salinity sections obtained with the 2 devices. The high density of measurements makes it possible to distinguish small-scale features on both sides of the front, such as strong lateral gradients, subduction or filament structures. The gliders follow a 3-dimensional trajectory in the water column but for some specific usages it is sometimes more conve-5
nient to have the glider data as if they were a series vertical profiles. To do so, a spatial interpolation is applied on the original data, leading to the so-called Level-2 data, further described in Sec. 3.3.
2.2.3 Surface drifters
On May 25, 25 Surface Velocity Program (SVP) drifters were deployed in the frontal area in a tight square pattern with a mean distance between neighbor drifters around 3 km. In the Mediterranean Sea, they have been shown to provide information on 10
the surface dynamics, ranging from basin scales to mesoscale features or coastal currents (Poulain et al., 2013). Almost all the drifters were equipped with a thermistor on the lower part of the buoy to measure sea water temperature.
11 out the 25 drifters, especially those deployed more to the south, were captured by the intense Algerian Current and
followed a trajectory along the coast until a longitude about 5◦30’E. The other drifters were deflected northward about 0◦30’E,
then veered northwestward or eastward and described cyclonic and anticyclonic trajectories, respectively. Interestingly, all the 15
Earth Syst. Sci. Data Discuss., https://doi.org/10.5194/essd-2018-104
Open Access Earth System
Science
Data
D iscussionsManuscript under review for journal Earth Syst. Sci. Data Discussion started: 3 September 2018
c
Figure 7. Temperature (top) and salinity measured by the two gliders. The approximative front position at the surface is shown as a dashed, grey line.
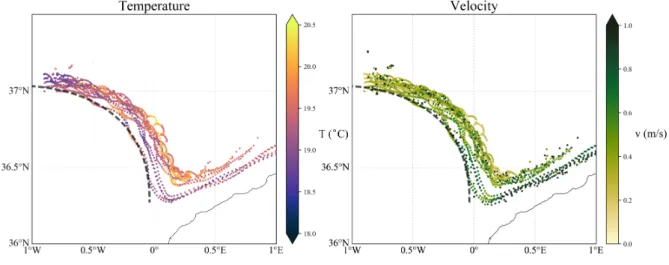
drifters exhibit a trajectory close to the front position deduced from the SST images, until they encounter the Algerian Current (Fig. 8).
On average the temporal sampling resolution is close to one hour, except for 2 drifters for which the intervals are 4 and 5 hours. The velocities are directly computed from the successive positions and highlight the strength of the Algerian Current with velocities on the order of 1 m/s (Fig. 9).
Figure 8. Surface drifter trajectories. For the sake of simplicity and clarity, the temperature, when available, is only shown for the duration of the mission.
Figure 9. Drifter temperature (left-hand side) and velocity in the area of study. 2.2.4 Profiling floats
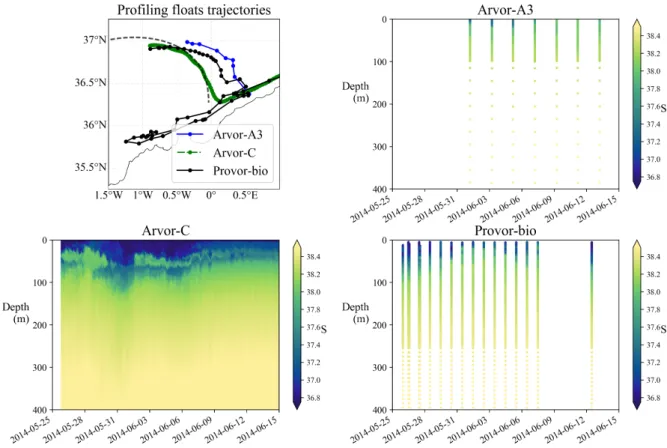
Three profiling floats were deployed in the same zone as the drifters, on May 25 (see Tab. 1). Their configuration depends on the float type: the Arvor-C has higher temporal resolution (hours) and does not go much deeper than 400 m. The A3 and Provor-bio platforms are usually set to have cycle length between 1 and 5 days, with the bio reaching maximal depth on the order of 1000 m. The floats constitute an essential tool in order to monitor the mesoscale (Sánchez-Román et al., 2017). The 5
trajectories (Fig. 10) clearly show that profiles were acquired in the frontal area, before the floats were eventually captured by the Algerian Current.
Earth Syst. Sci. Data Discuss., https://doi.org/10.5194/essd-2018-104
Open Access Earth System
Science
Data
D iscussionsManuscript under review for journal Earth Syst. Sci. Data Discussion started: 3 September 2018
c
The Arvor-C trajectory closely follows the front position until a latitude of 36◦30’N, accounting for 455 profiles in the vicinity of the front. This is probably due to its configuration: its high frequency temporal sampling makes it possible to spend more time in the near-surface layer and hence the float follows the front better than the 2 other float types. Its last profile was
taken on June 14, 2014, at an approximative location of 36◦15’N, 4◦E, then it drifted at the surface.
The 2 Arvor-type floats provided temperature and salinity profiles. In addition to T and S, the Provor-bio platform measured 5
biochemical and optical properties: colored dissolved organic matter (CDOM), chlorophyll-a concentration, backscattering (650 nm), dissolved oxygen concentration and downwelling irradiance (380, 410, 490 nm) and photosynthetically active radi-ation (PAR). The profiles were performed around local noon time and were used in combinradi-ation with the glider measurements to study the deep chlorophyll maximum (DCM) across the front (Olita et al., 2017).
Figure 10. Profiling floats trajectories (top-left panel) and salinity from May 25 to June 15, 2014. 2.2.5 Current profiler
10
The Vessel Mounted-Acoustic Doppler Current Meter Profiler (VM-ADCP) operating at 153 kHz acquired velocity profiles approximatively every 2 minutes during nighttime (22:00–6:00 UTC) at a speed of 10 knots and during the CTD surveys (see
Table 1. Characteristics of the profiling floats.
Platform Initial time Final time Maximal depth (m) Period Number of profiles
Arvor-A3 2014-05-25 2014-06-17 2000 1 day 12
Arvor-C 2014-05-25 2014-06-17 400 1.5 hour 455
Provor-bio 2014-05-25 2014-07-13 1000 1 day until June 7, then 5 days 71
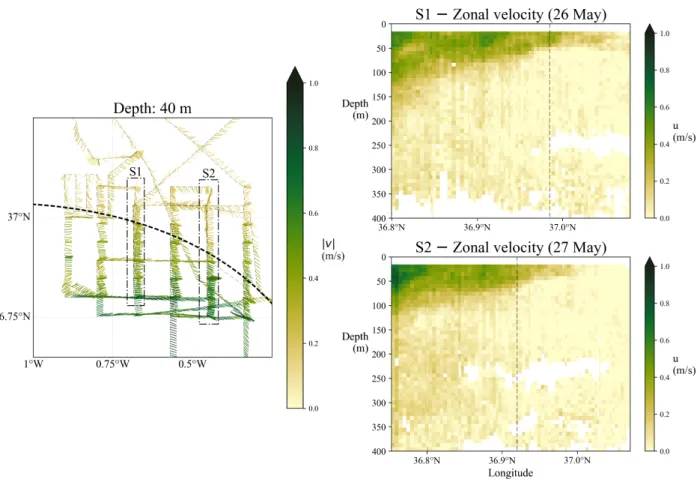
Fig. 3). The measurement accuracy is on the order of 0.01 m/s. The measurements were vertically averaged over 8 m depth bins.
The velocities exhibit a dominant eastward current with speed locally larger than 1 m/s and that signal is clearly visible in the first 100 m of the water column. The velocity field is illustrated in Fig. 11 where each velocity vector is shown as a bar with a color depending on the intensity. The vertical structure is also displayed along with the front position.
5
Figure 11. Velocity field obtained with the ADCP at a 40 m depth (left panel) and sections of zonal velocity on May 26 (S1) and 27 (S2). The locations of the sections are indicated by dashed rectangles on the map. Only data with a quality flag equal to 1 (good data) are represented Earth Syst. Sci. Data Discuss., https://doi.org/10.5194/essd-2018-104
Open Access Earth System
Science
Data
D iscussionsManuscript under review for journal Earth Syst. Sci. Data Discussion started: 3 September 2018
c
This type of current measurements requires a careful processing in order to get meaningful velocities from the raw signal, hence it is relevant to have a quality flag (QF) assigned to each measurement. The quality checks applied for this platform were adapted from the quality control (QC hereinafter) relative to the ADCP mounted on a mooring.
Figure 12 shows the QF during the whole mission. The 3 main periods during which the ADCP was turned off are shown as grey areas. In addition, no measurements are available in the first meters of the water column, due to the position of the ADCP 5
on the ship.
Figure 12. Quality flags for the velocity measurements.
Overall the quality of the data tends to deteriorate when the depth increases, as reflected by the bad and missing values. In the first 200 m, about 95% of the measurements are considered as good. Below 200 m, the ratio drops to 57% with more than 21% of missing values. Note that the flags 5, 7 and 8 were not used in this case but kept in the plot.
3 Description of the database 10
The AlborEx mission generated a large amount of data in a region sparsely sampled in the past. The synergy between lower-resolution (CTD, drifters, floats) and high-lower-resolution data (ADCP, gliders) makes this dataset unique for the study of subme-soscale processes in the Mediterranean Sea. Moreover its multidisciplinary nature makes it suitable to study the interactions between the physical conditions and the biogeochemical variables.
3.1 File format and organisation 15
The original data files (i.e. obtained directly from the sensors and with a format depending on the manufacturer) are converted to Network Common Data Form (netCDF, https://doi.org/(http://doi.org/10.5065/D6H70CW6, last accessed on August 3, 2018), an Open Geospatial Consortium (OGC) standard widely adopted in atmospheric and oceanic sciences. Each file contains the measurements acquired by the sensors as well the metadata (mission name, principal investigator, . . . ). The structure of the files follows the Climate and Forecast (CF) conventions (Domenico and Nativi, 2013) and are based on the model of OceanSITES 20
3.2 File naming
In order to keep the file names consistent with the original database, it is decided to keep the same file names as those assigned
by SOCIB Data Center. Let us decompose one file name into its different parts: dep0007_socib-rv_scb-sbe9002_L1_2014-05-25.nc
dep0007 indicates the number of the deployment, where deployment is the equivalent to the start of a mission or survey with
a given platform. The deployment ends when the mission is over or if the platform stops acquiring data. 5
socib-rv is the code for the platform, in this case the SOCIB coastal research vessel.
scb-sbe9002 is the instrument identifier, here the CTD SeaBird 9Plus. Note that the instrument is described in the metadata
of the netCDF file.
L1 is the processing level (see Sec. 3.3).
2014-05-25 is the deployment date (year-month-day).
10
Now the general naming is defined, Tab. 2 list below the different files made available in the dataset. Table 2. Platform corresponding to the different files.
File name Platform
dep0023_socib-rv_scb-rdi001_L1_2014-05.nc ADCP
dep0007_socib-rv_scb-sbe9002_L1_2014-05-25.nc CTD
dep0001_drifter-svp***_scb-svp***_L1_2014-05-25.nc SVP drifers (× 25)
dep0005_icoast00_ime-slcost000_L1_2014-05-25_data_dt.nc Coastal glider
dep0012_ideep00_ime-sldeep000_L1_2014-05-25_data_dt.nc Deep glider
dep0001_profiler-drifter-arvora3001_ogs-arvora3001_L1_2014-05-25.nc Arvor-A3 float dep0001_profiler-drifter-arvorc_socib_arvorc_L0_2014-05-25.nc Arvor-C float dep0001_profiler-drifter-provbioll001_ogs-provbioll001_L1_2014-05-25.nc Provor-Bio float
dep0015_socib-rv_scb-met009_L1_2014-05-25.nc Weather onboard R/V
dep0015_socib-rv_scb-pos001_L1_2014-05-25.nc Navigation data from R/V
dep0015_socib-rv_scb-tsl001_L1_2014-05-25.nc Thermosalinograph
dep0015_socib-rv_scb-tsl001_L1_2014-05-25_HR.nc Thermosalinograph (high-res.)
*** in the file names stands for 3 digits.
3.3 Data processing
For each of the platform described in Sec. 2, different processing are performed with the objective to turn raw data into quality-controlled, standardised data directly usable by scientists and experts. Specific conventions for data managed by SOCIB are explained below.
15
Earth Syst. Sci. Data Discuss., https://doi.org/10.5194/essd-2018-104
Open Access Earth System
Science
Data
D iscussionsManuscript under review for journal Earth Syst. Sci. Data Discussion started: 3 September 2018
c
3.3.1 Processing levels
All the data provided by SOCIB are available in different so-called processing levels, ranging from 0 (raw data) to 2 (gridded data). The files are organized by deployments, where a deployment is defined as an event initiated when an instrument is put at sea and finished once the instrument is recovered from sea. Table 3 summarizes the deployments performed during the experiment and the available processing levels.
5
Level 0 (L0) : this is the level closest to the original measurements, as it contains exactly the same data as the raw files provided by the instruments, but in a single file.
Level 1 (L1) : in this level, additional variables are derived from the existing ones (e.g., salinity, potential temperature). The attributes corresponding to each variable are stored in the netCDF file, with details of any modifications. Unit conversion are also applied if necessary.
10
Level 2 (L2) : this level consists of regular, homogeneous and instantaneous profiles obtained by interpolating the L1 data. It is only provided for gliders, mostly for visualization and post-processing purposes: specific tools designed to read and display profiler data can then be used the same way for gliders.
The glider data require a specific processing to ingest and convert the raw data files produced by the coastal and deep units. This is done within a toolbox designed for this purpose and extensively described in Troupin et al. (2016), the capabilities 15
of which includes metadata aggregation, data download, advanced data processing and the generation of data products and figures. Of particular interest is the application of a thermal-lag correction for un-pumped Sea-Bird CTD sensors installed on Slocum gliders (Garau et al., 2011), which improves the quality of the glider data.
Table 3. Characteristics of the instrument deployments in AlborEx.
Instruments Number of deployments Initial time Final time Processing levels
L0 L1 L2
Weather station on board R/V 1 2014-05-25 2014-05-02 X X
ADCP on board R/V 1 2014-05-25 2014-05-02 X X
CTD 1 (66 stations) 2014-05-25 2014-05-02 X X
Gliders 2 2014-05-25 2014-05-30 X X X
Surface drifters 25 2014-05-25 beyond the experiment X X
3.3.2 Quality control
Automated data QC is part of the processing routine of SOCIB Data Center: most of the datasets provided with this paper come with a set of flags that reflect the quality of the measurements, based on different tests regarded the range of measurements, the presence of spike, the displacement of the platform and the correctness of the metadata.
Drifters: checks are performed to remove bad positions (i.e. on land) and spikes in the trajectory. For the SVP drifters, the 5
method developed by (Rio, 2012) is used to improve the accuracy of the drogue presence from wind slippage (Menna et al., 2018).
Profiling floats: standard tests are performed to check the time and the position accuracy. Variable ranges are checked at each depth.
For some platforms, the automated QC are not implemented yet: 10
Gliders: a set of quality checks have been added to the glider toolbox (Troupin et al., 2016, and available at https://github. com/socib/glider_toolbox) and are in testing phase at the time of the writing. The QC included tests on NaN values, impossible date or location, valid ranges (depending on depth) for the variables, spikes, gradients and flat lines (constant value over a large range of depths) in profiles. The later check proved useful for conductivity (and hence density and salinity). This new QC step will then be included to the general procedure and new netCDF files will be produced and 15
made available as a new version of the present dataset.
CTD profiles: the situation is similar to the gliders: new tests have been recently added to the processing chain at SOCIB, hence the AlborEx CTD profiles will have to be reprocessed in order to assign the quality flags to the measurements. These tests are essentially based on the range of measured values depending on each variable and the presence of strong vertical variations spike within a profile.
20
As the new files will not be available before a full reprocessing of all the historical missions, we decided to provide the data files in their current state. A new version will be uploaded as soon as the processing has been performed.
4 Conclusions and perspectives
The AlborEx observations acquired in May 2014 constitutes a unique observational data set that captured mesoscale and submesocale features in a particularly energetic frontal zone in the western Mediterranean Sea. The potential uses of the 25
dataset can be separated in different topics:
– Hydrodynamics model validation: with their increasing resolution, models are becoming able to properly reproduce small-scale structures, but the correct timing and location of these features remain a challenging topic.
– High-resolution remote-sensing data validation: high quality in situ measurements of the sea surface are essential for the validation of operational product such SST or Ocean Color.
30
Earth Syst. Sci. Data Discuss., https://doi.org/10.5194/essd-2018-104
Open Access Earth System
Science
Data
D iscussionsManuscript under review for journal Earth Syst. Sci. Data Discussion started: 3 September 2018
c
– Study of mechanisms: the Mediterranean Sea is often referred to as a laboratory for oceanography and in particular the Alboran Sea is the stage of intense processes of mixing, subduction and instabilities.
– Assessment of mechanisms responsible for intense vertical motions.
The version of the dataset described in the present paper contains files that have been processed and standardised so that they are directly usable by scientists without having to perform unit or format conversions from the manufacturer raw data files. 5
Updates will be performed when new versions of the files or new files are made available. 5 Code and data availability
Following SOCIB general policy, the data are made available as netCDF files through the SOCIB Thematic Real-time Envi-ronmental Distributed Data Services (THREDDS) Data Server, a standard way to distribute metadata and data using a variety of remote data access protocols such as OPeNDAP (https://www.opendap.org), Web Map Service (WMS) or direct HTTP 10
access. In addition, the whole AlborEx dataset has been uploaded Zenodo (https://zenodo.org/, last accessed in August 3, 2018), a research platform designed to store any type of research outputs (papers, code, datasets) and assigns a Digital Ob-ject Identifier (DOI) to make them easily and uniquely citable. The most recent version of the dataset is accessible from http://doi.org/10.5281/zenodo.1328238.
Upgrades will be performed periodically with the implementation of fresh or better QCs on sensors such as the ADCP, CTD 15
or gliders. The new releases will be available using the same Zenodo identifier, but with be assigned a different version number, each version having its own DOI. Files not available at the time of the writing will also be appended to the original database.
Concerning the improvement of the quality control, it is worth mentioning the new tests that will be implemented in the SOCIB Glider Toolbox (Troupin et al., 2016).
The checks performed on the ADCP velocities involve a set of parameters that can also be fine-tuned to improve the relevance 20
of the quality flags. Nevertheless, noticeable changes are not expected with respect to the quality flags displayed in Fig. 12. Finally, the quality of the CTD and the glider profiles can be improved by using the salinity measurements of water samples collected during the mission. This type of correction might not be essential for the study of mesoscale processes but is crucial when one is focused on long-term studies and when a drift can be observed in the salinity measurements.
A set of programs in Python to read the files and represent their content as in the figures presented through the paper are avail-25
able at https://github.com/ctroupin/AlborEX-Data. The programs are written in the form of documented Jupyter notebooks, a web application that combines code fragment, equations, graphics and explanatory text (http://jupyter.org/, last accessed 14 August, 2018) so that they can be run step by step. The figures colormaps were produced using the cmocean module (Thyng et al., 2016).
Author contributions. C.T. prepared the figures and the first version of the manuscript. A.P. and S.R. edited the manuscript. J.G.F. and M.A.R. lead the data management and the creation of a DOI in Datacite. C.M. implemented the processing of the ADCP data. G.N. helped with the processing of the drifters and profiling floats.
Competing interests. The authors declare that the research was conducted in the absence of any commercial or financial relationships that could be construed as a potential conflict of interest.
5
Disclaimer. The authors do not accept any liability for the correctness and appropriate interpretation of the data or their suitability for any use.
Acknowledgements. AlborEx was conducted in the framework of PERSEUS EU-funded project (Grant agreement no. 287600). Glider operations were partially funded by JERICO FP7 project. AP acknowledges support from the Spanish National Research Program (E-MOTION/CTM2012-31014 and PRE-SWOT/CTM2016-78607-P). SR and AP are also supported by the Copernicus Marine Environment 10
Monitoring Service (CMEMS) MedSUB project. AO was supported by the Jerico-TNA program, through the FRIPP (FRontal Dynamics Influencing Primary Production) project. The profiling floats and some drifters were contributed by the Argo-Italy program. The proceedings of such an ambitious mission would not have been possible without the involvement of a numerous staff both at sea and on land: A. Massanet, M. Palmer, I. Lizaran, C. Castilla, P. Balaguer, M. Menna, K. Sebastián, S. Lora, and A. Bussani .
Earth Syst. Sci. Data Discuss., https://doi.org/10.5194/essd-2018-104
Open Access Earth System
Science
Data
D iscussionsManuscript under review for journal Earth Syst. Sci. Data Discussion started: 3 September 2018
c
References
Adloff, F., Somot, S., Sevault, F., Jordà, G., Aznar, R., Déqué, M., Herrmann, M., Marcos, M., Dubois, C., Padorno, E., and et al.: Mediterranean Sea response to climate change in an ensemble of twenty first century scenarios, Climate Dynamics, 45, 2775–2802, https://doi.org/10.1007/s00382-015-2507-3, https://link.springer.com/content/pdf/10.1007%2Fs00382-015-2507-3.pdf, 2015.
Alvarez, A., Tintoré, J., and Sabatés, A.: Flow modification and shelf-slope exchange induced by a submarine canyon off the northeast Span-5
ish coast, Journal of Geophysical Research: Oceans, 101, 12 043–12 055, https://doi.org/10.1029/95jc03554, https://agupubs.onlinelibrary. wiley.com/doi/abs/10.1029/95JC03554, 1996.
Bergamasco, A. and Malanotte-Rizzoli, P.: The circulation of the Mediterranean Sea: a historical review of experimental investigations, Advances in Oceanography and Limnology, 1, 11–28, https://doi.org/10.1080/19475721.2010.491656, http://www.tandfonline.com/doi/ abs/10.1080/19475721.2010.491656, 2010.
10
Berta, M., Bellomo, L., Griffa, A., Magaldi, M., Molcard, A., Mantovani, C., Gasparini, G. P., Marmain, J., Vetrano, A., Béguery, L., Borghini, M., Barbin, Y., Gaggelli, J., and Quentin, C.: Wind induced variability in the Northern Current (North-Western Mediterranean Sea) as depicted by a multi-platform observing system, Ocean Science Discussions, 14, 689–710, https://doi.org/10.5194/os-14-689-2018, https://www.ocean-sci.net/14/689/2018/, 2018.
Bonaduce, A., Pinardi, N., Oddo, P., Spada, G., and Larnicol, G.: Sea-level variability in the Mediterranean Sea from altimetry and 15
tide gauges, Climate Dynamics, 47, 2851–2866, https://doi.org/10.1007/s00382-016-3001-2, https://link.springer.com/article/10.1007% 2Fs00382-016-3001-2, 2016.
Bosse, A., Testor, P., Mortier, L., Prieur, L., Taillandier, V., d’ Ortenzio, F., and Coppola, L.: Spreading of Levantine Intermediate Waters by submesoscale coherent vortices in the northwestern Mediterranean Sea as observed with gliders, Journal of Geophysical Research: Oceans, 120, 1599–1622, https://doi.org/10.1002/2014jc010263, https://agupubs.onlinelibrary.wiley.com/doi/abs/10.1002/2014JC010263, 2015. 20
Bouffard, J., Pascual, A., Ruiz, S., Faugère, Y., and Tintoré, J.: Coastal and mesoscale dynamics characterization using altimetry and glid-ers: A case study in the Balearic Sea, Journal of Geophysical Research, 115, , https://doi.org/10.1029/2009jc006087, https://agupubs. onlinelibrary.wiley.com/doi/abs/10.1029/2009JC006087, 2010.
Cheney, R. E.: Recent observations of the Alboran Sea frontal system, Journal of Geophysical Research, 83, 4593, https://doi.org/10.1029/jc083ic09p04593, https://agupubs.onlinelibrary.wiley.com/doi/abs/10.1029/JC083iC09p04593, 1978.
25
Damien, P., Bosse, A., Testor, P., Marsaleix, P., and Estournel, C.: Modeling Postconvective Submesoscale Coherent Vortices in the Northwestern Mediterranean Sea, Journal of Geophysical Research: Oceans, 122, 9937–9961, https://doi.org/10.1002/2016jc012114, https://agupubs.onlinelibrary.wiley.com/doi/abs/10.1002/2016JC012114, 2017.
Domenico, B. and Nativi, S.: CF-netCDF3 Data Model Extension standard, Tech. Rep. OGC 11-165r2, Open Geospatial Consortium, https: //portal.opengeospatial.org/files/?artifact_id=51908, 2013.
30
Garau, B., Ruiz, S., Zhang, W. G., Pascual, A., Heslop, E., Kerfoot, J., and Tintoré, J.: Thermal Lag Correction on Slocum CTD Glider Data, Journal of Atmospheric and Oceanic Technology, 28, 1065–1071, https://doi.org/10.1175/jtech-d-10-05030.1, http://journals.ametsoc.org/ doi/abs/10.1175/JTECH-D-10-05030.1, 2011.
Giorgi, F.: Climate change hot-spots, Geophysical Research Letters, 33, , https://doi.org/10.1029/2006gl025734, https://agupubs. onlinelibrary.wiley.com/doi/epdf/10.1029/2006GL025734, 2006.
35
Giorgi, F. and Lionello, P.: Climate change projections for the Mediterranean region, Global and Planetary Change, 63, 90–104, https://doi.org/10.1016/j.gloplacha.2007.09.005, https://www.sciencedirect.com/science/article/pii/S0921818107001750, 2008.
Guiot, J. and Cramer, W.: Climate change: The 2015 Paris Agreement thresholds and Mediterranean basin ecosystems, Science, 354, 465–468, https://doi.org/10.1126/science.aah5015, http://science.sciencemag.org/content/354/6311/465, 2016.
Iona, A., Theodorou, A., Sofianos, S., Watelet, S., Troupin, C., and Beckers, J.-M.: Mediterranean Sea climatic indices: monitoring long term variability and climate changes, Earth System Science Data Discussions, 2018, 1–18, https://doi.org/10.5194/essd-2018-51, https: 5
//www.earth-syst-sci-data-discuss.net/essd-2018-51/, 2018a.
Iona, A., Theodorou, A., Watelet, S., Troupin, C., Beckers, J.-M., and Simoncelli, S.: Mediterranean Sea Hydrographic Atlas: towards optimal data analysis by including time-dependent statistical parameters, Earth System Science Data, 10, 1–29, https://doi.org/10.5194/essd-10-1281-2018, https://www.earth-syst-sci-data.net/10/1281/2018/, 2018b.
Macias, D., Garcia-Gorriz, E., and Stips, A.: Deep winter convection and phytoplankton dynamics in the NW Mediterranean Sea under 10
present climate and future (horizon 2030) scenarios, Scientific Reports, 8, 1–15, https://doi.org/10.1038/s41598-018-24965-0, https:// www.nature.com/articles/s41598-018-24965-0, 2018.
Margirier, F., Bosse, A., Testor, P., L’Hévéder, B., Mortier, L., and Smeed, D.: Characterization of Convective Plumes Associated With Oceanic Deep Convection in the Northwestern Mediterranean From High-Resolution In Situ Data Collected by Gliders, Journal of Geo-physical Research: Oceans, 122, 9814–826, https://doi.org/10.1002/2016JC012633, https://agupubs.onlinelibrary.wiley.com/doi/abs/10. 15
1002/2016JC012633, 2017.
MEDOC-Group, T.: Observation of Formation of Deep Water in the Mediterranean Sea, 1969, Nature, 225, 1037–1040, https://doi.org/10.1038/2271037a0, https://www.nature.com/articles/2271037a0, 1970.
Menna, M., Poulain, P.-M., Bussani, A., and Gerin, R.: Detecting the drogue presence of SVP drifters from wind slippage in the Mediter-ranean Sea, Measurement, 125, 447–453, https://doi.org/10.1016/j.measurement.2018.05.022, https://www.sciencedirect.com/science/ 20
article/pii/S0263224118304081, 2018.
Millot, C.: Circulation in the Western Mediterranean Sea, Oceanologica Acta, 10, 143–148, 1987.
Millot, C.: Mesoscale and seasonal variabilities of the circulation in the western Mediterranean, Dynamics of Atmospheres and Oceans, 15, 179 – 214, https://doi.org/10.1016/0377-0265(91)90020-G, http://www.sciencedirect.com/science/article/pii/037702659190020G, 1991. Millot, C.: Circulation in the Western Mediterranean Sea, Journal of Marine Systems, 20, 423 – 442, https://doi.org/10.1016/S0924-25
7963(98)00078-5, http://www.sciencedirect.com/science/article/pii/S0924796398000785, 1999.
Olita, A., Capet, A., Claret, M., Mahadevan, A., Poulain, P. M., Ribotti, A., Ruiz, S., Tintoré, J., Tovar-Sánchez, A., and Pas-cual, A.: Frontal dynamics boost primary production in the summer stratified Mediterranean Sea, Ocean Dynamics, 67, 767–782, https://doi.org/10.1007/s10236-017-1058-z, https://link.springer.com/article/10.1007%2Fs10236-017-1058-z, 2017.
Pascual, A., Ruiz, S., Olita, A., Troupin, C., Claret, M., Casas, B., Mourre, B., Poulain, P.-M., Tovar-Sanchez, A., Capet, A., Mason, E., 30
Allen, J., Mahadevan, A., and Tintoré, J.: A multiplatform experiment to unravel meso- and submesoscale processes in an intense front (AlborEx), Frontiers in Marine Science, 4, , https://doi.org/10.3389/fmars.2017.00039, http://journal.frontiersin.org/article/10.3389/fmars. 2017.00039/full, 2017.
Pinot, J.-M., Tintoré, J., and Gomis, D.: Multivariate analysis of the surface circulation in the Balearic Sea, Progress in Oceanography, 36, 343–376, https://doi.org/10.1016/0079-6611(96)00003-1, https://www.sciencedirect.com/science/article/pii/0079661196000031, 1995. 35
Poulain, P.-M., Bussani, A., Gerin, R., Jungwirth, R., Mauri, E., Menna, M., and Notarstefano, G.: Mediterranean Surface Currents Measured with Drifters: From Basin to Subinertial Scales, Oceanography, 26, 38–47, https://doi.org/10.5670/oceanog.2013.03, https: //tos.org/oceanography/assets/docs/26-1_poulain.pdf, 2013.
Earth Syst. Sci. Data Discuss., https://doi.org/10.5194/essd-2018-104
Open Access Earth System
Science
Data
D iscussionsManuscript under review for journal Earth Syst. Sci. Data Discussion started: 3 September 2018
c
Pujol, M.-I. and Larnicol, G.: Mediterranean sea eddy kinetic energy variability from 11 years of altimetric data, Journal of Marine Systems, 58, 121–142, https://doi.org/10.1016/j.jmarsys.2005.07.005, https://www.sciencedirect.com/science/article/pii/ S0924796305001442, 2005.
5
Rahmstorf, S.: Influence of mediterranean outflow on climate, Eos, Transactions American Geophysical Union, 79, 281–281, https://doi.org/10.1029/98eo00208, http://onlinelibrary.wiley.com/doi/10.1029/98EO00208/abstract, 1998.
Rio, M.-H.: Use of Altimeter and Wind Data to Detect the Anomalous Loss of SVP-Type Drifter’s Drogue, Journal of Atmo-spheric and Oceanic Technology, 29, 1663–1674, https://doi.org/10.1175/jtech-d-12-00008.1, http://journals.ametsoc.org/doi/pdf/10. 1175/JTECH-D-12-00008.1, 2012.
10
Robinson, A., Leslie, W., Theocharis, A., and Lascaratos, A.: Mediterranean Sea Circulation, Encyclopedia of Ocean Sciences, pp. 1689– 1705, https://doi.org/10.1006/rwos.2001.0376, http://www.sciencedirect.com/science/article/pii/B012227430X003767, 2001.
Ruiz, S., Pascual, A., Casas, B., Poulain, P., Olita, A., Troupin, C., Torner, M., Allen, J., Tovar, A., Mourre, B., Massanet, A., Palmer, M., Margirier, F., Balaguer, P., Castilla, C., Claret, M., Mahadevan, A., and Tintoré, J.: Report on operation and data analysis from multiplatform synoptic intensive experiment (AlborEx), Tech. rep., D3.8 Policy-oriented marine Environmental Research in the Southern 15
European Seas, 120 pp, 2015.
Sánchez-Román, A., Ruiz, S., Pascual, A., Mourre, B., and Guinehut, S.: On the mesoscale monitoring capability of Argo floats in the Mediterranean Sea, Ocean Science, 13, 223–234, https://doi.org/10.5194/os-13-223-2017, https://www.ocean-sci.net/13/223/2017/ os-13-223-2017.pdf, 2017.
Send, U., Font, J., Krahmann, G., Millot, C., Rhein, M., and Tintoré, J.: Recent advances in observing the physical oceanography of the west-20
ern Mediterranean Sea, Progress in Oceanography, 44, 37–64, https://doi.org/10.1016/s0079-6611(99)00020-8, https://www.sciencedirect. com/science/article/pii/S0079661199000208, 1999.
Send, U., Weller, R. A., Wallace, D., Chavez, F., Lampitt, R. L., Dickey, T., Honda, M., Nittis, K., Lukas, R., McPhaden, M., and Feely, R.: OceanSITES, Proceedings of OceanObs’09: Sustained Ocean Observations and Information for Society, https://doi.org/10.5270/oceanobs09.cwp.79, http://www.oceanobs09.net/proceedings/cwp/Send-OceanObs09.cwp.79.pdf, 2010. 25
Simoncelli, S., Tonani, M., Grandi, A., Coatanoan, C., Myroshnychenko, V., Sagen, H., Bäck, O., Scory, S., Schlitzer, R., and Fichaut, M.: First Release of the SeaDataNet Aggregated Data Sets Products. WP10 Second Year Report - DELIVERABLE D10.2., Tech. rep., SeaDataNet, https://doi.org/10.13155/49827, http://archimer.ifremer.fr/doc/00387/49827/, 2014.
Simoncelli, S., Grandi, A., , and Iona, S.: New Mediterranean Sea climatologies, in: IMDIS 2016 International Conference on Marine Data and Information Systems, vol. 57, pp. 1–152, IOPAN and IMGW, Gdansk, Poland, https://imdis.seadatanet.org/content/download/104127/ 30
1498227/file/IMDIS2016_proceedings.pdf?version=1, 2016.
Skliris, N.: Past, Present and Future Patterns of the Thermohaline Circulation and Characteristic Water Masses of the Mediterranean Sea, pp. 29–48, Springer Netherlands, Dordrecht, https://doi.org/10.1007/978-94-007-6704-1_3, https://link.springer.com/chapter/10.1007% 2F978-94-007-6704-1_3, 2014.
Stommel, H.: Deep winter convection in the western Mediterranean Sea, in: Studies in physical oceanography: A tribute to Georg Wüst on 35
his 80th birthday, edited by Gordon, A. L., vol. 2, p. 232, Gordon and Breach Science, 1972.
Testor, P. and Gascard, J.-C.: Large-Scale Spreading of Deep Waters in the Western Mediterranean Sea by Submesoscale Coherent Eddies, Journal of Physical Oceanography, 33, 75–87, https://doi.org/10.1175/1520-0485(2003)033<0075:LSSODW>2.0.CO;2, https://journals. ametsoc.org/doi/abs/10.1175/1520-0485%282003%29033%3C0075%3ALSSODW%3E2.0.CO%3B2, 2003.
Testor, P., Bosse, A., Houpert, L., Margirier, F., Mortier, L., Legoff, H., Dausse, D., Labaste, M., Karstensen, J., Hayes, D., and et al.: Multiscale Observations of Deep Convection in the Northwestern Mediterranean Sea During Winter 2012-2013 Using Multiple Platforms, 5
Journal of Geophysical Research: Oceans, 123, 1745–1776, https://doi.org/10.1002/2016jc012671, https://agupubs.onlinelibrary.wiley. com/doi/abs/10.1002/2016JC012671, 2018.
Thyng, K., Greene, C., Hetland, R., Zimmerle, H., and DiMarco, S.: True Colors of Oceanography: Guidelines for Effective and Accurate Colormap Selection, Oceanography, 29, 9–13, https://doi.org/10.5670/oceanog.2016.66, https://tos.org/oceanography/article/ true-colors-of-oceanography-guidelines-for-effective-and-accurate-colormap, 2016.
10
Tintoré, J., Gomis, D., Alonso, S., and Parrilla, G.: Mesoscale Dynamics and Vertical Motion in the Alborán Sea, Journal of Physical Oceanography, 21, 811–823, https://doi.org/10.1175/1520-0485(1991)021<0811:mdavmi>2.0.co;2, https://journals.ametsoc.org/doi/abs/ 10.1175/1520-0485%281991%29021%3C0811%3AMDAVMI%3E2.0.CO%3B2, 1991.
Tintoré, J., Vizoso, G., Casas, B., Heslop, E., Pascual, A., Orfila, A., Ruiz, S., Martínez-Ledesma, M., Torner, M., Cusí, S., and et al.: SOCIB: The Balearic Islands Coastal Ocean Observing and Forecasting System Responding to Science, Technology and Society Needs, Marine 15
Technology Society Journal, 47, 101–117, https://doi.org/10.4031/mtsj.47.1.10, http://www.ingentaconnect.com/content/mts/mtsj/2013/ 00000047/00000001/art00010;jsessionid=2cbcvta0m97c.x-ic-live-02, 2013.
Troupin, C., Pascual, A., Valladeau, G., Pujol, I., Lana, A., Heslop, E., Ruiz, S., Torner, M., Picot, N., and Tintoré, J.: Illustration of the emerging capabilities of SARAL/AltiKa in the coastal zone using a multi-platform approach, Advances in Space Research, 55, 51–59, https://doi.org/10.1016/j.asr.2014.09.011, http://www.sciencedirect.com/science/article/pii/S0273117714005754, 2015.
20
Troupin, C., Beltran, J., Heslop, E., Torner, M., Garau, B., Allen, J., Ruiz, S., and Tintoré, J.: A toolbox for glider data processing and management, Methods in Oceanography, 13-14, 13–23, https://doi.org/10.1016/j.mio.2016.01.001, http://www.sciencedirect.com/science/ article/pii/S2211122015300207, 2016.
Tsimplis, M. N. and Rixen, M.: Sea level in the Mediterranean Sea: The contribution of temperature and salinity changes, Geophys-ical Research Letters, 29, 51–1–51–4, https://doi.org/10.1029/2002gl015870, https://agupubs.onlinelibrary.wiley.com/doi/pdf/10.1029/ 25
2002GL015870, 2002.
Wolff, C., Vafeidis, A. T., Muis, S., Lincke, D., Satta, A., Lionello, P., Jimenez, J. A., Conte, D., and Hinkel, J.: A Mediterranean coastal database for assessing the impacts of sea-level rise and associated hazards, Scientific Data, 5, 180 044, https://doi.org/10.1038/sdata.2018.44, https://www.nature.com/articles/sdata201844.pdf, 2018.
Wüst, G.: On the vertical circulation of the Mediterranean Sea, Journal of Geophysical Research, 66, 3261–3271, 30
https://doi.org/10.1029/jz066i010p03261, https://agupubs.onlinelibrary.wiley.com/doi/pdf/10.1029/JZ066i010p03261, 1961. Earth Syst. Sci. Data Discuss., https://doi.org/10.5194/essd-2018-104
Open Access Earth System
Science
Data
D iscussionsManuscript under review for journal Earth Syst. Sci. Data Discussion started: 3 September 2018
c