Using Artificial Vision for the Microscopic Identification
of Ores with Reflected Light: Preliminary Results.
Castroviejo Ricardo, Brea Carolina, Pérez-Barnuevo Laura
Universidad Politécnica de Madrid, ETSI Minas, c/Ríos Rosas, 2, 28003_Madrid (Spain) Catalina J.Carlos, Segundo Fernando
AITEMIN, Parque Tecnológico Leganés, 28919_Madrid (Spain) Bernhardt H.-Juergen
Ruhr_Universitaet Bochum, Z. Elektronen-Mikrosonde, Universitaetsstr. 150, D_44801 Bochum (Germany) Pirard Eric
Université de Liège, GeMMe, Sart Tilman B52, Liège 4000 (Belgium) Abstract. Traditional identification of ore minerals with
reflected light microscopy relies heavily on the experience of the observer. Qualified observers have become a rarity, as ore microscopy is often neglected in today’s university training, but since it furnishes necessary and inexpensive information, innovative alternatives are needed, especially for quantification. Many of the diagnostic optical properties of ores defy quantification, but recent developments in electronics and optics allow new insights into the reflectance and colour properties of ores. Preliminary results for the development of an expert system aimed at the automatic identification of ores based on their reflectance properties are presented. The discriminatory capacity of the system is enhanced by near IR reflectance measures, while UV filters tested to date are unreliable. Interaction with image analysis software through a wholly automated microscope, to furnish quantitative and morphological information for geometallurgy, relies on automated identification of the ores based on the measured spectra. This methodology increases enormously the performance of the microscopist, nevertheless supervision by an expert is always needed. Keywords: Automated Ore Microscopy, computer vision, Multispectral reflectance data, VNIR, Geometallurgy.
1 Introduction
Reflected light microscopy has been the main method of ore characterization throughout most of the second half of the 20th century, but its fate in the future may depend largely on the ability to increase its performance through reliable quantification and automation. The series of Quantitative Data Files edited by the IMA / COM, particularly the last version, QDF3 (Criddle & Stanley, 1993), represents a milestone in the compilation of reliable spectral information on ore reflectances in visible light, making it possible to aim at automated microscopic identification of ores based on quantitative data. A joint effort by researchers from the Universidad Politécnica de Madrid (UPM), AITEMÍN, Ruhr Universitaet Bochum (RUB), and Université de Liège (ULg) has allowed to collect visible and near-infra-red (VNIR) spectral data from ores in a systematic way for their automatic identification, and for their quantitative geometallurgical characterization.
2 Experimental process
2.1 Materials and methods.The selection of the ore sections to be measured is a most important step. Their quality is a key to the value of the results. All the sections have been previously studied and, if needed, repolished and / or analysed with electron microprobe (RUB). Only representative ores from well polished sections with a fresh surface and sufficient grainsize have been measured. The samples used are mainly from two sources: a replica of the ore collection used for his book (1980) by Prof. Ramdohr, and the research and / or teaching collections of the UPM, completed in some cases with ores from RUB.
Traditional ore microscopy, well documented in the literature (cf. excellent introduction by Criddle, 1998) resorts mainly to polarized light. Nevertheless, observations under polarized light, very helpful for the qualitative characterization of ores, are bound to anisotropy and are a problem for routine automation, given the difficulty to control the orientation of mineral grains. The approach chosen for this work is therefore to avoid polarization, even if the QDF3 data resort to it: as predicted, the values obtained are intermediate between the extreme R values of QDF3. Although common ores can be analysed from simple 3CCD colour images (Berrezueta & Castroviejo, 2007), multispectral imaging is more reliable (Pirard, 2004). To enhance the discrimination capacity of the system, not only visible (as in QDF) but also NIR values (up to 1000 nm) are measured; to do this, the original heat protection filters of the microscopes were replaced by a heat filterhybrid hot mirror with a wavelength cut well above for WL>1000 nm. For more detailed descriptions of the methodology, see Pirard et al. (2008), Castroviejo et al. (2008), and Catalina et al. (2008).
The tests performed on commercially available UV filters (down to 350 nm) showed them to transmit also a noteworthy intensity of visible light. Therefore, UV values are not included, although tests with new filters are in progress and might finally lead to useful values. 2.2 Equipment.
Laboratorio de Microscopía Aplicada (LMA, UPM), and in AITEMIN, with specific instrumentation: automated microscopes for reflected light (Leica DM6000M in LMA, Zeiss Axioskop 2 MOT in AITEMIN), both equipped with a DTA RPF16 filter wheel comprising 13 Melles Griot interference filters to measure from 400 to 1000 nm, in 50 nm intervals (40 nm FWHM); images were acquired with a Basler Scout scA1400fm digital
video camera with IEEE-1394 interface. The calibration
standards used to date are certified Ocean Optics STAN-SSH and STAN-SSL (for high and low reflectances, resp.), but the production of specific standards is planned at RUB.
The measures are carried out and checked separately in both laboratories. They can also be compared with values obtained in ULg, with a roughly similar equipment (Olympus BX 60 scope, and filter wheel with 10 nm FWHM Coherent filters). For an additional test of the process a precision spectral microphotometer, mounted on a Leitz Orthoplan scope, has been designed at RUB and integrated into the work routine at LMA; instead of single interference filters and a photomultiplier usable in visible light (Bernhardt, 1987), a monolithic solid state spectrometer (Hamamatsu C10083CA) is used; it allows measurements from 400 to 1000nm, with a spectral resolution of 0.3nm.
3 Multispectral VNIR data base and its use
3.1 The data base: preliminary resultsThe measured values are being compiled in a data base. As an example, Table 1 shows the preliminary VNIR results for 30 common ore minerals, found in most of the mineralisations of industrial interest. VNIR values in visible light lie among the maximum and minimum QDF3 values, as predicted, and the curves show a similar trend. NIR values may show peculiar changes that enhance the spectral differences (compare e.g. pyrrhotite and chalcopyrite, or covellite and bornite: Fig. 1), while in other cases, they appear as a dull extension of the visible spectra (Fig. 2).
3.2 Applications
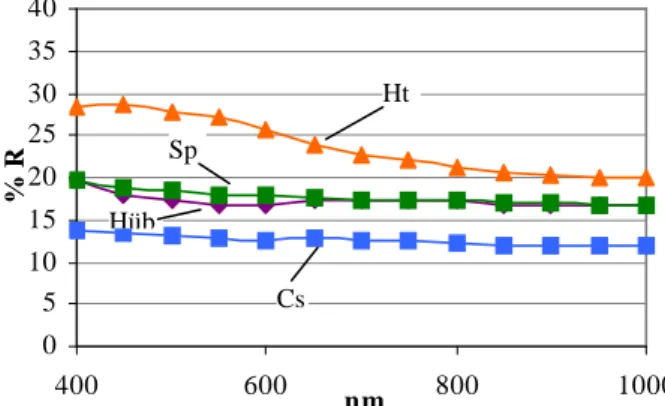
Although these data need to be completed to really establish their potential to build an expert system, it can be anticipated that in some cases (Fig. 1) they may be very helpful to implement an automated characterization of the ores. Automated identification can be expected in most common ores, although to be safe the support of additional criteria, such as paragenesis or preliminary study by a mineralogist, should be introduced. Other data may be needed in exceptional cases, such as the concentrates from Pasto Bueno mine, Peru, where sphalerite and wolframite (the high-R end-member hübnerite) occur together: their spectra can not be readily distinguished (Fig. 2), and chemical data (% W, and % Zn in the concentrates) had to be introduced to get a reliable modal analysis.
Figure 1. VNIR (400nm-1000nm) spectral reflectance curves for selected minerals from Table 1, compared with the curves in visible light (400nm-700nm, data from QDF3) for the same minerals. Mineral abbreviations: code in Table 1.
Figure 2. VNIR spectral reflectance curves for some low-reflectance minerals. Abbreviations: code in Table 1.
4 Automated identification
Current work aims at the automated identification of the ore minerals from their VNIR multispectral data. The performance of several well known classification techniques, such as minimum Euclidean distance, minimum Mahalanobis distance, Spectral Angle Mapper and MOMI (Bernhardt, 1987) has been compared on a data-set of 38 minerals of interest. Preliminary results show that minimum Mahalanobis distance might be a very reliable discriminatory technique, correctly classifying most mineral samples (363 out of 372, in a typical test run).
5 Conclusions
Present day optical and electronic technologies allow the reliable multispectral VNIR measure of ore reflectances, as shown by Table 1. Spectra measured to date compare well with published QDF3 spectra in the visible intervals -not considering mineral anisotropy-, but NIR values can show quite characteristic trends enhancing discrimination and automatic identification, although not in every case (Figs. 1 & 2). Work in progress aims at the
0 2 0 4 0 6 0 8 0 1 0 0 4 0 0 6 0 0 8 0 0 1 0 0 0 n m % R Ag Au Py Cpy Po Bn Cv 0 5 10 15 20 25 30 35 40 400 600 800 1000 nm % R Hüb Sp Ht Cs
automation of the process, including quantified characterization for geometallurgy, but a reliable method of general use should include complementary data, e.g. on paragenesis. In exceptional paragenesis (as shown in Pasto Bueno mine), the mineralogist should define the necessary approach. The system is therefore not expected to replace a mineralogist, but to greatly enhance his
performance through automation and computerized processing of the data. The cost of the equipment, low when compared to electron microscopes, can be assumed by small companies, and the return of the investment can be high (Pérez-Barnuevo et al., 2008) if compared with the work of a specialist with traditional methods as e.g. point-counter.
Wavelength(nm) Type Mineral (code)
400 450 500 550 600 650 700 750 800 850 900 950 1000 Gold (Au) 36.4 37.2 58.8 80.9 87.3 90.0 91.1 91.3 91.3 90.4 90.1 89.8 89.3 Platinum (Pt) 60.2 63.1 65.2 66.9 68.0 69.0 70.1 70.8 71.0 71.7 72.4 72.9 73.2 1 Silver (Ag) 81.7 87.6 90.5 92.3 93.2 93.7 94.2 94.6 94.2 93.8 93.9 93.7 93.2 Arsenopyrite (Asp) 51.2 51.7 52.7 53.4 53.5 53.3 52.8 52.3 51.1 50.2 49.7 49.0 48.2 Bismuthinite (Bm) 39.4 39.1 38.7 38.5 37.7 37.4 36.7 35.9 34.8 33.9 33.4 32.9 32.6 Bornite (Bn) 20.7 19.4 21.0 24.3 27.2 30.3 33.2 35.3 36.9 37.8 38.6 39.2 40.0 Chalcopyrite (Ccp) 19.7 31.5 41.3 46.6 48.1 48.5 48.1 47.5 46.2 45.3 44.7 44.9 45.1 Chalcocite (Ct) 36.4 36.6 34.9 32.8 31.4 30.1 29.1 28.5 28.0 27.3 27.3 27.4 27.8 Cinnabar (Cin) 33.0 29.5 28.2 27.1 26.7 27.5 27.1 26.7 26.2 25.7 25.3 25.2 25.0 Covellite (Cv) 22.2 20.3 16.6 12.6 10.5 12.8 26.4 38.0 44.2 47.9 50.8 52.9 54.8 Cubanite (Cn) 23.1 31.7 36.8 39.6 41.0 42.1 43.3 43.8 43.5 43.5 43.6 43.7 43.3 Digenite (Dig) 26.9 26.4 24.9 22.3 20.3 18.2 16.1 14.6 13.5 13.0 13.4 14.7 17.2 Galena (Gn) 50.3 46.9 44.4 43.1 42.7 42.8 42.4 41.7 40.5 39.9 39.3 38.7 37.6 Marcasite (Mar) 44.4 47.6 50.9 52.1 51.2 50.1 48.7 47.4 46.0 45.9 46.0 46.4 46.6 Molybdenite (Mo) 23.1 24.7 23.2 21.9 22.1 22.5 22.6 21.8 21.4 21.1 20.9 20.9 21.0 Nickeline (Nc) 42.8 41.5 44.9 51.3 56.2 59.7 63.1 65.8 67.2 68.8 70.2 71.3 71.6 Pentlandite (Pn) 32.2 38.3 42.6 46.1 48.4 50.2 52.1 53.4 54.0 54.4 55.4 56.2 56.7 Pyrite (Py) 40.2 46.2 51.4 54.2 55.1 55.7 55.7 54.3 51.9 50.3 49.1 47.9 46.3 Pyrrhotite (Po) 31.8 34.3 37.0 39.9 41.9 43.7 45.7 47.1 47.8 48.8 49.9 50.8 51.1 Sphalerite (Sp) 21.0 19.6 18.9 18.5 18.2 17.8 17.5 17.3 17.1 16.9 16.8 16.7 16.6 2 Stibnite (Stib) 35.8 34.4 33.6 33.0 32.1 32.0 31.4 30.6 29.6 29.1 28.6 28.3 28.2 3 Tetrahedrite (Thd) 28.3 28.5 28.9 29.4 29.2 28.3 27.2 26.4 25.6 25.0 24.7 24.4 24.1 Cassiterite (Cs) 13.8 13.4 13.0 12.9 12.6 12.7 12.5 12.4 12.2 12.0 11.9 11.8 11.8 Chromite (Cr) 13.7 13.3 13.0 12.9 12.7 12.7 12.6 12.4 12.4 12.4 12.3 12.4 12.7 Goethite (Goe) 18.4 17.1 16.4 15.8 15.1 14.7 14.3 14.2 13.9 13.7 13.5 13.4 13.5 Hematite (Ht) 28.4 28.6 27.9 27.1 25.6 24.0 22.8 22.1 21.3 20.7 20.4 20.1 19.9 Ilmenite (Il) 21.0 19.0 18.0 17.9 18.1 18.4 18.5 18.5 18.3 18.0 17.8 17.6 17.5 Magnetite (Mg) 20.2 19.5 19.4 19.5 19.7 19.8 19.4 18.7 17.7 16.8 16.3 16.0 15.9 Pyrolusite (Prl) 31.0 32.4 32.8 32.6 32.0 31.2 30.6 30.4 29.8 29.1 28.8 28.5 28.0 4 Wolframite (Wf) 19.5 18.3 18.2 18.2 18.3 17.9 17.7 17.5 17.0 16.6 16.5 16.3 16.3 Table 1. VNIR spectral reflectance values for common ore minerals (1: Elements, 2: Sulphides, etc., 3: Sulphosalts, 4: Oxides).
Acknowledgements
This work has been funded by the Spanish Ministerio de Ciencia e Innovación through the project CAMEVA (Code CGL2006_13688_C02_01), and by the Comunidad Autónoma de Madrid through the programme PRICIT (2007, 2008). The late Prof. Amstutz (Univ. Heidelberg) is gratefully acknowledged for the ores of the Rehwald / Ramdohr collection used in the LMA/UPM for many of the measures.
References
Bernhardt HJ (1987) A simple, fully-automated system for ore mineral identification. Mineralogy and Petrology, 36, 241-245. Berrezueta E, Castroviejo R (2007) Reconocimiento automatizado
de menas metálicas mediante análisis digital de imagen: un apoyo al proceso mineralúrgico. I: ensayo metodológico. Rev. Metalurgia, 43 (4), 294-309.
Castroviejo R et al. (2008) Caracterización y cuantificación automatizadas de menas metálicas mediante visión artificial: Proyecto CAMEVA. Proc. Symp. Mineralogía Apl. Geometalurgia, abs. R8, XIII Congr. Latinoamericano de
Geología, Lima, 29 sept-3 oct 2008.
Catalina JC, et al. (2008) Aplicación de la visión artificial al desarrollo de sistemas de análisis microscópico automatizado. Proc. Symp. Mineralogía Apl. Geometalurgia, abs. R3, XIII
Congr. Latinoamericano Geología, Lima, 29 sept- 3 oct 2008.
Criddle AJ (1998) Ore Micrsocopy and Photometry (1890-1998), ch. 1 in: Cabri LJ & Vaughan DJ, eds. Modern Approaches to ore and Environmental Mineralogy. COM/IMA, MAC Short Course Series, vol. 27, Ottawa, Ontario, 421 p.
Criddle AJ, Stanley CJ (1993) Quantitative Data File for Ore Minerals, 3rd ed. Chapman and Hall, London, 635 p.
Pérez-Barnuevo L, Castroviejo R, Berrezueta E (2008) Ensayo metodológico para optimizar la caracterización mineralógica de menas metálicas. Estudio de un caso de aplicación mineralúrgica. Proc. Symp. Mineralogía Apl. Geometalurgia, abs. R5, XIII Congr. Latinoamericano de Geología, Lima, 29 sept- 3 oct 2008.
Pirard E (2004) Multispectral imaging of ore minerals in optical microscopy: Mineralogical Mag. 68 (2), p.323-333.
Pirard E et al.(2008) From Spectrophotometry to Multispectral Imaging of Ore Minerals in Visible and Near Infrared (VNIR) Microscopy. 9th Internat. Cong. Appl. Mineralogy, Brisbane, QLD, 8-10 sept 2008, ext. abst, pp 1-6.
Ramdohr P (1980) The ore minerals and their intergrowths. Pergamon, 2 vols., 1205 p