HAL Id: dumas-01277887
https://dumas.ccsd.cnrs.fr/dumas-01277887
Submitted on 23 Feb 2016HAL is a multi-disciplinary open access
archive for the deposit and dissemination of sci-entific research documents, whether they are pub-lished or not. The documents may come from teaching and research institutions in France or abroad, or from public or private research centers.
L’archive ouverte pluridisciplinaire HAL, est destinée au dépôt et à la diffusion de documents scientifiques de niveau recherche, publiés ou non, émanant des établissements d’enseignement et de recherche français ou étrangers, des laboratoires publics ou privés.
Coping with coffee wilt disease (Tracheomycosis) in
Uganda
Naomi Edith Nabeta
To cite this version:
Naomi Edith Nabeta. Coping with coffee wilt disease (Tracheomycosis) in Uganda. Economics and Finance. 2007. �dumas-01277887�
COPING WITH COFFEE WILT DISEASE
(TRACHEOMYCOSIS) IN UGANDA
U
RECEtVEDj
10
NABETA NAOMI EDITH
B.SC. AGRIC. (HONS)
98/HD/807
SUPERVISORS:
DR. BARNABAS A KIIZA
DR. GABRIEL ELEPU
A THESIS SUBMITTED TO THE SCHOOL OF GRADUATE
STUDIES IN PARTIAL FULFILLMENT FOR THE AWARD OF THE
DEGREE OF MASTER OF SCIENCE IN AGRICULTURAL
ECONOMICS OF MAKERERE UNIVERSITY
FR LRAy
AccesLb))
E
Date:
FIRST SUPERVISOR
6
0
Date... / ...
Signature
DR.
DECLARATION
I NABETA NAOMI EDITH HEREBY DECLARE TO THE BEST OF MY
KNOWLEDGE AND UNDERSTANDING THAT THE ORIGINALITY
OF THE FINDINGS IN THIS THESIS IS MY WORK, AND HAS NEVER
BEEN PRESENTED TO MAKERERE UNIVERSITY OR ANY OTHER
UNTVERSITY FOR THE AWARD OF A DEGREE
S i g n a t u r e
... Date. ....
T/i!.7
NABETA NAOMT EDITH
THIS THESIS HAS BEEN SUBMITTED FOR EXAMINATION WITH
THE PERMISSION AND SATISFACTION OF THE FOLLOWING
UNTVERSITY SUPERVISORS
SECOND SUPERVISOR:
Signature. ...
Date:
DR. GABRIEL ELEPU
DEDICATION
For Natalie, David and Christian
ABSTRACT
Coffee, being Uganda's premier export commodity, the resultant declines in production resulting from Coffee Wilt Disease (CWD) (a vascular fungus disease with no known cure yet) pose a significant challenge to earning capacities both at individual household and national levels. Faced with similar shocks, farmers else where in the developing world cope by acquiring debts, sell of assets, dis-saving, cutting back on household expenditure and consumption (especially food). They also take on wage employment, do trading, migrate, live on gifts and remittances, and even live on theft. It was however, not clear how Ugandan coffee-farming households in the hard hit areas have responded to CWD. The study hypothesized that the farmers were coping by replanting, diversifying into alternative cash crops, food crops and livestock among others and that; replanting increases with increasing CWD incidence. This study therefore provides information on the alternative coping strategies employed by households in the CWD affected areas, the extent of replanting and the factors that significantly influence the extent to which households replant their coffee fields using descriptive statistics and a Tobit model. The data from 370 respondents was obtained from the national baseline survey on CWD conducted in 2002 in 20 coffee growing districts that were the hardest hit with CWD by then, using a purposive multi-stage random-sampling procedure. The farmers' responses were solicited using an orally administered pre-tested structured questionnaire. The results from a correlation analysis showed that the major household responses to the coffee wilt epidemic were coffee replanting, livestock rearing and off farm activities at the 5% level of significance followed by wage labour employment and switching to alternative cash crops at the 10% level of significance. The Tobit model analysis indicated the major determinants of the extent of replanting as a response to CWD as the household's wealth status, the intensity of the CWD attack on the farmers' coffee plantation, the duration of CWD on the field, the farmers' education level, and the total number of household members.
Study findings imply that it may be very difficult or even impossible, to reach the poor via a voluntary coffee planting decision. In order to reach the poor, the costs of planting would have to be reduced. Public action is needed to partly insure andlor subsidize poor farmers' production and price risks. Study results further indicated that farmers' probability to replant increases with the duration of CWD in the coffee fields. This points to the
likelihood that farmers may be unaware of the appropriate response measures to CWD and that affected farmers take too long to gain access to required information. Farmers in CWD prone and already infected areas need advice on combating CWD and this could be done through a deliberate awareness campaign in such areas. Increased farmer-researcher-policy maker interaction is also essential in order to have the voice of the farmers' heard and to foster increased ownership of recommended combat strategies to CWD.
TABLE OF CONTENTS
DECLARATION... DEDICATION... 'U ABSTRACT...iv LISTOF TABLES...viii LISTOF FIGURES ... ix LISTOF ABBREVIATIONS...x ACKNOWLEDGEMENT... xi CHAPTERI...I 1.0 iNTRODUCTION ... 11.1 Background to the Study...1
1.3 Objectives and Hypotheses of the Study ...5
1.3.1 Specific objectives...5
1.3.2 Hypotheses...5
1.5 Justification of the Study ...5
1.6 Organisation of the Thesis...6
CHAPTERII ... 7
2.0 LITERATURE REVIEW ...7
2.1 Dealing with Risk(s) in the Less Developed Countries...7
2.2 Examples of Empirical Studies and Estimation Procedures ... 11
CHAPTERIII ... . ... 14
3.0 METHODS AND PROCEDURES...14
3.1 FieldMethods ...14
3.1.1 Area of Study...14
3.1.2 Sampling Frame and Procedure...14
3.1.3 Administration of the Survey Instruments...15
3.2 Analytical Methods...15
3.2.1 Data...15
3.2.2 Conceptual Framework of Farmer Coping Mechanisms to CWD...16
3.2.3 Data analysis 18
3.2.4 Regression analysis...18
3.2.5 Exploratory Data Analysis...20
3.3 Data and Model limitations...22
CHAPTERIV ...23
4.0 RESULTS AND DISCUSSION...23
4.1 Descriptive Analysis...23
4.1.2 General Socio Economic Characteristics...23
4.1.3 Coffee production ...25
4.1.3.1 Coffee Production Characteristics...25
4.3.1.2 The Incidence and Response Strategies to CWD ...26
4.3.2 Econometric Analysis...31
CHAPTERV...35
5.0 CONCLUSIONS AND RECOMMENDATIONS ...35
5.1 Summary and Conclusions ...35
5.2 Recommendations of the Study...37
5.3 Recommendations for Further Research...39
BIBLIOGRAPHY... 40
LIST OF TABLES
Table 1 General Socio Economic Characteristics... 24
Table2 Land use... 25
Table 3 Characteristics of the Coffee Farming Enterprise... 26
Table 4 CWD Incidence and Farmers' Response Strategies... 27
Table 5 Correlation Analysis Results of Farmer Response Strategies 28 Table 6 Percentage distribution of other important crops with CWD incidence... 30
Table 7 Percentage distribution of off-farm activity with CWD incidence...30
Table 7 Descriptive Statistics for Variables used in the Analysis... 32
Table 8 Determinants of Proportion of Coffee area Allocated to New Plantings... 32
LIST OF FIGURES
Figure1 Sampling Frame...15 Figure 2 Schematics for Cause and Effect Relationships in CWD Farmer Coping
Mechanisms...17
LIST OF ABBREVIATIONS
BOU Bank of Uganda
dRAB International Centre for Research in Agriculture and Development
CORI Coffee Research Institute
CWD Coffee Wilt Disease
EDF European Development Fund
FAO Food and Agricultural Organisation
IACO Inter African Coffee Organisation
ICO International Coffee Organisation
IFRA Institute Francias de Recherche en Afrique
MFEPD Ministry of Finance and Economic Planning and Development
NARO National Agricultural Research Organisation
RRA Rural Rapid Appraisal
PRA Participatory Rural Appraisal
UCDA Uganda Coffee Development Authority
UCTF Uganda Coffee Trade Federation
WB World Bank
WFP World Food Programme
ACKNOWLEDGEMENT
"An insurmountable mountain" is what this work seemed: . . .the higher you climb, the further away you feel from the peak.... but Jesus Christ the Author and Finisher of faith indeed kept his solemn promise
I am greatly indebted to the various funders of this work. I thank first and foremost EU-.EDF for the tuition fees for the entire programme through institute funding to
Corn;
secondly, I thank NARO/CORT my esteemed employers for granting me the permission to participate in the training; C1RAD for the technical and material support given through the Guest Scientist position at Montpellier; IFRA-Nairobi for the financial support that went a long way to fill the money gap; the individuals; many of you underwrote me; I cannot possibly name you individually here. Every handout even the smallest made it possible for my day to day to run. Please accept my sincere thanks.I specially thank my supervisors Dr B. Kiiza and Dr. G. Elepu who shaped the idea and tirelessly guided me throughout the entire period. I thank the then Director CORT Dr. D. Kyetere, now Director General NARO, and Senior Principal Research officer Dr. G. Hakiza for their support and patience. I wish to thank all the colleagues at CORI.
I am most heartily indebted to my most loved: Mother, Beatrice Jane Baseke Nabeta, children, Natalie, David and Christian and, to their father Dr. D.S. Muduuli who stood by me unconditionally; I regret that they suffered when I suffered, hurt when I hurt for the "life-giving" decision that I took in the course of the programme, may the almighty God re-establish.
Finally, I exalt the most high name of Jesus Christ for the abundant grace that just handed me victory in his own perfect timing.
Thank you Jesus!
CHAPTER I 1.0 INFRODUCTION
1.1 Background to the Study
Tracheomycosis/Coffee Wilt Disease (CWD) is a vascular disease of the coffee plant caused
by the fungus Fusarium xylarioides (Steyaert, 1948) whose sexual stage is Gibberella
xylarioides (Heim and Saccas, 1950). The devastating fungal disease attacks the vascular
system of the plant and blocks it causing the plant to wilt and eventually die. The earliest
symptom of the disease is folding of leaves followed by wilting and leaf fall. The stems dry
one at time until the whole shrub dies out completely. Affected trees take only between a few
weeks to six months to die with resultant total yield loss (Hakiza, 1997; Van de Klashorst and
Mrema, 2004). The disease is known to attack all species of coffee including the wild ones (Wrigley 1988; Clarke and Macrae, 1988). By the year 2000, the disease intensity was
approximated at 4.8% and a total of 14.5 million trees had been destroyed since the disease
was first identified (UCDA, 2000). According to Guillemont (1946) Fusarium xylarioides
was first reported from the Central African Republic in 1927 on Coffea excelsa. It was later
described in the Democratic Republic of Congo (DRC) in 1948 on robusta coffee and also
spread to Cameroon (Steyaert, 1948). Occurrence of CWD on the Uganda area bordering the
DRC was in 1994 (Flood, 1996). First reported in 1993 in Bundibugyo, the disease has since
escalated and coffee tree and yields have declined in most parts of the affected districts
(Hakiza, 1995). By 1997, the disease that had been restricted to the vest of the River Nile,
had spread to Eastern Uganda and is now confirmed in all Robusta growing districts (UCDA,
2004). Alternative strategies for controlling coffee wilt disease include altering cultural
practices and developing resistant varieties.
1.2 Problem Statement
Coffee is Uganda's premier export with total coffee exports accounting for 2 1 % of Uganda's foreign exchange export earnings in 2005 (UBOS, 2006). Currently Uganda is the largest producer of Robusta coffee in Africa with production of Arabica coffee, which is not affected by CWD accounting for less than 10% of total production. On the international market scene, Uganda's dry processed Robusta coffee is renowned for its mild taste and is generally considered to be of superior quality, however, all of the Robusta growing districts are now affected by CWD. The spread of CWD is thus a major threat to the Ugandan economy. Farmers incur losses when coffee trees die since supply and the attendant gains of commodity supply are diminished.
At farm level, Coffee provides an important source of income to 500,000 smaliholder farmers who traditionally intercrop it with food crops such as bananas, beans and groundnuts and shade trees (Ochan, 2004). According to the UCDA, nearly 5 million people depend on the coffee sector for direct and indirect employment. Falling farmer incomes as a result of not just the crop yield loss but also uncertainty and risk posed by CWD at household level hence
lead to less welfare. A study in Mpigi district showed the disease to have already affected farmers' earnings and subsequently their ability to meet household's cash requirements such as school fees, domestic needs, hired labour, taxes and investment (UCDA, 1998). The overall loss per affected farmer countrywide by 2000 had been put at Ug.shs 130,000 per year which is 30% of Uganda's per capita income estimated at US$250 (UCTF, 2000).
CWD impact on farmer's well-being has forced them to respond in various ways. According to Moser (1998), Narayan and Pritchet (1997), under risk/shock, people have to rely on their physical, human, and financial assets or social capital to cope with shocks. Vulnerability is
therefore primarily a function of a household's assets and its possibilities to deal with the risk. Welfare losses do occur not only due to actual outlays and opportunity costs for risk reduction measures but also from risk management strategies that concentrate in lower risk and lower return portfolios (Morduch 1995; Zimmermann and Carter 1996; Jalan and Ravaillon, 1998). Farmers are known to respond to these shocks by acquiring debts, sell of assets, dis-saving, cutting back on household expenditure (and consumption especially food), taking on wage employment, trading, migrating, living on gifts and remittances, and even living on theft (Keen, 1990).
At national level, total loss due to the disease was put at 4% or an equivalent of 12 million Robusta tree stocks (UCTF yearbook, 1999). Hence at an average yield of 0.7 Kgs of clean coffee per tree, approximately 8.4 tones of clean coffee equivalent estimated at Ug.shs. 13.44 billion per year is lost annually. This income loss to the nation may lead to instability of the macro-economic variables, especially the exchange rate and to a less extent inflation rate and interest rate (BOU, 1999; MFPED, 2000). For instance, the volume of coffee exports declined from a peak of 254,000 metric tones in 1996/97 to 159,834 tones in 2002/03. The decline in volumes coupled with low world coffee prices have led to significant declines in foreign exchange earnings overtime, thus making coffee tree death due to CWD a significant detractor to the growth and development of the Ugandan economy. In order to uphold the national goals, the Uganda government has promptly responded to this problem through the intensification of the coffee replacement programme spearheaded by UCDA. This programme has the objective of massive production and dissemination of improved planting material to farmers through an embryonic network of private nurseries assisted financially and technically by the parastatal. The coffee sub-sector expansion programme has seen both
coffee rejuvenation 1 and replacement campaigns going on concurrently to achieve sustained increasing coffee production. Coffee replacement aims at increasing coffee yields without necessarily increasing area. Effort is geared to the encouragement of rapid replacement of old robusta coffee stocks with improved clonal material, yielding up to 3,000kg/Ha of dry cherry compared to 1,200kg/Ha from traditional robusta according to the (UCDA 1996). However, new and clean plots are advised where replacement of the diseased plants which is a costly and labour intensive exercise. This is due to the residual loads of fungus left in the soil. This was the reason that partly accounted for the serious limitation of the short-lived phyto sanitary control measure of "uproot and burn" that was recommended sometime well into the onset of the disease (Hakiza, 1996).
Munyambonera (2000) shows that although CWD has caused so much damage, many farmers still regard coffee as a main source of income, therefore, favoring replacement of the affected trees and further plantings. However, the determinants of the choice of replanting as a household response have not yet been established, and therefore, the challenges and opportunities paused to coffee farming remain virtually unknown. Provision of such information will provide policy guidelines to the coffee replanting programme exercise, which should counter the decline in coffee production levels and the attendant declines in incomes at national and household levels. Biological studies to understand the behavior of the pathogen have been done and research in the epidemiology of the disease is continuing by biologists at CORI. However, farmer behavior in response to the scourge has not been studied and hence the farmer coping mechanisms to CWD are not known. This research provides information on the coping strategies adopted by farmers to mitigate the risks arising from incidence of coffee wilt disease and deter spread. This study therefore fills two information
Refers to the re-invigoration of otherwise worn down tree stocks (shamba) through special and intensive management, commonly referred to as rehabilitation.
gaps; it provides information on the behavioral response of households to CWD in form of
the range of coping strategies employed and in addition provides factors that enhance choice
of replanting as a major household response to CWD.
1.3 Objectives and Hypotheses of the Study
The overall objective of the study is to characterize farmer response/coping strategies to
CWD incidence in Uganda.
1.3.1 Specific objectives
To characterize farm households by rate of incidence of CWD.
To determine the majOr coping responses of farmers to CWD.
To determine the factors that influence the likelihood and degree of replanting as a
response to CWD.
1.3.2 Hypothesis
The likelihood and degree of replanting significantly increases with increasing CWD
incidence.
1.5 Justification of the Study
CWD currently affects 70% of the Robusta coffee growing area in Uganda and has been
reported on the borders of Tanzania and Rwanda with Uganda. If left unchecked, it poses a profound threat to the coffee industry in East Africa, a region whose countries depend heavily
on coffee as a foreign exchange earner. The disease is also a threat to the welfare of the over
500,000 smallholder farm households in Uganda, who depend on coffee as a source of
household income. An understanding of the major coping mechanisms to the disease will
effectively guide policy and resource allocation activities aimed at curbing the negative
welfare effects of the disease.
1.6 Organisation of the Thesis
The study has five sections; Chapter one deals with the incidence of CWD in coffee and the basis
for conducting this study. Chapter two is a review of existing literature related to this study.
Chapter three provides the methodology employed in achieving the study objectives. In Chapter
four, the results and findings are summarized while chapter five focuses on the conclusions and
CHAPTER II 2.0 LITERATURE REVIEW
2.1 Dealing with Risk(s) in the Less Developed Countries
The predominately smaller holder farming systems are acutely risk prone to weather shocks, crop pests, animal and weeds damage which have very large idiosyncratic component of up to 87% in a study of 15 Ethiopian communities (Dercon et al., 1996). These idiosyncratic (micro-level) risks have a significantly high covariate (meso- and macro-level) component and result in high-income variability. Increase in risk reduced farm profits of the poorest quarter of households by 35 percent, but left the wealthiest farmers virtually unaffected in South India (Rosenzweig and Binswanger, 1993). In China for the poorer households, 40 percent of an income shock is passed on as lower consumption and only 10 percent for the richer households with better access to mechanisms of insurance (Jalan et al., 1999).
When a shock occurs, people cope by cashing in their insurance; selling livestock or other assets they accumulated or calling on network transfers or loans (Dercon et al., 1996). When these mechanisms fail or prove insufficient, households may try to earn additional income by increasing labor supply, diversifying labor supply across additional household members (women or children), or migrating to unaffected areas. If all fails, households reduce consumption or go hungry (Kochar, 1986; Jacoby and Skoufias, 1997; Moser 1998 and Dercon, 1999).
Confronted by shock, the poor have fewer options than the wealthy. Because they own fewer physical assets, the poor are more likely to rely on increasing their labor supply (Dercon et
al., 1996). And even if they have developed elaborate mechanisms for coping with risk these mechanisms are far from being able to eliminate vulnerability. Faced with falling incomes,
poor households try to increase the labour market participation of household members, especially women and children. This response documented in many countries, was strong in Indonesia. Households headed by women or with mainly very young members can rely less on this response because they have fewer household members who can increase their participation in the labour market. Past studies in this area have examined the impact of income shocks on household consumption and saving behavior (Paxson, 1992). Household responses typically are a mix of consumption reduction, sale of assets or taking up credit, and seeking out nonagricultural income sources
In practice, poorer households achieve relatively little income smoothing even via income portfolio adjustments (Lawrence, 1992) though Roseznweig and Binswanger, (1993) observe that they are unable to explain the large amount of grain and other liquid assets held by Indian households using traditional portfolio theory. It is believed that access to relatively safe and profitable assets that might be useful for consumption smoothing, is what may be limiting. Lumpiness in assets may be a reason why the poor cannot protect themselves easily via assets. Although buying and selling is a fairly common strategy for coping with income fluctuations, it is not feasible for many poor households because of the assets lumpiness: purchasing livestock requires a significant amount of prior saving. In Tanzania for example, a cow costs about a fifth of mean crop income, explaining why only half of households in western Tanzania owned any cattle (Dercon et al., 1996). Whenever possible, poor households use more divisible items such as buffer stocks. In three south Indian villages, farmers held buffer stocks and currency as their main risk strategy. Households with more land relied primarily on crop inventory, while poor households held currency, reflecting the inefficient functioning of credit markets in poor villages (Morduch, 1995). However little
attention has been paid to explaining why and under what circumstances such savings are held in specific assets.
A concern in studying specific aspects of consumption smoothing by households is the implications of the strategies adopted for household income and expenditure; whether costly risk-coping strategies lead to vicious circles of poverty. In India, where women and children account for 73 percent of the population below the poverty line, women routinely enter the informal labor market to cope with shocks. Their low education levels confine them to low-paying, irregular work that is often an extension of domestic work. This puts women in a worsening cycle of poverty and vulnerability (Skoufias, 1997). Several papers have pointed out inefficient agricultural production behavior (crop choice, technology adoption, plot diversification) as reason for income smoothing (Morduch, 1995), but the magnitude of such effects are not well established (Kochar, 1995). The richer farmers are better able to diversif' into high-risk high return crops and into nonfarm sources of income.
Way out of crop risk would be to grow higher yielding varieties and use more fertilizer and other purchased inputs, which poor farmers cannot afford. However, this also presents more downward risk, which the poor cannot take on since they lack the resources to absorb a potential shock. This forces asset- poor households to handle crop risk by raising low risk, low-return crops, thus making it hard for them to escape poverty. Poor Indian farmers devote a larger share of land to traditional varieties of rice and castor than to high yielding varieties (Morduch, 1995). Tanzanian farmers without livestock grow more sweet potatoes (a low-risk, low-return crop) than do farmers who own livestock. As a result the returns to farming are 25 percent higher per household member for the wealthiest group than for the poorest (Dercon and Krishnan, 1996). The richer are better able to divers ifs' into nonfarm activities. In the
Sahel, wealthier households make riskier decisions and have more diversified portfolios (Kochar, 1995). Landholdings are positively associated with investments in non-farm activities in Burkina Faso and non-farm income correlates negatively with farm income (Morduch, 1995). Households can also protect themselves by self-insurance: insure themselves by accumulating assets in good times and drawing on them in bad times. Theoretically, the strategy is effective if assets are safe and have a positive rate of return, especially if the rate of return exceeds the rate of time preference. In practice, returns to assets may be negative and many poor households have high rates of time preference (they are "impatient" or out of necessity), which limits the extent to which they accumulate assets (Dercon, 2000). Another problem is that asset values and income are often covariate following an aggregate shock, so that the value of assets is lowest just when they are needed most. A drought that destroys a harvest, for example may also weaken and kill cattle, which farmers use as buffer stock in many poor countries.
The terms of trade of assets relative to consumption may also deteriorate as a result of the shock, as everyone tries to sell assets at the same time. Thus both supply and demand factors contribute to the fall in asset prices: the income shock induces everyone to sell assets and the decline in purchasing power reduces demand (unless buyers from outside the shock zone show up). This argument also works in reverse: in good times, everyone will want to buy the buffer asset, pushing up its price, making the strategy very costly (Dercon and Krishnan, 1996). Households also use group-based mechanisms of informal risk sharing that rely on social capital of a group of households. Typically informal insurance involves a network of mutual support between members of a community or extended household, within ethnic groups, or among members of the same occupation. It often involves ties between migrants and their places of origin. The wider these networks are, the less they are subject to the same
pattern of risk, and more effective they are at risk pooling (Morduch, 1995). Households can
also take on formal insurance but market-based formal insurance plays a minor role in risk mitigation for the poor. Government actions include activating the transfers or workfare
mechanisms, social assistance, subsides, social funds and cash transfers all envisaged under
the social safety net. Self-insurance can be made possible in rural setting by diversification of
crops available to farmers and by the provision of technology and extension service to make
this diversification possible. Opening up trading opportunities, through infrastructure
investments for example, can stimulate this diversification. However liberalization of markets can have mixed effects and does not always provide benefits to the poor. In some cases
middlemen have stepped in between farmers and export traders, and the gain from open trade
has mostly accrued to them (Dercon, 2000).
2.2 Examples of Empirical Studies and Estimation Procedures
While direct area-change effect of tree death (due to CWD) as a measure of disease impact on
coffee and other crops is an issue of no dispute, its' estimation is an empirical question.
Economists in the past have deplored the special problems associated with formulating
models involving planting and removal responses for perennial crops (Minami et al., 1985).
Estimation of output and yield supply response has been a subject of intense research (Saylor, 1974; Nakabo, 1992; and Nanyeenya and Ngategize, 1997). These studies have however had
to deal with available data, which consists of time series on total area under coffee trees
classed dichotomously as bearing and non-bearing (Matthews et al., 1985). Even though
these studies have been innovative in extracting information from the available data, they
have had to ignore or deal crudely with the effects of changing age composition of the trees
on output, and the planting and removal responses.
According to Matthews et al. (1985) if the profit expectations affecting removals differ from the long-run profit expectations affecting planting decisions, there is little reason to expect the disturbance terms of the two to be correlated. Therefore, the planting and removal functions may be estimated separately rather than jointly. Enormous difficulties are however faced in estimation of acreage response arising from lack of sufficient data pertaining to plantings and removals (Nakabo, 1992) and according to French and Matthews (1971) modifications of the basic models are required to facilitate estimation only within a more restricted empirical framework. Minami et al. (1985) observe that since the direct area-change function must account for factors affecting both plantings and removals/tree deaths, it may involve extremely complex structures with lengthy distributed lags.
Most studies explaining supply relationship have used simple models. But for perennial crops such as coffee, the decision to plant, maintain and increase productivity of the existing stock may require more complex and complete modeling (Wickens and Greenfield 1973). Supply response models for perennial crops using linear programming approach have also been developed.
Tree loss effect of CWD to coffee production has planting, removal/tree death, yield and time dimensions in response to the disease that are virtually un-encountered, possibly, in all annual and perennial crops. Faced with the slightly different data problems from models developed in the past, data available in this research is to the detail rich enough to enable farmer response mechanisms to be modeled quite differently from previous research (Saylor, 1974; Nakabo, 1992 and Nanyeenya and Ngategize, 1997). In this research, the impacts of some factors on the plantings and removals have been dealt with by an estimation using the Tobit
equation model weighted to correct for heteroscedasticity. The Tobit model developed in this
study is to provide an alternative structural base model for estimating response relationships
that encompass these dimensions.
CHAPTER III
3.0 METHODS AND PROCEDURES 3.1 Field Methods
3.1.1 Area of Study
The study was conducted in 20 selected robusta coffee growing districts, namely: Kayunga, Mukono, Mpigi, Luweero, Rakai, Masaka, Sembabule, Mubende, Kiboga and Kibaale; Kamuli, Jinja, Iganga, Mayuge and Bugiri and Kyenjyojo, Bundibugyo, Bushenyi, Rukungiri and Hoima, in a National Baseline survey on CWD in 2002. The districts were purposively selected for their high disease status.
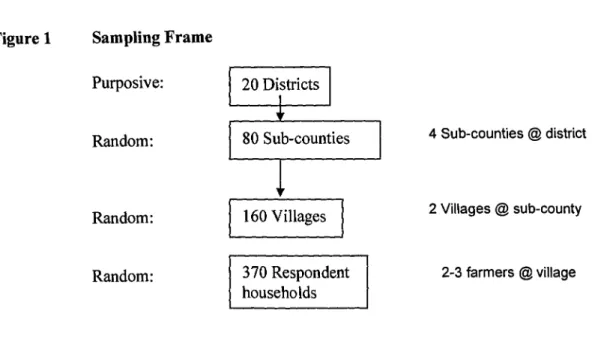
3.1.2 Sampling Frame and Procedure
The Purposive multi-stage Random-sampling procedure was applied as described in Fig 1 where, the districts were selected purposively, the sub-counties randomly, the villages randomly and the respondent households randomly. A system of random numbers created by the SPSS computer package was used to randomly select the sample that was used in the study. The sub-counties were randomly selected using lists from the district headquarters. Using lists from the sub-county headquarters, villages were also then selected randomly. Seven villages per district were selected for sampling and 2-3 farmers per village were sampled bringing the sample to 370 respondent households.
Figure 1 Sampling Frame
Purposive:
1
20 DistrictsRandom:
I
80 Sub-counties1
4 Sub-counties © districtRandom: 160 Villages 2 Villages @ sub-county
Random: 370 Respondent
I
2-3 farmers @ village householdsI
3.1.3 Administration of the Survey Instruments.
The selected households were visited and orally interviewed using pre-tested structured
questionnaires (appendix C). Before that, the enumerators who included relevant assistants,
agricultural officers and local leaders were trained on how to carry out the exercise paying particular emphasis on how to bring the true meaning of the questions. The enumerators then
proceeded in two teams of four enumerators each. Checklists were used to collect
supplementary information from the relevant departments and ministries.
3.2 Analytical Methods 3.2.1 Data
The model estimation was based on survey/cross-sectional data. The data is both qualitative
and quantitative. To identify farmer coping responses against CWD the data solicited
included:
o Crop loss in terms of number of trees lost to CWD. The intensity of CWD incidence was
measured as the coffee area lost to CWD/ total coffee area (acres).
o What measures respondents had taken in response to the CWD including sale of assets,
borrowing, crop and enterprise diversification, etc.
o Asset types and savings measures.
o Information on time allocation for current income-generating activities for both on- and
off- farm activities.
o Farmers' resource endowments, perceptions to and technological interventions against
CWD.
o Self-classified status of wealth.
While to investigate the factors influencing replanting as one of the major response to coffee
wilt disease the cross-sectional data solicited included
o Crop loss in terms of number of trees lost to CWD
o Data on the farmer household characteristics like age, family size, gender, education, land
tenure, farm size and farming experience.
o Production characteristics like type of farming enterprise and acreage, age, type and
acreage of coffee enterprise.
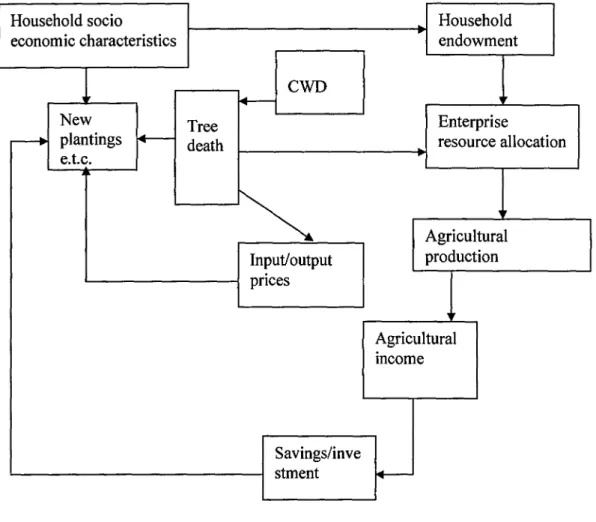
3.2.2 Conceptual Framework of Farmer Coping Mechanisms to CWD
Coping mechanisms are the various activities that individuals, households and communities
develop to overcome crisis. They vary by demographic and household characteristics and
according to the nature and duration of the emergency (Dercon, 2000) and the household's stage in coping with the crisis. The right hand side of figure 2 shows how the tree deaths to
CWD releases land for other use. This influences enterprise resource allocation, which
determines the agricultural income and therefore investment in new plantings. The household
considers its cash wealth, coffee loss to CWD, assets availability, and on and off- farm
income to decide on how to react to CWD, how much resources to allocate to cash crop and
other enterprises production, and how much to consume of the marketed goods. The left hand
side of Figure 2 indicates that the new planting option or any other farmer response to CWD
also depends on the farmers' socio economic characteristics. Tree deaths due to CWD affect output levels causing a change in the farm gate prices of coffee and the profitability of the
crop which, affects farmer' response to CWD. The decision to plant is a behavioral process of the type of rational expectations. Planting can be done if profits are zero or near zero (Muth,
1961). The synergies illustrated in Figure 2 show the existence of a relationship between tree
loss and new plantings (an example of farmer response to C)VD).
Figure 2 Schematics for Cause and Effect Relationships in CWD and Farmer Coping Mechanisms
Household socio Household economic characteristics endowment
CWD New
H
Tree plantings death e.t.c. Enterprise resource allocation Agricultural Input/output production prices Agricultural income Savings/inve stmentCAUSE and EFFECT RELATIONSHIPS
3.2.3 Data analysis
Data analysis was done by the following methods:
Descriptive analysis: Frequencies, means etc... using SPSS/PC+ programme
Regression analysis using STATA: The data were tested and corrected for
multicollinearity and heteroscedasticity before running equations to identify what factors influence farmer's coping strategies.
3.2.4 Regression analysis
The second objective of the study, which was to identify farmer coping responses to CWD,
was answered in the proceeding descriptive analysis but provided only indicative results. A
deterministic analysis using a Tobit model was used to determine the factors that influence
replanting of coffee trees as one of the major farmer coping strategy. The extent/intensity of
replanting carried out was defined as the proportionlpercentage of coffee area devastated by
CWD that was reallocated to replanting. The farmer has to make a rational decision on which
proportion of initial coffee area to replant after a CWD attack with proportions ranging from
0% and above. The profit maximising level of the proportion of total coffee area allocated to
new plantings y was taken to be explained by the model:
y=x'1 /3+p, i=1 ... n
Where x' is a (lxK) vector of explanatory variables and p, z N(0, a 2 ) and is independent of
other errors. /3 is a vector of parameters. For any household, the actual proportion of total area
devastated by coffee wilt allocated to new coffee plantings or replanted after a CWD attack
(y) is
yi=
I
Y
ify>0 0 ify<0Thus the observed level of replanting may be greater than zero, which is reflected as, y > 0 or equal to zero which is reflected as y, :!~ 0. The tobit model used to analyse the determinants of
the observed level of replanting carried out was hence defined as
y =x'1 /3+p1 if x',/3+ 1u, >0 ... Equation 1 = 0 otherwise
Where the vector of explanatory variables xi is as defined in equation 2 below and 3 are the
parameters that were estimated.
Farmer choice of replanting as one of the major response depends on the intensity of CWD; Xj, the duration of the disease in the field and the spread of the disease. An analysis of the factors influencing choice of replanting was run using the Tobit model.
Y = a0 + a1 X1 + ... cX U+P ... ... Equation 2
Where
Y = Proportion of total initial coffee area under new plantings of coffee (%): Is expected to be increasing with increased tree area loss as farmers replace the lost coffee.
Xj = Intensity of CWD (Proportion of initial coffee area lost to CWD (%)) (exogenous) X2 = Number of livestock owned cows, pigs, goats and sheep (livestock
units: index where livestock numbers are aggregated using the following weighing
factors: cow=1; goat0.4; sheep=0.4) (Nkonya et al., 1998). Is expected to be positively related to new plantings
X3 = Total land holding (acres): Is expected to be positively related to new planting
because the higher the land holding the higher the area there is to make the new
plantings (Smale et al., 1991)
X4 = Size of household: The larger the family size the higher the availability of labour to make the new plantings (Bisanda et al., 1998)
Level of formal education attained (dummyl if attained primary level education or higher level education and 0 otherwise): Education influences adoption of
technologies and therefore influences the possibility to make new plantings (Nabbumba et al., 1996)
X6 = Acreage of clonal coffee (acres) is expected to be positively related to new plantings X7 = Acreage of traditional Robusta coffee (acres): Is expected to be positively related to
new coffee plantings because it is the older coffee, which is more susceptible to CWD and therefore being replaced (Munyambonera. 2000)
X8 = Duration of CWD on the farm (yrs): Is expected to be positively related to new coffee replanting because CWD has no cure and is spreading (Munyambonera, 2000)
X9 = off farm activity: (dummy: 1=yes, 0= otherwise): these are assumed to have an ambiguous influence on coffee replanting because they may either induce
abandonment of the coffee crop or provide extra income for purchase of replanting material.
Xjo = Age of household head
X11 = Sex of household head
3.2.5 Exploratory Data Analysis Multicollinearity
A crucial condition for application of regression analysis is that the explanatory variables are not perfectly linearly correlated. If the explanatory variables are perfectly linearly correlated,
that is, if the correlation coefficient for the variables is equal to unity, the parameters of the
regression become indeterminate: it is impossible to obtain numerical values for each
parameter separately and the method of least squares breaks down (Koutsoyannis, 1977).
This form of correlation is however not met in real life. In most cases there is only some degree of intercorrelation among variables in which case the correlation is between zero and
unity. This causes multicollinearity problems which impair the accuracy and stability of the
parameter estimates. It was therefore imperative to test for it in the variables. In the study,
multicollinearity was tested using the method of correlation matrix (Appendix B). The
correlation matrix shows there is no multicollinearity among the explanatory variables. The
diagonal elements of this matrix are called variance inflation factors (VIF1); they are given by (1 -R,2) where R•2 is the R2 from regressing the ith independent variable on all the other
independent variables. A high VIF indicates an R12 near unity and hence suggests
collinearity. Low VIF suggested little or no collinearity
Heteroscedasticitv and Normality tests
If the assumption of constant variances is violated then the condition of heteroscedasticity
arises. It has the consquences of giving biased estimators among others. It is therefore a
condition to be avoided. In the study heteroscedasticity has been tested using the Whites
method
the White's test for Ho : homoscedasticity
against Ha: unrestricted heteroscedasticity
chi2(176) = 158.19 prob> chi2= 0.8283 skewness chi2(18) = 19.79 prob >chi20.3449 21
3) kurtosis
chi2(1) = 2.28 prob>chi2 =0.13 12
In conclusion the p-values for the white's test and normality tests are all insignificant indicating the absence of heteroscedasticity, skewness and kurtosis in forthcoming
regressions.
3.3 Data and Model limitations
There was recall error of retrospective data on crop loss, household expenditure and income
due to lack of records. And matching of contemporaneous data, on land value and number of
household members by age and education categories with the retrospective data introduces
some measurement errors.
CHAPTER IV 4.0 RESULTS AND DISCUSSION
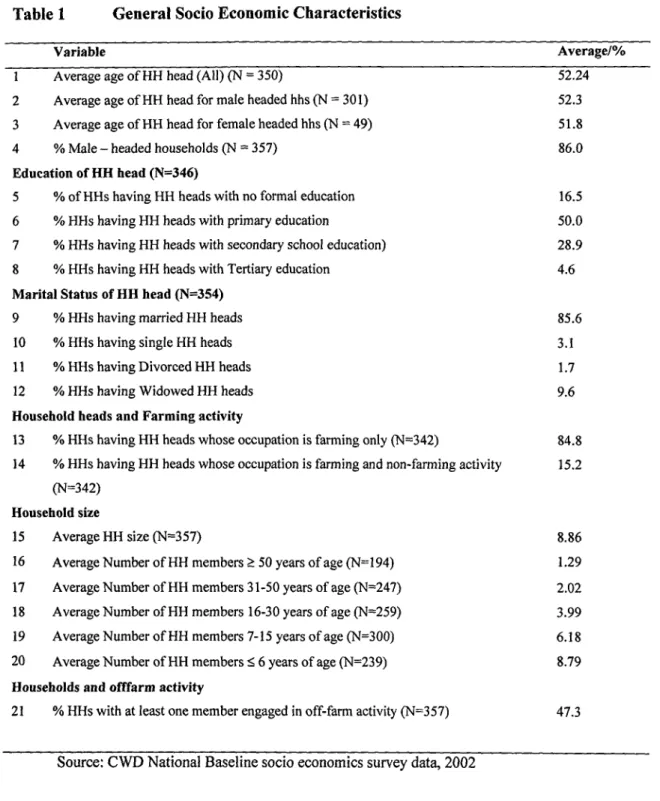
4.1 General Socio Economic Characteristics
The results in the following Table 1 show the general socio economic characteristics
described using averages and percentages. Most of the surveyed households (86%) are
headed by males who are on average slightly older (52.3 years of age) than the female
household heads (51.8 years of age). 50% of the household heads acquired primary school education, 28.9% have secondary school education and about one sixth (16.5%) never
received formal education. Nabbumba and Ngategize (1996) show that education and sex
influence adoption of agricultural technologies. If it is for the ability to learn and grasp
concepts, it is the same aptitude, perhaps, employed in reaction/response to crisis such as
disease outbreak. Education and possession of skill therefore may be of advantage especially
in response to a crisis such as a CWD outbreak. The majority of the household heads (85.6%)
are married, and do farming as their only occupation (84.8%). The average family size among
the surveyed households is 8.86 persons, most of who are dependants (below 15 years of
age).
Table 1 General Socio Economic Characteristics
Variable Average/%
1 Average age of HH head (All) (N = 350) 52.24 2 Average age of HH head for male headed hhs (N = 301) 52.3 3 Average age of HH head for female headed hhs (N = 49) 51.8 4 % Male - headed households (N = 357) 86.0
Education of HH head (N=346)
5 % of HHs having HH heads with no formal education 16.5 6 % HHs having HH heads with primary education 50.0 7 % HHs having HH heads with secondary school education) 28.9 8 % HHs having RH heads with Tertiary education 4.6
Marital Status of HH head (N=354)
9 % HHs having married HH heads 85.6
10 % HHs having single RH heads 3.1
11 % HHs having Divorced HH heads 1.7 12 % HI-is having Widowed HH heads 9.6
Household heads and Farming activity
13 % HHs having HH heads whose occupation is farming only (N=342) 84.8 14 % HHs having HR heads whose occupation is farming and non-farming activity 15.2
(N=342) Household size
15 Average RH size (1'-F=357) 8.86
16 Average Number of RH members ~! 50 years of age (N=194) 1.29 17 Average Number of HH members 31-50 years of age (N=247) 2.02 18 Average Number of HH members 16-30 years of age (N=259) 3.99 19 Average Number of HH members 7-15 years of age (N300) 6.18 20 Average Number of HH members :5 6 years of age (N=239) 8.79
Households and offfarm activity
21 % HHs with at least one member engaged in off-farm activity (N=357) 47.3
Source: CWD National Baseline socio economics survey data, 2002
The percentage of household heads in the farming only occupation is high 84.8%, perhaps providing an indication of the unavailability of other options at their disposal. With the limited options of off-farm activities available many households would be expected to venture into other farm enterprises such as alternative cash crops or livestock with the loss of coffee to CWD. The off-farm activities reported are trading, salariedlwage employment,
artisan, crafts, tailoring mechanics and driving, work shopping, small-scale selling, building
and construction.
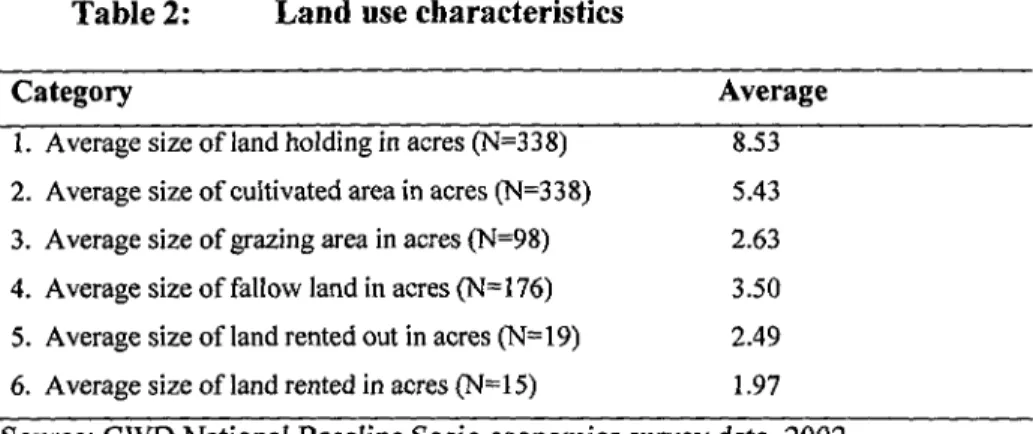
The results in the following Table 2 describe the land allocation of total land area of the
households between the various farming enterprises using averages.
Table 2: Land use characteristics
Category Average
1. Average size of land holding in acres (N=338) 8.53 Average size of cultivated area in acres (N=338) 5.43 Average size of grazing area in acres (N=98) 2.63 Average size of fallow land in acres (N176) 3.50 Average size of land rented out in acres (N19) 2.49 Average size of land rented in acres (N=1 5) 1.97 Source: CWD National Baseline Socio economics survey data, 2002
The average land holding is 8.53 acres and about 63.7% (5.43 acres) of this is cultivated; the
rest being under fallow or used as grazing land. A few households rent land in and out, with
the land rented in and out averaging 2.49 acres and 1.97 acres, respectively.
4.1.2 Coffee production characteristics
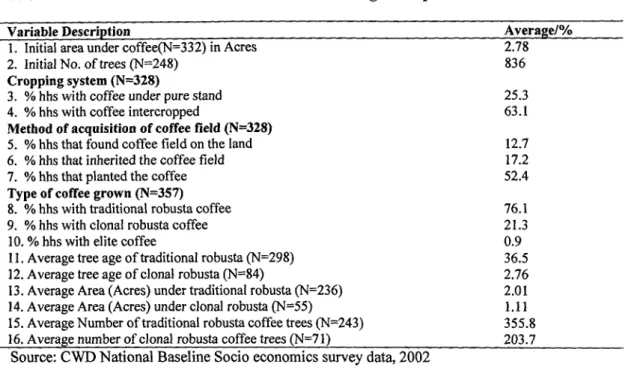
The results in the following Table 3 show the various characteristics of the coffee farming
enterprise. On average, a typical household in the study area initially had an average of 2.78
acres under coffee, mostly intercropped with bananas, multi-purpose trees, cassava and
sometimes annual crops like beans.
Table 3 Characteristics of the Coffee Farming Enterprise
Variable Description Average/%
Initial area under coffee(N332) in Acres 2.78
Initial No. of trees (N=248) 836
Cropping system (N328)
% hhs with coffee under pure stand 25.3
% hhs with coffee intercropped 63.1
Method of acquisition of coffee field (N=328)
% hhs that found coffee field on the land 12.7
% hhs that inherited the coffee field 17.2
% hhs that planted the coffee 52.4
Type of coffee grown (N357)
% hhs with traditional robusta coffee 76.1
% hhs with clonal robusta coffee 21.3
% hhs with elite coffee 0.9
Average tree age of traditional robusta (N=298) 36.5
Average tree age of clonal robusta (N='84) 2.76 Average Area (Acres) under traditional robusta (N=236) 2.01 Average Area (Acres) under clonal robusta (N'55) 1.11 Average Number of traditional robusta coffee trees (N=243) 355.8 Average number of clonal robusta coffee trees (N71) 203.7
Source: CWD National Baseline Socio economics survey data, 2002
Only 25.3% of the surveyed households planted their coffee in a pure stand. At the time of the survey, the average area under traditional Robusta coffee was about 2 acres compared to 1 acre for clonal coffee. The majority of the households (52.4%) planted their coffee, while others either inherited it (17.2%) or found it on the land when they acquired it (12.7%). Most households (76.1%) had their land planted to traditional Robusta with coffee trees averaging
36.5 years of age, and only a few (21.3%) had clonal coffee, with an average tree age of 2.8
years (Table 8). The "found it on land" and "inherited" categories of farmers did not actually plant the coffee. The majority of the "found it on land" respondents bought the coffee. The "inherited" coffee is some of the oldest coffee that parents have past on to their sons (and in a few cases daughters).
4.2 The Incidence and Response Strategies to CWD
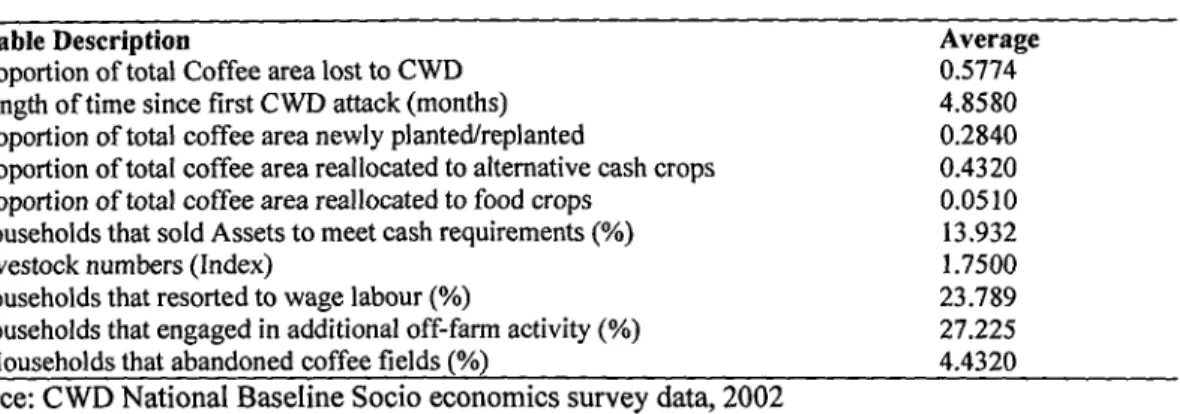
Results in Table 4 indicate the duration of coffee wilt on the fields to be 4 months on average. Results also show very high rates of CWD infection with farmers in the sample indicating that on average 57% of their initial coffee area was lost to CWD. Conversely, the descriptive
statistics show that farmers were replanting at very low rates with only 28% of total coffee area allocated to new coffee plantings compared to the average area devastated by CWD.
Table 4 CWD Incidence and Farmers' Activities
Variable Description Average
Proportion of total Coffee area lost to CWD 0.5774 Length of time since first CWD attack (months) 4.8580 Proportion of total coffee area newly planted/replanted 0.2840 Proportion of total coffee area reallocated to alternative cash crops 0.4320 Proportion of total coffee area reallocated to food crops 0.0510 Households that sold Assets to meet cash requirements (%) 13.932
Livestock numbers (Index) 1.7500
Households that resorted to wage labour (%) 23.789 Households that engaged in additional off-farm activity (%) 27.225
Households that abandoned coffee fields (%) 4.4320
Source: CWD National Baseline Socio economics survey data, 2002
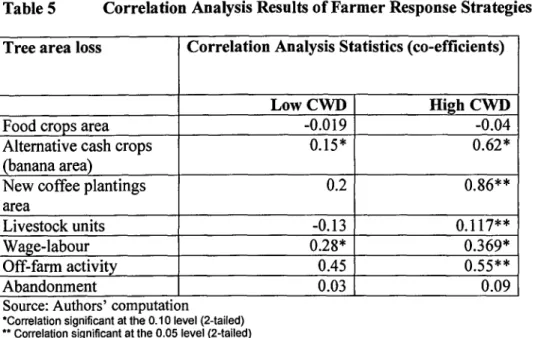
A correlation analysis of each response strategy with CWD incidence was conducted to determine which strategies were more likely choices for farmers faced with CWD attacks. A socio economic classification was first done where a measure of the incidence of the disease was computed as coffee trees lost to CWD/total number of coffee trees before CWD. The values obtained ranged from 0-1(0%-1 00%) and from these 2 strata were generated. The first strata dubbed the high incidence class; contained 50 households for which the proportion of coffee trees lost to CWD was greater than 0.50 (5 0%). The second strata had 173 households, which had the propotion of coffee trees lost equal to 0.49 (49%) and less. The results are given in Table 5.
Table 5 Correlation Analysis Results of Farmer Response Strategies Tree area loss Correlation Analysis Statistics (co-efficients)
Low CWD High CWD
Food crops area -0.0 19 -0.04 Alternative cash crops
(banana area)
0.15 * 0.62 *
New coffee plantings area 0.2 0.86** Livestock units -0.13 0.1 17** Wage-labour 0.28* 0.369* Off-farm activity 0.45 055** Abandonment 0.03 0.09
Source: Authors' computation
*Colation significant at the 0.10 level (2-tailed) ** Correlation significant at the 0.05 level (2-tailed)
In the correlation analysis, alternative cash crops area, new coffee plantings area and live
stock numbers and food crop area were correlated against the proportion of total coffee area
lost to CWD and the result observed under the high and the low CWD strata. The result
shows a negative and insignificant relationship with the food crops area decreasing with
increase in CWD incidence under both the high and the low CWD strata. One plausible
explanation is that these crops are cropped for the main reason of lowering management costs
of the coffee. They in practice mutually benefit from the management that is aimed mainly
for coffee. Hence as the coffee disappears there is no strong reason to crop them, probably because of their labour intensiveness, which is a limiting factor, especially for the aged
households. But the magnitudes of the correlation are small and insignificant therefore it is
not likely that food crop production is a coping strategy against CWD.
The results in Table 5 show the relationship of new plantings area and tree loss area in the high CWD strata is positive and significant. That means that new plantings area is increasing
with increase in tree area loss. The magnitude of the correlation is big which means that new
coffee plantings are likely to be a coping strategy against the disease. Plausible explanation is
that the majority of the farmers are replacing the destroyed coffee because they consider it to still be a viable enterprise as opposed to other crops (Munyambonera, 2000).
The results in Table 5 above also show that alternative cash crop area (banana area) has a positive and significant relationship to tree loss area in the low CWD strata. The magnitude of the relationship however is small which means the relationship is not so strong. But the relationship in the high CWD strata is positive and significant at the 10% level of significance and its magnitude big, which depict the alternative crops to be a strategy against CWD. From Table 5 above livestock numbers has a negative and insignificant relationship with tree area loss in the low disease strata. However in the high CWD strata, livestock numbers has a positive and significant relationship and although the magnitude of the relation is low, it is likely to be a coping strategy because it is highly significant. On the other hand, liquidation of household assets and abandonment of coffee plantations are insignificant indicating that these two options do not form a major component of household's response to coffee wilt. Conversely, the study indicates that the major household responses to the coffee wilt epidemic is coffee replanting, livestock rearing and off farm activities at the 5% level of significance followed by wage labour employment and switching to alternative cash crops at the 10% level of significance.
Other Crops
The results in table 6 below show a frequency analysis of the other important crops category. The results reveal a higher engagement of the hardest hit households in Musa (banana), 35%, followed by tomatoes, 20% and then fruit trees, passion fruit and leafy vegetable, each at 10% suggesting their role as a coping mechanism
Table 6: Percentage distribution of other important crops with CWD incidence Crop % CWD level (Class 1: Low CWD intensity) % CWD level (Class 2: High CWD intensity) % Total Tomatoes 8.70 20.00 13.95 Sugarcane 8.70 0.00 4.65 Passion fruit 8.70 10.00 9.30 Vegetables 17.39 10.00 13.95 Peanut 8.7 10.00 9.30 Sorghum 17.39 5.00 11.63 Trees 4.35 0.00 2.33 Musa 13.04 35.00 23.26 Ginger 4.35 0.00 2.33 Yams 8.7 0.00 4.65 Fruit trees 0.00 10.00 4.65 Total 100.00 100.00 100.00
Source: Authors' computation
Farmers are moving into these previously unimportant crops because they are reportedly
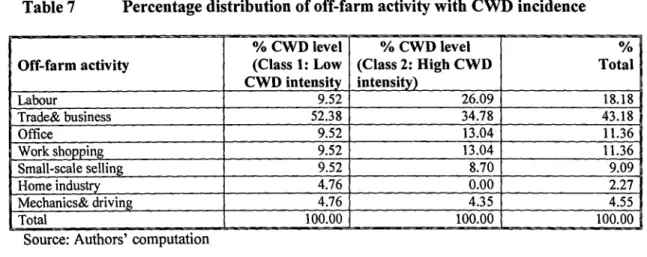
more paying and certainly less risky than coffee presently. Frequency analyses in Table 7
below show what type of off-farm activity the CWD hit farmers are engaged in. The hardest
hit farmers are more engaged in labour (27 0/6), trading
Table 7 Percentage distribution of off-farm activity with CWD incidence
Off-farm activity % CWD level (Class 1: Low CWD intensity % CWD level (Class 2: High CWD intensity) % Total Labour 9.52 26.09 18.18 Trade& business 52.38 34.78 43.18 Office 9.52 13.04 11.36 Work shopping 9.52 13.04 11.36 Small-scale selling 9.52 8.70 9.09 Home industry 4.76 0.00 2.27 Mechanics& driving 4.76 4.35 4.55 Total - 100.00 - 100.00 - - - 100.00
Source: Authors' computation
and business (3 5%) further confirming the role of these off-farm activities as a coping
mechanism. From the results, supply of labour does feature as important for coping with
shocks as Kochar (1999) Jacoby and Skoufias (1997) found out in India; Moser (1998) in Ecuador and Zambia and, Dercon (1999) in Ethiopia.
4.3 Determinants of Proportion of Coffee area Allocated to New Plantings
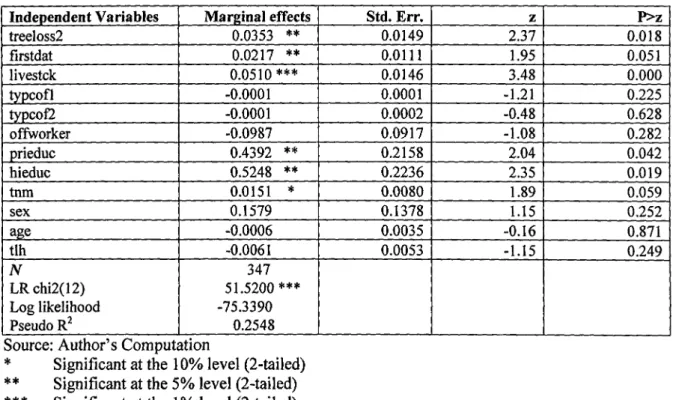
In order to answer objective no. 3 an analysis of the determinants of choosing replanting of coffee as a coping mechanism to coffee wilt was done using a Tobit model. The choice of model was relevant given that the range of proportions of total area affected by CWD that were replanted by the farmers lie between 0 and 1. Results of the analysis indicate that the model predictive accuracy is high amounting to 76% with the Log likelihood ratio significant at the one percent level (Appendix D). According to the results given in Table 8, the major determinants of choice of replanting as a response to CWD are the household's livestock asset holdings, the intensity of the CWD attack on the farmers' coffee plantation, the duration of CWD on the field, the farmers' education level, and the total number of household members.
The intensity of the CWD attack measured as coffee area lost to CWD as a percentage of total area under coffee (treeloss2) is a significant determinant of total coffee area replanted with coffee at the 5% level of significance. New coffee tree plantings increase by 3% with increasing tree area loss as farmers replace the diseased coffee. Hence assuming the availability of planting material and other factors conducive to the replanting decision, farmers in CWD affected areas are more likely to replant coffee with increasing intensity of CWD attack than abandon coffee farming. This finding hence reinforces findings by Munyambonera (2000) who asserts that although CWD has caused so much damage, many farmers still regard coffee as a main source of income, therefore, favoring replacement of the affected trees and further plantings. The longer the duration of CWD on the field, the higher the likelihood that the household replants the affected coffee field. The likelihood that a household will replant the coffee field increases by 2% with each additional month in the
Table 7 Descrintive Statistics for Variables used in the Analysis
Variables Variable Description Mean Std. Err. N
Dependent Variable
newpltgs
Proportion of total coffee area newly
planted/replanted 0.284 0.1519 370
Independent Variables
treeloss2 Proportion of total Coffee area lost to CWD 0.5774 0.4800 327 firstdat Length of time since first CWD attack (months) 4.8580 3.7292 370 livestck Number of Livestock units owned by the household 1.0751 2.6830 370 typcofl Average Number of traditional robusta coffee trees 600.2694 1,420.4930 370 typcof2 Average Number of traditional clonal coffee trees 109.4509 415.3147 370 offworker
Dummyl if household head has any off-farm
income 0.5871 0.4930 370
prieduc
Dummrl if household head has some primary
education 0.4933 0.5006 370
hieduc
Dummy= 1 if household head has some high level
education 0.3244 0.4688 370
tnm Total number of household members 9.1582 5.3515 1 370 sex Dummrl if household head is male 1.1263 0.3327 372 age Age of the household head 51.9491 15.6597 370 tlh Total land holding (acres) 4.5842 71.6616 370
Source: Authors' computation
Table 8 Determinants of Proportion of Coffee area Allocated to New Plantings
Independent Variables Marginal effects Std. Err. z P>z
treeloss2 0.0353 ** 0.0149 2.37 0.018 firstdat 0.0217 ** 0.0111 1.95 0.051 Iivestck 0.0510*** 0.0146 3.48 0.000 typcofl -0.0001 0.0001 -1.21 0.225 typcof2 -0.0001 0.0002 -0.48 0.628 offworker -0.0987 0.0917 -1.08 0.282 prieduc 0.4392 ** 0.2158 2.04 0.042 hieduc 0.5248 '' 0.2236 2.35 0.019 tnm 0.0151 * 0.0080 1.89 0.059 sex 0.1579 0.1378 1.15 0.252 age -0.0006 0.0035 -0.16 0.871 tlh -0.0061 0.0053 -1.15 0.249 N LRchi2(12) Log likelihood PseudoR2 347 51.5200 *** -75.3390 0.2548
Source: Author's Computation
* Significant at the 10% level (2-tailed) ** Significant at the 5% level (2-tailed)
Significant at the 1% level (2-tailed)
length of time since the first attack. It's possible that farmers use the length of time involved to weigh alternative response strategies, determine whether replanting is a feasible and economically viable option before making a choice to replant.
The farmers' level of formal education is positive and significant at the 5% level of significance, i.e. the higher the education level, the higher the new plantings. Household heads with up to primary level or higher level of education are more likely to replant compared to their counterparts with no formal education. Education seems to provide the highest marginal increment to new plantings occurring after a CWD attack. Household heads with some primary education are 44% more likely to replant while heads with even higher levels of education are up to 52% more likely to replant in response to a CWD attack compared to their unlearned counterparts. The reason for this differentiation in response to CWD across education levels is partly embedded in the nature of the available planting material, which is mainly of the clonal material- a new innovation. Existing literature on the uptake of new innovations at farm level (Nabbumba, 1996; Nkonya et al., 1998) indicates that the more educated household heads take up new technologies faster and at higher levels of intensity than the less educated. This may however; also stem from differential accessibility since the more educated may also have higher incomes for purchasing the planting material and also greater access to the knowledge on the availability and utilization of such materials.
The total number of household members positively and significantly influences the likelihood of replanting. With each additional household member, the likelihood of replanting coffee increases by 1 percent at the 10 percent level of significance. Farming households in Uganda
like in all other less developed economies are highly dependent on family labour for their farm labour requirements. Uprooting and burning infected material is a labour intensive exercise which is exacerbated by the requirement for preparation of new and clean plots given the residual nature of the fungus in the soil long after the diseased plant material is gone. Additional labour is therefore a necessary prerequisite for replanting in CWD affected areas especially for households that are small in size.
The livestock assets of the household (livestck) were used to proxy the wealth of the household (see Nkonya et al., 1998). Increasing a household's livestock assets by I unit increases the likelihood that the household will replant coffee by 5% at the one percent level of significance. Since livestock is a productive asset, livestock holdings may provide households with the additional income such as from dairy sales, required for purchases of planting material. However, to the extent that livestock holdings proxy the wealth status of the household, this finding implies that only the wealthier households take advantage of replanting as a response strategy to CWD attacks. The reason for this is embedded in the fact that planting not only bears an opportunity cost, in terms of time and money, but also a risk. Hence planting becomes too costly for the poor. The poor may hence be less able to mitigate or counteract the welfare diminishing effects of CWD as a result of loss of coffee fields and consequently income gains from coffee production. In consequence, poor people may have to rely on risk coping mechanisms on an individual level, such as dis-saving, sending children to work or selling assets when a shock occurs. This result has an important implication for a pro poor development policy.
CHAPTER V 5.0 CONCLUSIONS AND RECOMMENDATIONS 5.1 Summary and Conclusions
Coffee wilt disease (C)WD); a vascular disease that causes total yield loss in infected coffee
plants was first reported in Uganda in 1993 and is currently a threat in over 70% of Uganda's
coffee growing districts. Being Uganda's premier export commodity, the resultant declines in
production resulting from the coffee wilt pandemic pose a significant challenge to earning capacities both at individual household and national levels. It was however, not clear how
coffee-farming households in the hard hit areas had responded to CWD. This study sought to
provide information on the alternative coping strategies employed by households in the CWD
affected areas. Also given that government responded to the coffee scourge by funding a
significant replanting programme, this study hence further sought to provide complementary
information to the exercise by providing statistics on the extent of replanting at household
level and the factors that significantly influence the extent to which households replant their
coffee fields including the implications to the policy decisions related to the replanting
exercise. In order to attain these objectives the study employed both descriptive statistics and a Tobit model for a more rigorous analysis. This study uses data on 370 respondents obtained
from the national baseline survey on CWD conducted in 2002 in 20 coffee growing districts
that were the hardest hit with CWD by then.
Results indicated that farmers had an initial area under coffee of 2.78 acres on average most
of which was intercropped and of the traditional variety, which is older and more susceptible
to CWD. Results further showed very high rates of CWD infection with farmers in the
sample indicating that on average 58% of their initial coffee area was lost to CWD. Conversely, the descriptive statistics showed that farmers were replanting at a rate of 28% of