ANALYSIS OF PCDD/FS AND DIOXIN-LIKE PCBS IN SEWAGE SLUDGES AND
GENERAL BIO-WASTES AVAILABLE FOR AGRICULTURAL LAND
APPLICATION IN BELGIUM - COMPARISON BETWEEN GC-IDHRMS AND
CALUX RESULTS
Van Langenhove K1*, Dumortier P2, Scholl G3, Denison MS4, Pussemier L2, Focant JF3, Goeyens L1, Baeyens W, Elskens M1
1Vrije Universiteit Brussel (University of Brussels), Department of Analytical and Environmental Chemistry
(ANCH), Pleinlaan 2, 1050 Brussels, Belgium., 2CODA-CERVA, Veterinary and Agrochemical Research Center, Operational Directorate Chemical safety of the Food Chain, Leuvensesteenweg 17, B-3080 Tervuren, Belgium,.3CART, Mass Spectrometry Laboratory, Organic and Biological Analytical Chemistry, Chemistry Department, University of Liège, Allée de la Chimie 3, B-6c Sart-Tilman, B-4000 Liège, Belgium, 4Department of Environmental Toxicology, Meyer Hall, University of California, Davis, CA 95616, USA.
Introduction
Polychlorinated dibenzo-p-dioxins (PCDDs), -furans (PCDFs) and biphenyls (PCBs) form a group of ubiquitous environmental contaminants that persist in time, accumulate in a non-polar matrix as well as biomagnify in the trophic chain1. Due to their hydrophobicity, they tend to accumulate in non-polar matrices such as sediment and sludge.
Since European legislation2 allows the use of sewage sludge3, and bio-wastes in general, for application purposes on agricultural land, it is therefore of particular interest to verify the dioxin contamination in sludge, and biosolids alike. Current legislation is, however, scarce concerning the limit values of PCDD/Fs and dioxin-like (DL)-PCBs in sludge. Major EC regulations2 tend to focus on heavy metal pollution for these types of matrices. Although a 3rd working draft document4 exists (EC 2000), which proposes a limit of 100 ng I-TEQ kg-1 (dry weight). More recent publications5,6,7report values that either comply with this limit for all samples5 or comply on average6,7, the latter have maximum values going up to 250 pg PCDD/F’s TEQ g-1 (dry weight) (TEF scheme not mentioned).
The clean-up and extraction procedure for both bio-analytical and chemo-analytical methods has been described elsewhere8,9. This procedure with small modifications will allow comparison between virtually identical extracts by both the CALUX (Chemically activated luciferase gene expression) bioassay and GC-IDHRMS (Gas Chromatography - Isotope Dilution High Resolution Mass spectrometry) analysis. A soft extraction method8,9,10, to mimic weathering processes and obtain a bioavailable fraction, can then be used to assess the impact on human dietary intake by common fertilization practices11 in the future.
Materials and methods
A total of 97 samples were analyzed, among them sewage sludge (rural, and urban), industrial sludge (agro-industrial, decarbonatation and paper mill sludge), compost (fresh plant, and waste), digestate, manure (bovine, porcine, and poultry), liming materials (sugar factory, and other) and miscellaneous (chemical fertilizers, blood and hair meal,… ). Samples were taken by CODA-CERVA, stored, and smaller homogenized aliquots were transferred to borosilicate containers and freeze-dried at VUB, where extraction, clean-up and CALUX-analysis were performed. The sample duplicates destined for GC-IDHRMS were transferred to CART in Liège.
Extraction
The US EPA method 443510 for toxic equivalent determination with the CALUX bioassay was used as a starting ground for extraction of the above mentioned matrices. Freeze-dried sample (2g) was extracted with a 20/80 methanol/toluene mixture, toluene and passed over a celite filter column. This extraction method can be referred to as a soft extraction, as opposed to more harsh extraction conditions faced with ASE, PLE or Soxhlet extraction. Hence we may assume that such an extraction method can provide information regarding dioxin and
dioxin-related compounds in a sample fraction to be considered bio-available under average weather(ing) conditions. Samples destined for GC-IDHRMS analysis were extracted in the same manner, pooling the solvent extract of multiple 2g portions depending on the matrix type. Each sample destined for GC-IDHRMS had been spiked with 13C-labeled standards containing 7 PCDDs, 10 PCDFs, 12 DL-PCBs (4 non-ortho PCBs and 8 mono-ortho PCBs) for a total of 20µl distributed over the multiple portions needed per sample. Standards were provided by CART, Liège.
Purification and separation
Extracts were evaporated and redissolved in 5mL n-hexane and completed with 2.5mL concentrated sulfuric acid8 to break down any acid-labile compounds. The n-hexane layer was transferred to a three stage column series8 along with three 2mL n-hexane rinses of the sample extract. Extract and rinses first passed through a sulfuric acid silica column followed by an activated copper column (20% HCl solution for activation). Target compounds were thereafter trapped in an X-CARB column8,9 and differentially eluted in a dioxin-like PCB and dioxin/furan fraction. Dioxin and dioxin-like PCB extracts were redissolved in 4mL of n-hexane and stored awaiting CALUX analysis. Purified extracts for GC-IDHRMS were transferred to 1.1mL tapered GC-vials and compounds were concentrated in 10µL of nonane (CART, Liège).
GC-IDHRMS and CALUX analysis
Measurements on 7 PCDDs, 10 PCDFs, and 12 DL-PCBs were carried out in their respective fractions. PCDD/Fs and non-ortho PCBs were monitored for both native and labeled ions in SIM (selected ion monitoring) mode using an Autospec Ultima (Micromass, Manchester, UK) coupled to an Agilent 6890 Series (Palo Alto, CA, USA). Mono-ortho PCBs were monitored in the same way using a MAT95 XL (ThermoFinniganMAT, Bremen, Germany) in line with an Agilent 6890 series (Palo Alto, CA, USA). Additional GC and HRMS parameters, as well as QA/QC procedures are mentioned elsewhere12. Data were treated using Excel and/or the R statistical software with 2005 WHO-TEF values.
CALUX analyses were carried out using the new mouse hepatoma cell line13 (H1L7.5c1). Cells were maintained in α-MEM supplemented with 10% (v/v) FBS and seeded in 96-well plates. After 24-hour incubation and cells reaching a monolayer, extracts were dosed in triplicate along with a TCDD-standard curve. PCDD/F fractions were subjected to a 9-point serial dilution curve, whereas PCBs made up a 4-point dilution curve. Cells were again incubated over a 24-hour period after which lysis and measurement were performed using Luciferase assay substrate and a Glomax 96-well plate reader (both from Promega, The Netherlands). Data analysis was performed in Excel where statistical analysis and BEQ quantification14 involved fitting the 4-parameter Hill equation or the newer slope ratio method14 (Excel Solver add-in enabled). Briefly, this last method uses Box-Cox regression14 to linearize part of the response curve; the equation’s slope can then be used, much like the EC50, to generate a BEQ by taking the ratio of the TCDD slope over that of the sample.
Results and discussion
BEQ determination14,15 and sample compliance16 has been a matter of debate, but our goal here is to strive in using the CALUX bioassay as a semi-quantitative method based on sample dilution curves and EC50 derivation thereof. As such we are able to provide precise BEQ50’s and, when samples allow it, also provide a range of BEQs (BEQ20-BEQ80) reflecting the sample’s deviation in terms of slope from the prototypical TCDD standard curve.
CALUX Data treatment
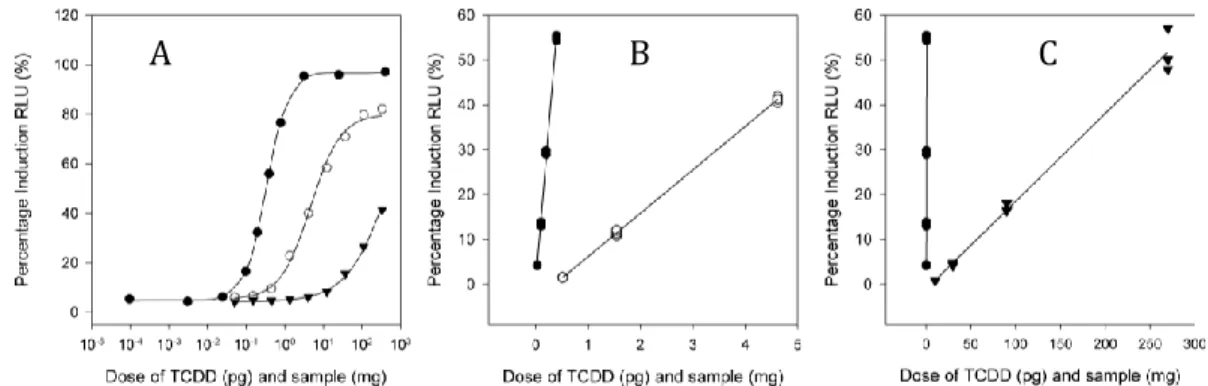
Figure 1A shows a typical TCDD standard curve (Hill fit p-value of 1.000) and 2 samples (both dioxin fraction): one displaying a full dose relationship (Hill fit p-value of 0.581) and one corrected for the maximum attainable plateau (Hill fit p-value of 0.972 with Solver restraint on the m-parameter). Figure 1B and 1C represent the same data as figure 1A, but this time using the slope ratio method; TCDD-standard curve (Box-Cox regression p-value 0.923), sample 1 (BC regression p-value 0.999) and sample 2 (BC regression p-value of 0.997). BEQ results are 60 pg TCDD/g (sample 1) and 0.84 pg TCDD/g (sample 2).
Figure 1: Typical TCDD-standard curve (●), sample with full dose response (○) and sample not attaining an upper plateau (▼) using Hill regression (A). Same data portrayed using the slope ratio method for TCDD (●) and full dose sample (○) (B). Slope ratio for TCDD (●) and sample w/o upper plateau (▼) (C). Comparing both techniques for the sample data set of dioxin fractions (n:97) and PCB fractions (n:83) provides us with Figure 2. Correlation is high for the dioxin fraction with an R² value of 0.9033, whereas the correlation is lower for the PCB fraction (R² of 0.6946). This becomes evident when looking at the x-axis scale where the range of contamination is ~ 0-250 pg TCDD/g for the dioxin fraction and only ~ 0-6 for the PCB fraction. It is indeed so that fitting a Hill equation or Box-Cox regression is more difficult with lower contamination and less points above threshold. The BC regression can provide a better alternative here but falls victim of the choice in dilution points (typical Hill fit dilution points are based/chosen on a serial dilution with fixed dilution factor whereas BC regression would benefit more from points close to each other in dilution when contamination is low).
Figure 2: Correlation between EC50 ratio and slope ratio method for the dioxin fraction (left) and PCB fraction (right) for CALUX analysis.
While the high correlation coefficient for the dioxin fraction (R² of 0.9033) indicates a high degree of association between the estimates determined using either the Slope or EC50 ratio methods, PCB values are overestimated by the traditional Hill regression owing to the enforced restrictions of the m-parameter (upper plateau) as opposed to the slope fitted with the BC regression.
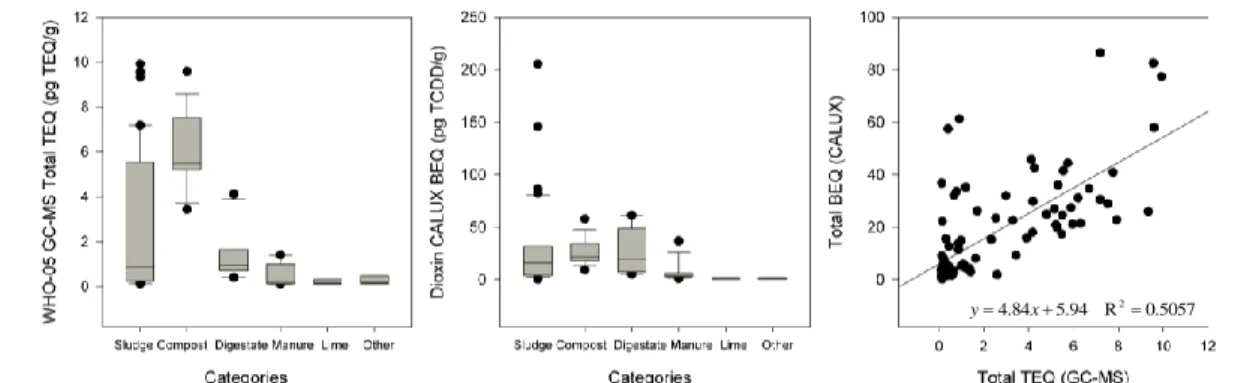
Figure 3 shows boxplot diagrams for all 6 categories using the two analysis methods. Total dioxin content is displayed (sum of PCDD/Fs and DL-PCBs) for GC-IDHRMS analysis (~0-12 pg TEQ/g) and CALUX (~0-220 pg TCDD-BEQ/g; Hill data). Outliers are primarily observed in the sludge category, most noticeably visible with CALUX results. Only 2 samples are above threshold limit (based on the EU working document; 3rd draft 2000) when analyzed by CALUX. GC-IDHRMS results are all compliant with this norm. Highest values are observed with the sludge, compost (both CALUX and GC-MS) and digestate (only CALUX) samples. The lime and other (chemical fertilizers) category gave very low, close to zero values, showing no potential for possible dioxin
9033 . 0 R 31 . 1 05 . 1 2 x y y0.64x0.44 R20.6946
A
B
C
health effects up the tropic chain. A factor of 5 (Figure 3; right graph) is observed between BEQ and TEQ with some notable deviations for some CALUX results (2 outliers removed).
Figure 3: Boxplot diagrams displaying total dioxin TEQ and BEQ for the main six categories (GC-MS on the left and CALUX in the middle). Correlation (graph on the right) between total TEQ and BEQ. In general, correlations between GC-MS and CALUX are in good agreement and show that the bio-available dioxin content is low in the examined matrix types.
Acknowledgements
This work was funded by the Federal Public Service of Health, Food Chain Safety and Environment (contract RT 10/01 FERTIDIOX). The authors are grateful to Prof. M. Denison and the other members of the University of California-Davis (USA) for generously providing our laboratory with the H1L6.1c3 and the H1L7.5c1 cell lines which were developed with funding from a National Institute of Environmental Health Sciences Superfund Research grant (ES04699).
References:
1. Van Larebeke N, Covaci A, Schepens P, Hens L. (2002) J Epidemiol Commun H 56: 828-830. 2. EC Directive 86/278/EEC
3. Eljarrat E., Caixach J., Rivera J. (2003) Chemosphere 51: 595-601. 4. EU (European Union). Working document on sludge, 3rd draft; 2000.
5. Martinez K., Abad E., Palacios O., Caixach J., Rivera J. (2007) Environment International 33: 1040-1047. 6. Bright D.A., Healey N. (2003) Environmental Pollution 126: 39-49.
7. Moon H-B., Yoon S-P., Jung R-H., Choi M. (2008) Chemosphere 73: 880-889.
8. Van Langenhove K., Keupers I., Croes K., Vandermarken T., Denison M. S., Baston D. S., Elskens M., Baeyens W.(2011) Organohalogen Compounds 73: 2132-2135
9. Baston D.S. and Denison M.S. (2011) Talanta 83: 1415-1421
10. US EPA Method 4435, Method for toxic equivalents (TEQs) determinations for dioxin-like chemical activity with the CALUX bioassay. Unites States Environmental Protection Agency (2008) Revision 0. 11. Dumortier P., Elskens M., FocantJ.F., Goeyens L., Vandermeiren K. and Pussemier L. (2011) Science of the
Total Environment 423: 47-54
12. Focant J.F., Eppe G., Massart A.C., Scholl G., Pirard C. And De Pauw E. (2006) J Chromatogr A 1130: 97-107
13. He G., Tsutsumi T., Zhao B., Baston D.S., Zhao J., Heath-Pagliuso S. And Denison M.S. (2011) Toxicol.
Sci. 123: 511-522.
14. Elskens M., Baston D.S., Stumpf C., Haedrich J., Keupers I., Croes K., Denison M.S., Baeyens W. And Goeyens L. (2011) Talanta 85: 1966-1973
15. Goeyens L., Hoogenboom R., Eppe G., Malagocki P., Vanderperren H., Scippo M.-L., Windal I., Baeyens W., Denison M.S. and Hädrich J. (2010) Organohalogen Compounds 72: 964-967
16. Hädrich J., Eppe G., Goeyens L., Hoogenboom LAP., Malagocki P., Scippo M.-L., Vanderperren H., Windal I., Denison M.S., Stumpf C., Kotz A. and Malisch R. (2010) Organohalogen Compounds 72: 1806-1809 5057 . 0 R 94 . 5 84 . 4 2 x y