Use of a weighted random regression test-day model to better relate observed somatic cell score to mastitis infection likelihood
5
0
0
Texte intégral
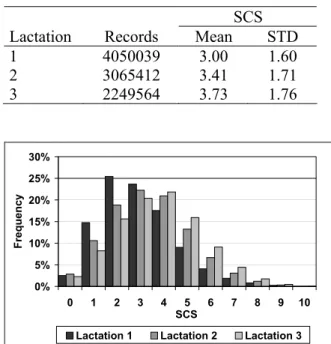
(2) in the sense that both methods try to separate using infectional status, both try to achieve the same goal by computing a expected probability that a given SCS is linked to an intramammarian infection event.. Data. SCC data was provided by the Walloon Breeding Association (AWE) who manages performance recording data in the Walloon Region of Belgium. Data edition was done to keep records in the first three lactation occurring between 5 and 365 DIM and to exclude unlikely ages for a given lactation or gestation lengths. Additionally, recorded SCC had to be at least 10000 cells per ml and be below 10 million cells. SCS were computed using the formula by Ali and Shook (1980) SCS = [log 2 (SCC / 100000)] + 3 SCS below 0.1 were put to 0.1. As shown in Figure 1 this commonly used transformation allows to get a traits that has a nearly normal distribution (data from August 2003), especially in the second and third lactation. Table 1 gives additional details of the data used in the routine run of August 2003.. Weighted RRTDM A typical RRTDM for SCS can be written as y = Xb + Qa + Qp + e where y is the vector of daily SCS, b is a vector of fixed effects, p a vector of permanent environmental random regression, a a vector of additive genetic random regressions. One can define at every iteration a weight that is a direct function of the observed standardized e residuals e s = 2 . The choice of this function σe is at the present stage quiet arbitrary. It should only reflect that a standardized residuals approaching -∞ equals the lowest possible weight and approaching +∞ equals the highest possible weight. A logical choice was therefore a sigmoid function and the following function chosen: 1 + αβ γ= 1 + α exp(−e s ). Table 1. Number of test-day records used in August 2003 and observed means and standard-deviations (STD) for SCS.. SCS Lactation 1 2 3. where α was put to 1 assuming a symmetric distribution and β to 1.6506 in order to allow the mean weight γ being 1.. Records 4050039 3065412 2249564. Mean 3.00 3.41 3.73. STD 1.60 1.71 1.76. 30%. Frequency. 25%. 2.650. 20% 15% 10%. Weight. 5% 0% 1.325. 0. 1. 2. Lactation 1 0.000 -8. -6. -4. -2. 0. 2. 4. 6. 3. 4. 5 6 SCS. Lactation 2. 7. 8. 9. 10. Lactation 3. Figure 2. Distribution of first, second and third lactation TD SCS/.. 8. Standardized residual SCS. Figure 1. Evolution of the weight γ in function of standardized residual SCS.. 93.
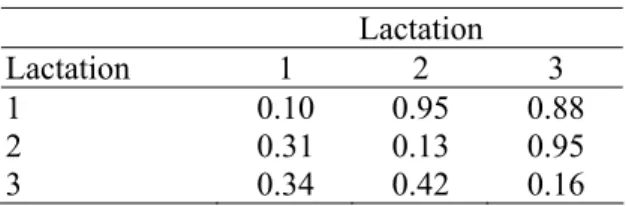
(3) computed using the weights are called EBVw, EBV obtained without weighting EBVo.. Genetic evaluation model. The genetic evaluation model was a multilactation RRTDM similar to the one used for milk, fat and protein that was described by Auvray and Gengler (2002). There were only two major modifications, no common herd environment effects were defined as previous research showed that this effect is very small for SCS and the model was only multilactation, not multitrait.. Comparison of results with and without iterative weights. In order to allow comparison of results using the August 2003 run data a weighted and a not weighted run were computed and EBV obtained. Additionally genetic evaluations from INTERBULL routine runs for Holstein and Red Holstein populations in Denmark, Sweden and Finland were obtained to test if changes in our results were likely linked to mastitis.. (Co)variance components. (Co)variance components used were derived in a similar manner as described by Auvray and Gengler (2002). Table 2 shows that genetic values for SCS were similar for the three lactation even if phenotypic values were rather poorly correlated.. INTERBULL test-run March 2003. Results obtained in March 2003 using the weighted RRTDM described here were submitted to the INTERBULL test-run. Under the rationale that the proposed method does a better job than ordinary RRM or lactation models the correlation obtained by INTERBULL should be at the higher edge of the range of correlation among populations using SCS or SCC and the direct mastitis evaluations of the Nordic Holstein or Red Holstein populations : Denmark, Sweden, and Finland.. Table 2. Heritabilities for SCS on the diagonal, genetic correlations above, phenotypic correlations below.. Lactation 1 2 3. 1 0.10 0.31 0.34. Lactation 2 0.95 0.13 0.42. 3 0.88 0.95 0.16. Computation and expression of breeding values. Results and Discussion Comparison of results with and without iterative weights. Solving of the weighted RRTDM was obviously more difficult than for a regular RRTDM. Experience showed that keeping first weights equal to 1 until a high level of convergence allow a smooth solving. Estimated breeding values (EBV) were computed from random regressions expressed as a mean value over 305 lactation days and the three lactation. Values were also expressed as deviations from a common genetic base that was put to 3 for the mean of all cows born in 1995 with records. The value of 3 was chosen as it represents the first lactation mean. This presentation was preferred to relative values as breeders in the Walloon Region are used to SCS as these values are also used as management tools. In the following study EBV. As expected correlation among EBVw and EBVo was very high with values of 0.986 for the 706 bulls send to INTERBULL. Table 3 gives details about the distribution of the SCS breeding values for these bulls and the difference observed. Table 3. Details of the EBV for the 706 bulls send to INTERBULL for the August 2003 routine run (EBVw = with weights, EBVo = without weights. Mean Std Min Max EBVo 3.01 0.36 1.98 4.34 EBVw 3.03 0.40 2.04 4.51 EBVo – EBVw -0.03 0.07 -0.33 0.16. 94.
(4) The most interesting detail was that despite the high correlation there were substantial differences in the observed values.. Table 5. Comparison of average correlation obtained for mastitis evaluations in Nordic populations with SCC or SCS results in other populations. All other populations WAL Mean Std Min Max 0.65 0.59 0.03 0.51 0.64. Table 4. Correlation of the difference EBVoEBVw with mastitis results from Nordic populations for different minimum levels of EDC in our data. Minimum Population EDC N DNK DNR SWE FIN All 636 0.48 0.46 0.33 0.26 50 550 0.49 0.48 0.33 0.25 150 330 0.54 0.52 0.38 0.24. Conclusions Current genetic evaluation systems for SCC or SCS do not account for the potential different origins of observed values. This paper presents a very simple way to do this, at least approximately. The method presented here is simple and can be used easily in current RRTDM settings. It was used successfully in the Walloon genetic evaluation system providing breeding values that were better predictors of mastitis.. DNR = Danish Red Holstein. Table 4 shows the correlation of the difference between EBVo and EBVw and genetic evaluations for mastitis from INTERBULL routine runs for Holstein and Red Holstein populations in Denmark, Sweden and Finland. These results are expressed on a scale where higher values indicate less mastitis incidence. Therefore a positive correlation with EBVo-EBVw means that this difference is positively related to mastitis resistance. The higher correlation with the Danish populations could be due to the fact that their models are multitrait somatic cells and mastitis. Also our method tries to detect clinical and sub-clinical mastitis, where usual direct mastitis recordings are (mostly?) clinical.. Implications. The method presented in this paper has the potential for further developments. First, the method used to compute iterative weights is definitely still rather crude, but given the results has some potential for further improvement. Also; if direct milk recording systems keep track of mastitis events at a given test-day this information can be directly feed into the system considering the maximum weight for this test. Finally the current way to express results may not be optimal and alternative expression of overall EBV could provide better indicator functions for mastitis.. INTERBULL test-run March 2003 Correlations obtained by INTERBULL in the March 2003 test-run are summarized in Table 5. The results showed that our average correlation was the highest with the Nordic mastitis results compared to all other populations using SCS or SCC. Even if one should not overemphasis the value of a correlation, as observed value can be due to a great number of factors, this seems to indicate that the method worked reasonably well.. 95.
(5) Auvray, B. & Gengler, N. 2002. Feasibility of a Walloon test-day model and study of its potential as tool for selection and management. INTERBULL Bulletin 29, 123-127. Detilleux, J. & Leroy, P.L. 2000. Application of a mixed normal mixture model for the estimation of Mastitis-related parameters. J. Dairy Sci. 83, 2341-2349. Elvinger, F., Littell, R.C., Natzke, R.P. & Hansen, P.J. 1991. Analysis of somatic cell count data by a peak evaluation algorithm to determine inflammation events. J. Dairy Sci. 74, 3396-3406. Rupp, R. & Boichard, D. 2000. Relationship of early first lactation somatic cell count with risk of subsequent first clinical mastitis. Livest. Prod. Sci. 62, 169-180.. Acknowledgments The authors gratefully acknowledged the support of the Walloon Breeding Association (AWE) and the Walloon Regional Ministry of Agriculture (Projects : RW1009, D31-1039). Nicolas Gengler, who is Chercheur Qualifié of the National Fund for Scientific Research (Brussels, Belgium), acknowledges support through Grant 2.4507.02 F (2) of the National Fund for Scientific Research.. References Ali, A.K.A. & Shook, G.E. 1980. An optimum transformation for somatic cell concentration in milk. J. Dairy Sci. 63, 487490.. 96.
(6)
Figure
Documents relatifs
If the commodity is only used for monetary purposes, all that would happen is that the increased supply of money would lead to a fall in PPM and an increase in the quantity of
Chronic osteomyelitis treatment is complex, due to the difficulty to achieve therapeutic drug levels at the site of infection by systemic administration.. Our objective was to
Though it does not concern generalisation performance, a surprising result is that the number of trees in the ”best” subset found during the selection process is often very
L’archive ouverte pluridisciplinaire HAL, est destinée au dépôt et à la diffusion de documents scientifiques de niveau recherche, publiés ou non, émanant des
List of suites built for hierarchical model selection analyzing habitat selection process of Prothonotary Warblers nesting in natural cavities or nest boxes in White River
In order to generalise the notion of being Cauchy to supersequences, observe that a sequence (x n ) n∈ω in a metric space satisfies the Cauchy condition iff the mapping ω → X, n 7→
However, the disadvantage of post-assignment is that all the students who have submitted the source code prior to the deadline have to wait for the ones behind; if a
In these setting, this article has two main objectives: first, to suggest various way of introducing the value of a citation in the assessment of articles influence
