S. Erpicum1, P. Archambeau1, B.J. Dewals1,2, J. Ernst1and M. Pirotton1 1
Research unit of Hydrology, Applied Hydrodynamics and Hydraulic Constructions – HACH, Department of Architecture, Geology, Environment and Construction – ArGEnCo, MS²F, Liege University, Ch. des Chevreuils, 1 B52/3, B-4000 Liège, Belgium; PH +32 4 366 95 96; FAX +32 4 366 95 58; email: [email protected] 2
Fund for Scientific Research F.R.S.-FNRS, Belgium ABSTRACT
Dam-break wave propagation may have high consequences on the downstream valley topography. In particular, strong damages to buildings can occur. Or the topographical characteristics of the valley, and especially the buildings, directly influence the wave dynamic. In this paper, a 2D numerical flow solver available for dam-break flow computation on real topography is used to perform numerical modeling considering the structural impacts of the wave propagation on buildings.
INTRODUCTION
Despite they are recognized for their valuable contribution to the prosperity and wealth of societies across the world, dams and reservoirs are also blamed for their risk of failure. Failures of large dams remain fortunately very seldom events. Nevertheless, a number of occurrences have been recorded in the world, corresponding in average to one to two failures worldwide every year (Marche, 2004). Some of those accidents caused catastrophic consequences, including strong damages to buildings and even losses of life.
Today, numerical flow models are reliable tools to perform detailed predictions of the flood wave propagation following potential dam failure scenarios. This is an important part of a complete risk analysis process, which can help to define emergency action planning to reduce the possible damages to people and goods in the downstream valley.
Since practical risk analysis must be applicable for long real valleys at a sufficiently high space resolution, depth-averaged hydrodynamic models still constitute the most appealing approach. These numerical models accurately represent the highly transient behaviour of the flow, with the propagation of stiff fronts and hydraulic jumps (Erpicum and al., accepted for publication), handle very detailed natural topography even on large urban areas (Dewals and al., 2006) and deal with complex failure scenarios for cascade of dams or embankment structures (Dewals and al., 2008a).
A next step in the development of the numerical modeling procedures is to consider the influence of the flow on the downstream valley topography. Indeed, it can be easily demonstrated that modifications in the valley shape during the flood propagation may not be negligible regarding the main flow characteristics (Marche, 2004). Such modifications are mainly the results of erosion/deposition processes which can be of very high importance in case of dam-break waves. Moreover, friction effects highly contribute to define the dynamics of the flood. And as it is only related to the soil characteristics, the roughness is strongly influenced by eventual topography modifications.
One of the most important head losses factors in case of dam break wave propagation in a real valley is the buildings in urban areas. With poor quality surface elevation models, where the geometric features of houses are not present or inaccurate, the roughness effects are commonly evaluated using exacerbated friction coefficients (Finnish Environment Institute, 2001). When the topography data are sufficiently complete and accurate, the macro roughness in urban area may be automatically taken into account in the flow computation through the local variations of the bottom elevation (Dewals and al., 2006). In the latter approach, the transient modifications of the macro roughness topography can be handled directly for all that the structural impacts of the wave on the buildings are considered.
In this paper, the numerical modeling of flood wave propagation is performed considering buildings failure as a result of hydrodynamic loads. Criteria for failure of the buildings have been defined and coupled with a 2D flow model in order to adequately modify, during the computation, the topography characteristics. The approach is applied to two idealized test cases to show the influence of buildings failure on the flood propagation. The model is also applied to the historic Malpasset dam-break and the numerical results are qualitatively compared with available data of the real event.
MATHEMATICAL MODEL
Flow model. The 2D hydraulic model is based on the two-dimensional
depth-averaged equations of volume and momentum conservation, namely the shallow-water equations (SWE). This model is suitable for many of the problems encountered in river management as well as for dam-break flow modeling (Dewals and al., 2008b, Erpicum and al., accepted for publication).
The conservative form of the depth-averaged equations of volume and momentum conservation writes as follows, using vector notations:
0 f d d t x y x y ∂ ∂ ∂ ∂ ∂ + + + + = − ∂ ∂ ∂ ∂ ∂ f g s f g S S where [ ]T h hu hv =
s is the vector of the conservative unknowns. f and g represent the advective and pressure fluxes in directions x and y, while fd and gd are the diffusive fluxes: 2 1 2 2 hu hu gh huv = + f , 2 1 2 2 hv huv hv gh = + g , d 0 x xy h σ ρ τ =− f , d 0 xy y h τ ρ σ =− g .
[
]
T 0=−gh 0 ∂zb ∂x ∂zb ∂yS , Sf =0 τbx∆Σ ρ τby∆Σ ρT
In these equations, t represents the time, x and y the space coordinates, h the water depth, u and v the depth-averaged velocity components, zbthe bottom elevation,
gthe gravity acceleration,
ρ
the density of water,τ
bxandτ
bythe bottom shear stresses,σ
x andσ
y the turbulent normal stresses andτ
xy the turbulent shear stresses.Consistently with Hervouet (Hervouet, 2003),
(
)
2(
)
2b b
1 z x z y
∆Σ = + ∂ ∂ + ∂ ∂
reproduces the increased friction area on an irregular topography (Dewals, 2006). The bottom friction is conventionally modeled thanks to an empirical law, such as the Manning formula. The model enables the definition of a spatially distributed roughness coefficient to account for different landuses, floodplain vegetations or sub-grid bed forms… Besides, the friction along side walls is reproduced through a process-oriented formulation developed by the authors (Dewals, 2006): 2 2 2 2 b b w 4/ 3 1/3 1 4 3 x x N x k n n gh u u v u h h y τ ρ = = + + ∆
∑
and 2 3 / 2 b 2 2 b w 4 / 3 1/ 3 1 4 3 y y N y k n n gh v u v v h h x τ ρ = = + + ∆ ∑
where the Manning coefficient nband nwcharacterize respectively the bottom and the
side-walls roughness. Those relations are particularized for Cartesian grids.
The solver includes a mesh generator and deals with multiblock grids (Erpicum, 2006). Within each block, the grid is Cartesian. An automatic grid adaptation technique restricts the simulation domain to the wet cells to decrease the number of computation elements. Besides, wetting and drying of cells is handled free of volume and momentum conservation errors by the way of an iterative resolution of the continuity equation prior to any evaluation of the momentum equations (Erpicum, 2006).
The space discretization is performed by means of a finite volume scheme. The fluxes are adequately computed by a Flux Vector Splitting method developed by the authors (Erpicum and al., accepted for publication).
Since the model is applied to transient flows and flood waves, the time integration is performed by means of a second order accurate and hardly dissipative explicit Runge-Kutta method. For stability reasons, the time step is constrained by the Courant-Friedrichs-Levy condition based on gravity waves. A semi-implicit treatment of the bottom friction term is used, without requiring additional computational costs.
The model has already proved its efficiency through varied applications (Dewals and al., 2006, Dewals and al, 2008a and 2008b, Erpicum and al., 2008, Erpicum and al., accepted for publication)
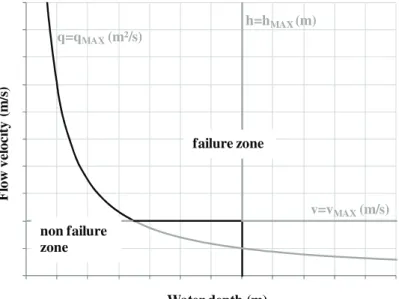
Impacts on buildings. The permanence of buildings in flowing water has been studied in the scope of the Rescdam European project (Finnish Environment Institute, 2001). Based on a review of the literature and on experimental tests, critical values of the flow velocity v (m/s) and of the specific discharge q=vh (m²/s) have been proposed depending on the house type.
On another hand, calculations can be performed to assess the resistance of a typical wall regarding the hydrostatic forces. Such an approach provides a critical value of the water depth h (m).
Such criteria lead to a graph as depicted on figure 1 to assess the impact on buildings of hydraulic conditions. The failure occurs for water depths higher than hMAX or for flow velocity and specific discharge simultaneously higher than vMAXand qMAX respectively. 0 1 2 3 4 5 6 7 8 9 10 0 1 2 3 4 5 6 7 8 9 10 11 12 F lo w v el o ci ty (m /s ) Water depth (m) h=hMAX(m) v=vMAX(m/s) failure zone non failure zone q=qMAX(m²/s)
Figure 1. Criteria for buildings failure
In the flow model, the values of h and v are computed on each mesh at each time step. It is thus easy, for areas of building defined on the computation grid, to verify regularly if critical values are exceeded on the buildings sides. When it is the case, the building on the concerned mesh is supposed to collapse instantaneously and the bottom elevation value of the mesh is adapted.
Using the multiblock features of the flow model, it is possible to use very fine grids in urban areas. Thus, the buildings are usually modeled with several meshes. As the failure criteria are evaluated for each computation mesh individually, the buildings may collapse partially depending on specific flow conditions.
In the approach depicted in this paper, the volume of solid materials resulting from a building collapse is neglected as it is instantaneously removed from the computation.
In practice, the values of hMAX, vMAXand qMAXdepend on several factors such as house type, surface of walls affected by the flood, local condition… They are thus very difficult to define and should be varied for each building. Nevertheless, mean values can be used depending on general house type (wood frame, masonry, brick, concrete…) (Finnish Environment Institute, 2001).
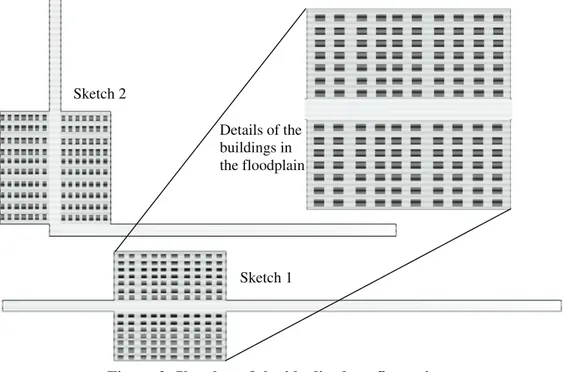
Idealized configurations. Two idealized test cases have been defined to assess the
effect of existing buildings on dam-break flood propagation. A flat bottom 1 km long channel with a rectangular cross section 22 m wide has been modeled using 1 m side square meshes. A 200 m long and 90 m wide floodplain has been placed along the channel, overhanging the channel by 2 m. 70 individual houses 10 m long, 7 m wide and 5 m high have been regularly distributed in both floodplain sides. The channel is straight in test cases series (1) and have a 90° bend downstream of the floodplain in test cases series (2) (Figure 2).
The buildings have been modeled using three different approaches: in a first case (a), they have been represented using a strong increase in the floodplain roughness features (Manning coefficient n=0.1s/m1/3) but without topography variation (flat floodplain). In a second case (b), the buildings have been modeled with topography variations but without possible failure (infinitely resisting structures). In the last case (c), the buildings have been modeled such as in (b) but with failure criteria hMAX=7m, vMAX=2m/s and qMAX=7m²/s. These criteria come from existing literature (Finnish Environment Institute, 2001) as well as developments carried out at the Liege University. The friction coefficient in the floodplain with the buildings is 0.0167s/m1/3. It is 0.025s/m1/3in the channel.
Figure 2. Sketches of the idealized configurations.
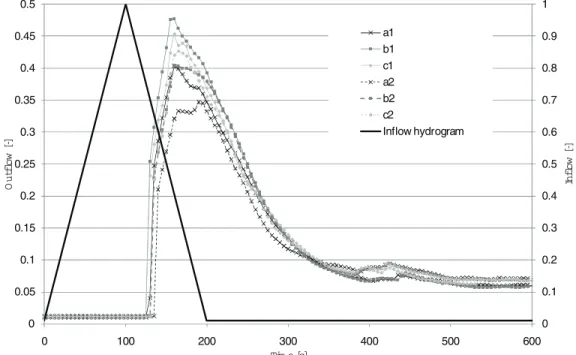
The curves of figure 3 show the variation of the outflow hydrographs downstream of the river (supercritical flow condition) depending on the modeling features. The peak discharge intensity is strongly influenced by the way buildings are modeled. It is not the case for the propagation time. When the roughness is increased without representing exactly the buildings topography, the peak discharge is strongly
Sketch 1 Sketch 2
Details of the buildings in the floodplain
underestimated, in a certain extent because of the increase in the storage capacity of the floodplain without the buildings (28% in potentially flooded area). When the buildings are represented with their true topography, their effect on the peak discharge depends on the river geometry: for fixed structures, the peak discharge is maximum in case of configuration (1) (straight channel), while it is higher with possible failure of buildings in configuration (2) (90° bend channel).
0 0.1 0.2 0.3 0.4 0.5 0.6 0.7 0.8 0.9 1 0 0.05 0.1 0.15 0.2 0.25 0.3 0.35 0.4 0.45 0.5 0 100 200 300 400 500 600 In fl o w [-] O u tf lo w [-] Tim e [s] a1 b1 c1 a2 b2 c2 Inflow hydrogram
Figure 3. Inflow and outflow hydrographs with buildings modeled by increased roughness (a), fixed topography (b) and topography with possible failure (c) –
Straight channel (1) and 90° one (2)
Real case – Malpasset break. As it is well documented, the dramatic real dam-break case of the Malpasset 66-m high arch-dam in France (2nd December 1959) is widely used as a benchmark to validate numerical flow model regarding highly transient flood wave propagation (Morris, 2000). Such a successful comparison has already been performed with the flow solver presented here above (Erpicum and al., 2004).
Following an in-depth analysis of historical data, new simulations have been performed to try to assess the effect of the flood wave propagation on the buildings in the Frejus plain.
Using a uniform grid with meshes of 5 to 5 m, the flood wave propagation following the instantaneous collapse of the dam has been computed along the 12-km long reach of the river Reyran to the Mediterranean sea.
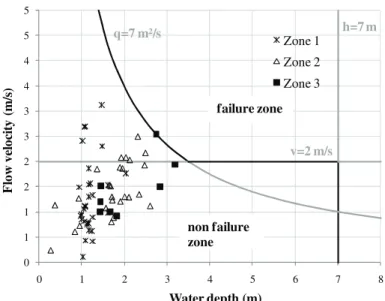
Three groups of houses could be identified in the Frejus plain (Figure 4). They are considered to be detached houses, farms and industrial halls.
Figure 4. Location of buildings in the Frejus plain and inundation extent
The graph of figure 5 summarizes the worst hydraulic conditions computed around the buildings. With failure criteria such as hMAX=7m, vMAX=2m/s and qMAX=7m²/s, none of the buildings fail despite historic survey points out that 24 houses out of 674, 12 industrial halls out of 24 and 103 farms out of 253 have been totally destroyed by the real event. These observations suggest the critical specific discharge and flow velocity should have been lower.
0 1 1 2 2 3 3 4 4 5 5 0 1 2 3 4 5 6 7 8 F lo w v el o ci ty (m /s ) Water depth (m) Zone 1 Zone 2 Zone 3 h=7 m v=2 m/s failure zone q=7 m²/s non failure zone
Figure 5. Criteria for buildings failure and numerical results for the Malpasset dam-break application
CONCLUSION
In this paper, a 2D numerical flow solver is used to perform numerical modeling considering the structural impacts of the dam-break wave on buildings.
Despite precise failure criteria remain difficult to evaluate, it is shown that buildings failure may have a high influence on the wave propagation.
REFERENCES
Dewals, B.J. (2006). Une approche unifiée pour la modélisation d’écoulements à
surface libre, de leur effet érosif sur une structure et de leur interaction avec divers constituants. PhD Thesis, Liege University (in French).
Dewals, B.J., Erpicum, S., Archambeau, P., Detrembleur, S., and Pirotton, M. (2006). “Theoretical and numerical analysis of the hydrodynamic waves induced by dam breaks and their interaction with structures located downstream.” In
Proc. of 7thNat. Cong. On Theoretical and Applied Mechanics, May 29th-30th 2006, Mons, Belgium.
Dewals, B.J., Archambeau, P., Erpicum, S., and Pirotton, M. (2008a). “A systematic procedure to predict flows induced by major dysfunctions on complexes or cascades of dams.” In Advances in water resources and hydraulic
engineering, Zhang, C. and Tang, H. (Eds), Tsinghua University Press, Vol. V, 1868-1873
Dewals, B.J., Kantoush, SA., Erpicum, S., Pirotton, M. and Schleiss, AJ. (2008b). “Experimental and numerical analysis of flow instabilities in rectangular shallow basins.” Environ. Fluid Mech. 8,31-54.
Erpicum, S., Archambeau, P., Dewals, B.J., Detrembleur, S., Fraikin, C. and Pirotton, M. (2004). “Computation of the Malpasset dam break with a 2D conservative flow solver on a multiblock structured grid”. In Proc. of 6th Int. Conf. on Hydroinformatics, Liong, Phoon and Babovic (Eds), World Scientific Publishing Company, Singapore.
Erpicum, S. (2006). Optimisation objective de paramètres en écoulements turbulents
à surface libre sur maillage multibloc. PhD Thesis, Liege University (in French).
Erpicum, S., Dewals, B.J., Archambeau, P., Detrembleur, S. and Pirotton, M. (2008). “Detailed 2D numerical modeling for flood extension forecasting” in River
flow 2008, Altinakar and al. (Eds), Kubaba Cong. Dpt and Travel Services, Turkey, 2159-2168.
Erpicum, S., Dewals, B.J., Archambeau, P. and Pirotton, M. (accepted for publication). “Dam-break flow computation based on an efficient flux-vector splitting.” J. Comput. Appl. Math.
Finnish Environment Institute (2001). Rescdam – Development of rescue actions
based on dam-break flood analysis – Final report.
http://www.ymparisto.fi/print.asp?contentid=78947&lan=en&clan=en#a5. Hervouet, J-M. (2003). Hydrodynamique des écoulements à surface libre –
Modélisation numérique avec la méthode des éléments finis. Presses de l’école nationale des ponts et chausses, Paris (in French).
Marche, C. (2004). Barrages – Crues de rupture et protection civile, Presses internationales Polytechnique, Montreal, Canada (in French).
Morris, M. (2000). CADAM Final report. European Commission. http://www.hrwallingford.co.uk/projects/CADAM/CADAM/index.html