Residential Energy Communities: How to minimize
the investment risk from an investor perspective
Complementary notes
David Vangulick
University of Li`egeLi`ege, Belgium {DVangulick@doct.uliege.be
Abstract—This note is the complement of the article ”Residen-tial Energy Communities: How to minimize the investment risk from an investor perspective”. The objective of this note is to explain the methodology and rationals used in the mentioned article to determine the prior-knowledge of the investor.
Index Terms—Bayesian Game, Distribution System Operator, Grid tariffs, Residential Energy Community
I. INTRODUCTION
We will describe how the investor could infer the following information:
• the repartition of consumer’s types in the neighborhood, although it is not known with specific customer belongs to each type θx
• for the type θi, the distribution of the values of βx,θi
• for the type θg, the distribution of the values of factor ξx
that intervenes in the determination of βx,θg.
Our example will be based on the Belgian situation, though we will explain our approach in order that investors active in other countries may find their way.
To do so, we have to estimate the proportion of each consumer’s type and their respective /beta as well. We will start with θi(consumer type not concerned by their electricity
bill (inelastic)) and secondly the proportion of the θgconsumer
types (green oriented) and finally θc.
II. ANALYSES OF THE FUNCTIONING OF THERETAIL MARKET REGARDING ENERGY PRICE
At the end of the 20th century, European Union and other part of the world (e.g. New Zealand, Australia, etc.) switched from a centrally-run-system of providers of generation, trans-mission, distribution, and retailing to competitive markets. This market can be seen as a functional split between the dif-ferent here-above mentioned roles with new roles been added: Regulation, administration, and market clearing. Transmission and Distribution System Operator (TSO and DSO) considered as natural monopolies are controlled by regulation agencies that are independent from market and from government.
On the wholesale market, generators can make offers to supply electricity at grid injection points, while retailers and some major industrial users make bids to withdraw (”off-take”) electricity at grid exit points. The market uses a locational
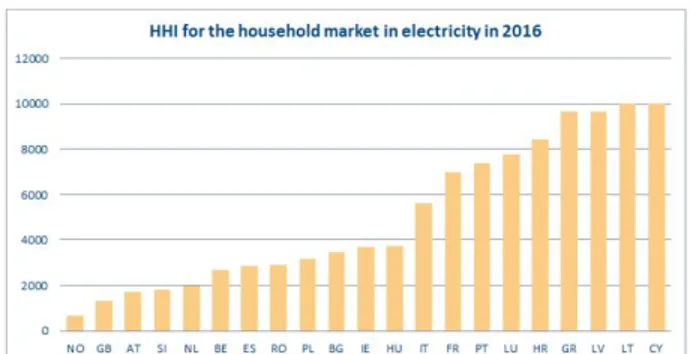
Fig. 1. HHI for the household market in electricity for selected countries.
marginal pricing auction which takes generators’ offers and retailers’ bids and computes final prices and quantities at each node.
Retailers (also named energy suppliers) purchase electricity from this wholesale market, and on-sell it to final consumers. Final consumers are free to change their retailer (action called Supplier switch) and have the option of choosing a (dynamic) electricity supply price contract.
One can argue that the proportions between the different types of consumers are directly influenced by the maturity of the competition in the energy market. At the extreme, in a monopolistic framework, the sole provider does not have an interest in offering highly differentiated offers and therefore consumers are pushed to be broadly of the type θi.
The Herfindahl-Hirschman Index (HHI) ([10]) is used by regulatory agencies as an indicator of the amount of compe-tition among electricity suppliers. An HHI index equal to 10 000 is corresponding to a monopoly market and the lower the index, the fiercer the competition.
Figure 1 shows the HHI index for some regions in Europe after more than ten years of liberalized retail market [9].
Another useful indicator measures the rate of supplier switches. In Belgium, following [14] where the HHI index is low, the rate of supplier switches is also high with 20.1% in Flanders / 16.5% in Wallonia per year (12.2% at federal level to be compared to 6.2% at European union level / Germany 9.6% / France 5.4%). One can think that these Belgian markets are very highly competitive.
Though, the Belgian federal regulatory agency (CREG) published in its market comparison an index called sleeping contracts. These are old contracts signed for several years and which kept the price level of gas and electricity of the time. In December 2018, for a 3500 kWh consumer type, the yearly cost of these contracts was 882 AC to be compared to the cheapest offer at 631 AC [11]. This difference is, in fact, huge because the commodity (energy) is only a part of the total bill (between 25% to 30%). The share of taxes and levies is the most significant part of households electricity price (36% at European level / 33.9% at Belgian level/41.7% for Wallonia). Then follows the DSO cost (26.3%) and TSO cost (0.5%) (see [12] and https://www.ores.be/particuliers-et-professionnels/facture).
These numbers indicate that, even in this very high compet-itive markets, there is a significant percentage of customer for which electricity bills is not a concern and that they are not interested in this market. Following the CREG, it is 18% of the customers who have never changed from supplier [11]. To these consumers, we have to add those with a social contract, i.e. consumers that have been dropped by their suppliers because they have difficulties to pay their energy bills. It is not a matter of choice but, for the purpose of this paper, they cannot take any actions to join the community. their proportion is around 2.5% (numbers from the same sources).
III. ASSESSMENT OF THEθiCONSUMERS AND THE DISTRIBUTION OFβx,θi
From these data, we can assess that the proportion of θi
consumers is 20.5%. For the distribution of β in the space I , we will assume that it is a normal distribution with 250 AC as the mean (i.e. the difference between the costs of ”sleeping contact” and cheapest contract) and zero is equal to three time the standard deviation.
IV. ANALYSES OF THE FUNCTIONING OF THERETAIL MARKET REGARDING”GREEN APPETITE”
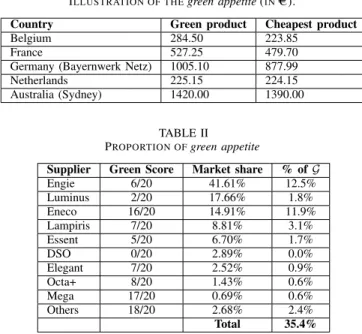
Another interesting aspect of the retail market is to look at the products and contract types proposed to customers. Beside the duration of the contracts, suppliers are offering special green energy contracts with electricity mostly gen-erated from renewable sources (or compensated by a green label Guarantee of Origin following Directives 2001/77/CE, 2003/54/CE, 2004/8/CE, and 2009/28/EC). Table I shows the prices of this product compared to the cheapest product for some countries/region based on [8] and for Australia use of https://www.energymadeeasy.gov.au/, for 3500 kWh consumer without PV and any discount)
The aim of this table is not to compare prices between countries because the price structure is not the same (Belgium and Netherlands only commodity price, for other countries some DSO components already included). Nevertheless, it can be observed that, generally speaking, green products are more expensive than a classical product. That indicates there are customers, concerned by environmental issues, ready to pay more in order to use renewable energy. We can use these
TABLE I
ILLUSTRATION OF THEgreen appetite(INAC).
Country Green product Cheapest product
Belgium 284.50 223.85
France 527.25 479.70
Germany (Bayernwerk Netz) 1005.10 877.99
Netherlands 225.15 224.15
Australia (Sydney) 1420.00 1390.00
TABLE II
PROPORTION OFgreen appetite
Supplier Green Score Market share % of G
Engie 6/20 41.61% 12.5% Luminus 2/20 17.66% 1.8% Eneco 16/20 14.91% 11.9% Lampiris 7/20 8.81% 3.1% Essent 5/20 6.70% 1.7% DSO 0/20 2.89% 0.0% Elegant 7/20 2.52% 0.9% Octa+ 8/20 1.43% 0.6% Mega 17/20 0.69% 0.6% Others 18/20 2.68% 2.4% Total 35.4%
numbers to approximate the ξx < 0 in the relation ?? by
considering that ξxis a normal distribution with a mean equal
to 0.017 AC/kW h (i.e the difference between cheapest price and green contract for Belgium divided by 3500 kWh) and zero is equal to three time the standard deviation.
Regarding the proportion of consumer in the space θg it is
not possible to have a clear numbers of green contract as these data are confidential. Anyway, we can use some sources to approach this. On one hand, in Belgium, Greenpeace published a scoring (on 20) for every supplier [15]. This score give how green is the supplier beyond the commercial announcement. On the other hand, the federal regulator published the share of the residential market for each supplier [16]. To infer the proportion of consumer type θg, we multiply these two
numbers. The rational behind this approach is that consumer who really care about environment could consider such scoring mechanism done by a (for them) trusted third party. The data are shown on table II.
Complementary, the proportion of θc is equal to 44.1%(i.e
100%-20.5%-35.4%).
REFERENCES
[1] European Union. Directive 2018/2001 of the European Parliament and of the Council of 11 December 2018 on the promotion of the use of energy from renewable sources. In: Official Journal of the European Union 328 (2018), pp. 82209.
[2] Liam Byrnes, Colin Brown, Liam Wagner, and John Foster. Reviewing the viability of renewable energy in community electrification: The case of remote Western Australian communities. In: Renewable and Sustainable Energy Reviews 59 (2016), pp. 470481.
[3] Miguel Manuel de Villena, Raphael Fonteneau, Axel Gautier, and Damien Ernst. Evaluating the Evolution of Distribution Networks under Different Regulatory Frameworks with Multi-Agent Modelling. In: Energies 12.7 (2019), p. 1203.
[4] Fehr, E., & Gachter, S. (2002). Altruistic punishment in humans. Nature, 415(6868), 137.
[5] Leimar, O. & Hammerstein, P. Evolution of cooperation through indirect reciprocity.Proc. R. Soc.Lond. B268,745-753 (2001)
[6] Fehr, E., & Fischbacher, U. (2004). Third-party punishment and social norms. Evolution and human behavior, 25(2), 63-8
[7] Abada, I., Ehrenmann, A., & Lambin, X. (2018). Un-intended consequences: The snowball effect of energy communities Available at https://www.repository.cam.ac.uk /bitstream/handle/1810/277393/cwpe1828.pdf?sequence=1
[8] PYC for CREG, An European comparison of electricity and natural gas prices for residential and small professional consumers, Belgium, June 2018
[9] CEER, Retail Markets Monitoring Report (Ref: C17-MMR-83-02), Bel-gium November 2017
[10] Rhoades, Stephen A, The herfindahl-hirschman index. In Fed. Res. Bull. ; HeinOnline, 1993 volume 79, page 188
[11] CREG, Infographie pour les residentiels. December 2018, url: https://www.creg.be/sites/default/files/assets/Prices/InfographResFr.pdf [12] EUROPEAN COMMISSION STAFF WORKING DOCUMENT,
En-ergy Union Factsheet Belgium (ref:SWD(2017) 385 fina ). November 2017
[13] Pricewise, Results collective tendering year 2017, January 2018, url:https://www.pricewise.com/fr/references/ 2017 facts and figures [14] European Parlement and Council, Directive (EU) 2018/2001 of the
European Parliament and of the Council of 11 December 2018 on the promotion of the use of energy from renewable sources, OJ L 328, 21.12.2018, p. 82209
[15] Greenpeace Classement des fournisseurs url: https://monelectriciteverte.be/ranking consulted September 1st, 2019 [16] CREG Parts de march des fournisseurs d’nergie url:
https://www.creg.be/fr/consommateurs/le-marche-de-lenergie/parts-de-marche-des-fournisseurs-denergie consulted September 1st, 2019