DRAFT VERSIONMAY21, 2019
Typeset using LATEX default style in AASTeX61
QATAR EXOPLANET SURVEY: QATAR-8B, 9B AND 10B — A HOT SATURN AND TWO HOT JUPITERS
KHALIDALSUBAI,1ZLATANI. TSVETANOV,1STYLIANOSPYRZAS,1 DAVIDW. LATHAM,2ALLYSONBIERYLA,2 JASONEASTMAN,2
DIMITRISMISLIS,1G ILBERTA. ESQUERDO,2J OHNSOUTHWORTH,3L UIGIMANCINI,4, 5, 6, 7A LIESAMDIN,8J INZHONGLIU,8
LUMA,8MARCBRETTON,9ENRICPALLÉ,10, 11FELIPEMURGAS,10, 11NICOLASP. E. VILCHEZ,1HANNUPARVIAINEN,10, 11
PILARMONTAÑES-RODRIGUEZ,10, 11N
ORIONARITA,12, 13, 14, 15, 10A
KIHIKOFUKUI,16, 10N
OBUHIKOKUSAKABE,13
MOTOHIDETAMURA,12, 13KHALIDBARKAOUI,17, 18FRANCISCOPOZUELOS,17MICHAELGILLON,17EMMANUELJEHIN,17
ZOUHAIRBENKHALDOUN,18A
HMEDDAASSOU,18
ANDHANIM. DALEE1
1Hamad bin Khalifa University (HBKU), Qatar Foundation, PO Box 5825, Doha, Qatar 2Harvard-Smitsonian Center for Astrophysics, 60 Garden Street, Cambridge, MA 02138, USA 3Astrophysics Group, Keele University, Staffordshire ST5 5BG, UK
4Department of Physics, University of Rome Tor Vergata, Via della Ricerca Scientifica 1, I-00133 Roma, Italy 5Max Planck Institute for Astronomy, Königstuhl 17, D-69117 Heidelberg, Germany
6INAF-Osservatorio Astrofisico di Torino, Via Osservatorio 20, I-10025 Pino Torinese, Italy
7International Institute for Advanced Scientific Studies (IIASS), Via G. Pellegrino 19, I-84019 Vietri sul Mare (SA), Italy
8Xinjiang Astronomical Observatory (XAO), Chinese Academy of Sciences, 150 Science 1-Street, Urumqi, Xinjiang 830011, China 9Observatoire des Baronnies Provençales (OBP), Le Mas des Grés, Route de Nyons, 05150 Moydans, France
10Instituo de Astrofísica da Canarias (IAC), 38205 La Laguna, Tenerife, Spain
11Departamento de Astrofísica, Universidad de La Laguna (ULL), 38206 La Laguna, Tenerife, Spain
12Department of Astronomy, Graduate School of Science, The University of Tokyo, 7-3-1 Hongo, Bunkyo-ku, Tokyo 113-0033, Japan 13Astrobiology Center, National Institutes of Natural Sciences, 2-21-1 Osawa, Mitaka, Tokyo 181-8588, Japan
14JST, PRESTO, 7-3-1 Hongo, Bunkyo-ku, Tokyo 113-0033, Japan
15National Astronomical Observatory of Japan, 2-21-1 Osawa, Mitaka, Tokyo 181-8588, Japan
16Department of Earth and Planetary Science, Graduate School of Science, The University of Tokyo, 7-3-1 Hongo, Bunkyo-ku, Tokyo 113-0033, Japan 17Space sciences, Technologies and Astrophysics Research (STAR) Institute, Université de Liège, Allée du 6 Août 17, Bat. B5C, 4000, Liège, Belgium 18Oukaimeden Observatory, High Energy Physics and Astrophysics Laboratory, Cadi Ayyad University, Marrakech, Morocco
(Received 7 December 2018; Revised 20 February 2019; Accepted 14 April 2019)
Submitted to AJ ABSTRACT
In this paper we present three new extrasolar planets from the Qatar Exoplanet Survey (QES). Qatar-8b is a hot Saturn, with MP = 0.37 MJ and RP = 1.3 RJ, orbiting a solar-like star every Porb = 3.7 days. Qatar-9b is a hot Jupiter with a mass of
MP= 1.2 MJand a radius of RP= 1 RJ, in a Porb= 1.5-days orbit around a low mass, M?= 0.7 M , mid-K main-sequence star.
Finally, Qatar-10b is a hot, Teq ∼ 2000 K, sub-Jupiter mass planet, MP = 0.7 MJ, with a radius of RP = 1.54 RJ and an orbital
period of Porb= 1.6 days, placing it on the edge of the sub-Jupiter desert.
Keywords: techniques: photometric - planets and satellites: detection - planets and satellites: fundamental parameters - planetary systems.
Corresponding author: Khalid Alsubai
kalsubai@qf.org.qa
1. INTRODUCTION
Since Mayor & Queloz (1995) announced 51 Peg, the first extrasolar planet around a main-sequence star, the number of extrasolar planets has been rising steadily, revealing the large diversity in physical properties and configurations of the underlying extrasolar planets population. In order to properly understand this diversity, a large sample of well-characterized, in terms of physical properties, planets and their respective host stars is required.
Large-scale, ground-based surveys for transiting extrasolar planets, such as OGLE-III (Udalski et al. 2002); TrES (Alonso et
al. 2004); HATNet (Bakos et al. 2004); XO (McCullough et al. 2005); WASP (Pollacco et al. 2006); KELT (Pepper et al. 2007);
and QES (Alsubai et al. 2013), have played a pivotal role both in significantly increasing the numbers of known planets and in providing prime targets to fulfill the “well-characterized” requirement. By design, these surveys offer certain advantages: (i) the very fact that the planets are transiting implies that, generally, both the actual mass (MP, not only MPsini i) and the planet radius
(and by extension, the bulk density) can be determined; (ii) ground-based surveys are more sensitive to brighter host stars and larger planets; this (usually) allows for the physical properties of the planet to be determined with good precision (better than 10%) and offers the possibility of individual systems suitable for intensive follow-up studies.
In this paper we present three new transiting extrasolar planets discovered by QES: Qatar-8b — a hot Saturn around a solar-like star; Qatar-9b – a hot Jupiter orbiting a mid-K main-sequence star; and Qatar-10b – a hot Jupiter around a late-F main-sequence star. The paper is organized as follows: in Section2we present the survey photometry and describe the follow-up photometry and spectroscopy used to confirm the planetary nature of the transits. In Section3we present the analysis of the data and the global system solutions using simultaneous fits to the available radial velocities (RVs) and follow-up photometric light curves, and in Section4we summarize our results and put the three new planets in the broader context of the exoplanets field.
2. OBSERVATIONS 2.1. Discovery photometry
The survey data were collected with QES, hosted by the New Mexico Skies Observatory1located in Mayhill, NM, USA. A full
description of QES can be found in our previous publications, e.g.,Alsubai et al.(2013),Alsubai et al.(2017).
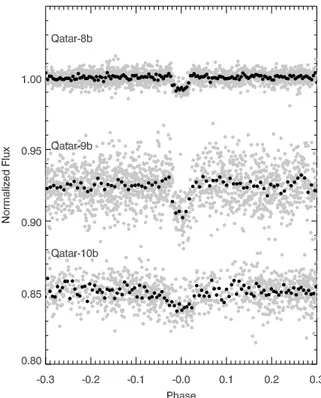
The discovery light curves of Qatar-8b and Qatar-9b contain 2 959 and 2 755 data points, respectively, obtained during obser-vations from December 5, 2016 to May 9, 2017. For Qatar-10b, the discovery light curve has 2 077 data points collected in the time period March 21 – November 1, 2017. The survey images are run through the QES pipeline, which extracts the photometric measurements using the image subtraction algorithm byBramich (2008). A full description of the pipeline can be found in
Alsubai et al.(2013).
The output light curves are ingested into the QES archive and are detrended using a combination of the Trend Filtering Algorithm(TFA,Kovács et al. 2005), which constructs a filter function from a set of field stars considered to be a representative template for systematics in the field, and the DOHA algorithm (Mislis et al. 2017), a co-trending algorithm used to eliminate lingering, quasi-systematic patterns identified from groups of stars that are highly correlated to each other. The light curves are then further processed with the TSARDI algorithm (Mislis et al. 2018), a machine learning points rejection algorithm that deals with any residual data irregularities. Qatar-8b, 9b and 10b were identified as strong candidates during a search for transit-like events using the Box Least Squares algorithm (BLS) ofKovács et al.(2002), following a procedure similar to that described inCollier Cameron et al.(2006). Note that, although the initial candidate selection is an automatic procedure, the final vetting is done by eye.
Figure1shows the discovery light curves for the three exoplanets discussed in this paper. 2.2. Follow-up photometry
Follow-up photometric observations of a number of transits of Qatar-8b, 9b and 10b were collected at five different observato-ries with the following combination of telescopes and instruments:
FLWO: The 1.5 m telescope at the Fred L. Whipple Observatory (Mount Hopkins, Arizona, USA) in combination with Kepler-Cam, equipped with a single 4k×4k Fairchild CCD with a 0.0037 pixel−1and a 23.01 × 23.01 on-sky field of view (FOV).
QFT: The 0.5 m Qatar Follow-up Telescope (New Mexico Skies Observatory, Mayhill, New Mexico, USA), equipped with a 1k×1k Andor iKon-M 934 CCD, yielding a FOV of 130× 130.
OBP: The 0.82 m telescope at the Observatoire des Baronnies Provençales2(Provence-Alpes-Côte d’Azur, France) equipped
with a FLI ProLine PL230 camera with a 2k×2k e2v CCD detector resulting in a 230× 230FOV.
1http://www.nmskies.com 2http://www.obs-bp.fr
QATAR-8B, 9B AND10B EXOPLANETS 3
Figure 1. The discovery light curves for Qatar-8b (top), Qatar-9b (middle) and Qatar-10b (bottom) folded to the period identified by the BLS analysis and plotted with an arbitrary vertical offset for clarity. The gray points represent the original observations, and the black points are the binned values to better guide the eye.
CAHA: The 1.23 m Zeiss telescope at the Centro Astronómico Hispano-Alemán (Calar Alto, Spain) in combination with the DLR-MKIII camera with a 4k×4k, e2v CCD resulting in a 21.05 × 21.05 FOV.
TCS: The 1.52 m Telescopio Carlos Sanchez at the Teide Observatory (Tenerife, Canary Islands, Spain) with the MuSCAT2 instrument, which takes images in 4 filters simultaneously. Each channel is equipped with a 1k×1k CCD, resulting in a 7.04 × 7.04
on-sky FOV. For a detailed description of MuSCAT2 and its dedicated photometric pipeline seeNarita et al.(2019).
TRAPPIST-North: The 0.6 m robotic TRansiting Planets and PlanetesImals Small Telescope3is located at Oukaimeden Obser-vatory, Morocco. It is equipped with a 2k×2k deep-depletion Andor IKONL BEX2 DD CCD camera with a pixel scale of 0.0060
and an on-sky FOV of 19.08 × 19.08.
All follow-up light curves were generated through differential aperture photometry performed on the sequence of images for each observing run. In each case a number of comparison stars were selected and those with excessive noise or suspected variability were excluded from the final analysis. For the CAHA observations, the telescope was defocused and data reduction was carried out using the DEFOT pipeline (Southworth et al. 2009,2014). For observations taken at FLWO, OBP and with QFT the telescope was kept only approximately in focus and we used the AstroImageJ software package (Collins et al. 2017) to extract the light curves. The MuSCAT2 instrument on TCS has a dedicated pipeline for extracting the light curves. The extraction of the fluxes for the TRAPPIST-North observations was done by aperture photometry on selected stars with the IRAF/DAOPHOT software package (Stetson 1987). Final transit light curves were produced by normalizing to a low order polynomial (maximum order 2 in one case, a straight line for all other cases) fitted to the flat part of the light curves which also removes small residual trends if present. The uncertainties in the CAHA and MuSCAT2 light curves are estimated from the point-to-point dispersion of the points out of transit and for all other cases are the combination of the photon noise and the background noise (see the AIJ package,Collins et al. 2017). Nevertheless, as the main source of uncertainties is residual systematics and not photon noise, when fitting the follow-up light curves EXOFASTv2 (see Section3.2) adds a variance term to each transit to enforce reduced χ2 ∼ 1.
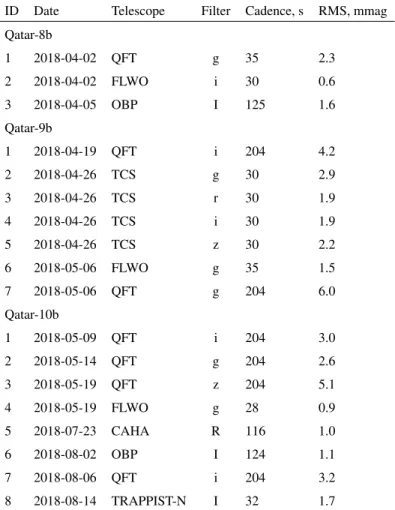
Table 1. Log of follow-up photometric observations for Qatar-8b, 9b and 10b. See text for details on telescopes and instruments. The last columns gives the mean error in 2 min bins.
ID Date Telescope Filter Cadence, s RMS, mmag Qatar-8b 1 2018-04-02 QFT g 35 2.3 2 2018-04-02 FLWO i 30 0.6 3 2018-04-05 OBP I 125 1.6 Qatar-9b 1 2018-04-19 QFT i 204 4.2 2 2018-04-26 TCS g 30 2.9 3 2018-04-26 TCS r 30 1.9 4 2018-04-26 TCS i 30 1.9 5 2018-04-26 TCS z 30 2.2 6 2018-05-06 FLWO g 35 1.5 7 2018-05-06 QFT g 204 6.0 Qatar-10b 1 2018-05-09 QFT i 204 3.0 2 2018-05-14 QFT g 204 2.6 3 2018-05-19 QFT z 204 5.1 4 2018-05-19 FLWO g 28 0.9 5 2018-07-23 CAHA R 116 1.0 6 2018-08-02 OBP I 124 1.1 7 2018-08-06 QFT i 204 3.2 8 2018-08-14 TRAPPIST-N I 32 1.7
A summary of our follow-up photometric observations is given in Table1where we list the date, telescope, filter, and cadence for each transit observation. In the last column we give the mean uncertainty in 2 min bins if the cadence is less than 2 min, otherwise for the original observations cadence. The resulting light curves, along with the best model fit and the corresponding residuals, are plotted in Figures2,3and4.
2.3. Follow-up spectroscopy
Follow-up spectroscopic observations to measure precision radial velocities for all three targets – Qatar-8b, 9b, and 10b – were obtained in the same manner as for all previous QES candidates (for details seeAlsubai et al.(2011) and subsequent papers). In brief, we used the Tillinghast Reflector Echelle Spectrograph (TRES) on the 1.5 m Tillinghast Reflector at FLWO. All spectra were obtained using the medium fiber, which results in a resolving power of R ∼ 44,000 and a velocity resolution element of 6.8 km s−1FWHM. The wavelength calibration was established using a Th-Ar hollow-cathode lamp illuminating the science fiber with two exposures obtained immediately before and after each target spectrum.
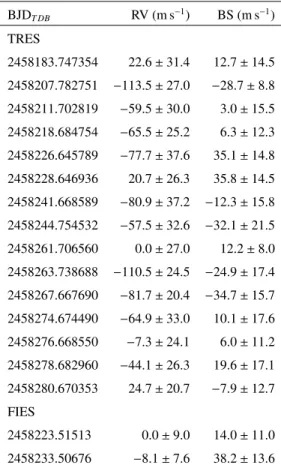
For each one of the three target stars we obtained the following TRES spectra: (a) Qatar-8 – 15 spectra between March 6, 2017 – June 11, 2018 with exposure times in the range 10–30 min and an average signal-to-noise ratio per resolution element (SNRe) ∼34 at the peak of the continuum in the echelle order centered on the Mg b triplet near 519 nm; (b) Qatar-9 – 9 spectra between February 23 – June 11, 2018 all with individual exposure times 60 min and an average SNRe ∼14.9; (c) Qatar-10 – 16 spectra between May 20 – September 28, 2018, with exposure times in the range 20–40 min and an average SNRe ∼30. For each of our target stars, we cross-correlated each observed spectrum against the ”reference” spectrum (taken to be the strongest among the spectra of the given star) to obtain relative radial velocities (RVs). This was done for a set of echelle orders (in an order-by-order fashion) chosen so as to have both good SNRe and minimal telluric line contamination.These RVs are reported in Tables2,3and4(with the time stamps in Barycentric Julian Date in Barycentric Dynamical time, BJDTDB) and plotted in
QATAR-8B, 9B AND10B EXOPLANETS 5
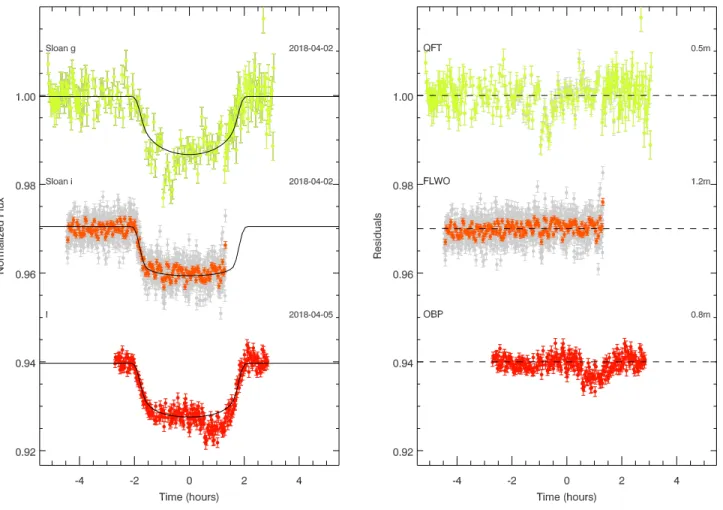
Figure 2. The three follow-up light curves of Qatar-8b. The left panel shows the light curves ordered from top to bottom as they appear in Table1with a vertically added shift for clarity. The solid, black lines are the best model fits (see Section3.2). The residuals from the fits are shown in the right panel. The individual data points are color coded according to the filter used and for observations taken with KeplerCam and Muscat2 we show both the original data points (light gray) as well as the data binned to a uniform cadence of 2 min. The filter, date of observation, observatory and telescope size are also given in the two panels.
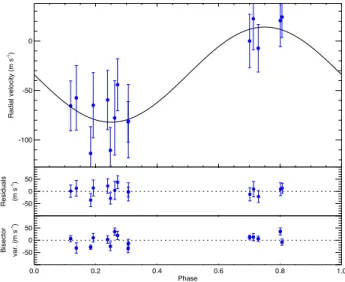
Figures5,6and7. The observation that was used for the template spectrum has, by definition, a RV of 0.0 km s−1, and the error on the template RV is the median of the uncertainties of all the orders. In order to be sure that the periodic RV signal detected in all three cases is due to orbital motion and exclude other astrophysical phenomena that could potentially produce a similar periodic signal, we also derived the line profile bisector span values (BS, lower panel in Figures5,6and7). Buchhave et al.
(2010) describe the procedures used above for both the RV and the BS measurements in more detail. The absolute center-of-mass velocity of each system is determined in two steps as the precise RV of each spectrum is measured against the strongest observed spectrum of the same star. That reference spectrum could be anywhere on the RV curve, and so a relative systemic velocity (γrel) is
determined when fitting the Keplerian model. The absolute systemic velocity is then the sum of γreland the absolute RV offset of
the reference spectrum which is determined by cross-correlating the Mg b order of the respective reference spectrum against the CfA library of synthetic templates. We also correct by −0.61 km s−1, because the CfA library does not include the gravitational redshift. This offset has been determined empirically by many observations of IAU Radial Velocity Standard Stars. We quote an uncertainty of ±0.1 km s−1in the resulting absolute velocity, which is an estimate of the residual systematic errors in the IAU
Radial Velocity Standard Star system. Note that the error in determining the absolute center of mass RV of each system does not affect the determination of the planetary parameters. Although a dedicated paper on the assessment of the TRES absolute zero
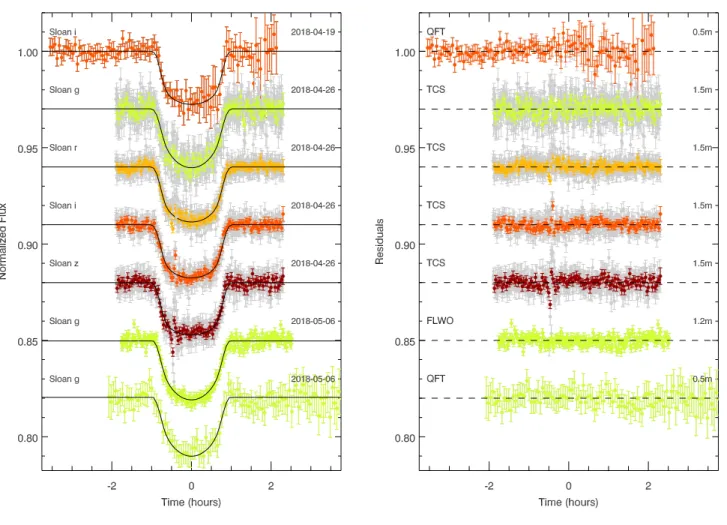
Figure 3. The seven follow-up transit light curves of Qatar-9b. All symbols, labels and colors follow the same convention as in Figure2.
point has not been published, we refer the interested reader toQuinn et al.(2014,2015), which gives a detailed account of the instrument RV precision, stability, sources of error and steps used to bring observed stellar velocities to the absolute scale of the IAU radial velocity system.
For Qatar-8 we also obtained 2 RV measurements, on April 15 and 25, 2018, with the high-resolution Fiber-fed Echelle Spectrograph (FIES, Telting et al. 2014) on the 2.5 m Nordic Optical Telescope (NOT) at the Observatorio del Roque de los Muchachos (ORM) on the island of La Palma, Canary Islands, Spain. We used FIES in its high resolution mode R ∼ 67,000 and a velocity resolution element of 4.8 km s−1FWHM. For the first observation we obtained a single 30 min exposure spectrum,
while for the second observation we obtained three consecutive 15 min exposure spectra. Similar to the TRES observations, the wavelength calibration was established using exposures of a Th-Ar lamp illuminating the science fiber bracketing the target exposure spectra. Relative RV measurements were obtained through the cross-corellation technique described above and using the spectrum obtained on April 15, 2018 (Texp= 30 min) as a template. Each one of the 3 spectra obtained on April 25, 2018 was
measured separately against the template and the three measurements were averaged.
3. ANALYSIS AND RESULTS 3.1. Rejecting False Positives
For all three targets, the observed transit light curves combined with the shape and amplitude of the RV variations, are well described by a planet orbiting a single star. Nevertheless, there are astrophysical scenarios not involving a planet that could mimic
QATAR-8B, 9B AND10B EXOPLANETS 7
Figure 4. Same as Figures2and3but for Qatar-10b. All symbols, labels and colors follow the same convention.
-100 -50 0 Radial velocity (m s -1) -50 0 50 Residuals (m s -1) 0.0 0.2 0.4 0.6 0.8 1.0 Phase -50 0 50 Bisector var. (m s -1)
Table 2. Relative RVs and BS variations for Qatar-8. BJDT DB RV (m s−1) BS (m s−1) TRES 2458183.747354 22.6 ± 31.4 12.7 ± 14.5 2458207.782751 −113.5 ± 27.0 −28.7 ± 8.8 2458211.702819 −59.5 ± 30.0 3.0 ± 15.5 2458218.684754 −65.5 ± 25.2 6.3 ± 12.3 2458226.645789 −77.7 ± 37.6 35.1 ± 14.8 2458228.646936 20.7 ± 26.3 35.8 ± 14.5 2458241.668589 −80.9 ± 37.2 −12.3 ± 15.8 2458244.754532 −57.5 ± 32.6 −32.1 ± 21.5 2458261.706560 0.0 ± 27.0 12.2 ± 8.0 2458263.738688 −110.5 ± 24.5 −24.9 ± 17.4 2458267.667690 −81.7 ± 20.4 −34.7 ± 15.7 2458274.674490 −64.9 ± 33.0 10.1 ± 17.6 2458276.668550 −7.3 ± 24.1 6.0 ± 11.2 2458278.682960 −44.1 ± 26.3 19.6 ± 17.1 2458280.670353 24.7 ± 20.7 −7.9 ± 12.7 FIES 2458223.51513 0.0 ± 9.0 14.0 ± 11.0 2458233.50676 −8.1 ± 7.6 38.2 ± 13.6
Table 3. Relative RVs and BS variations for Qatar-9. BJDT DB RV (m s−1) BS (m s−1) 2458172.753789 −508.1 ± 62.8 −29.4 ± 33.6 2458216.655360 100.7 ± 90.8 55.9 ± 52.8 2458259.747481 −60.5 ± 57.8 −12.5 ± 43.7 2458266.688086 −550.1 ± 37.1 −167.1 ± 29.1 2458273.684727 −43.8 ± 49.5 28.0 ± 34.0 2458276.698788 0.0 ± 57.8 54.4 ± 21.8 2458277.715329 −213.2 ± 74.9 56.3 ± 60.1 2458279.694742 38.7 ± 49.4 −9.1 ± 43.0 2458280.702564 −458.2 ± 40.2 23.6 ± 29.8
such a behaviour. These include an eclipsing binary – either a background or in a hierarchieal tripple system – blended with the primary much brighter star. Next we put forward arguments that allow us to exclude such scenarios.
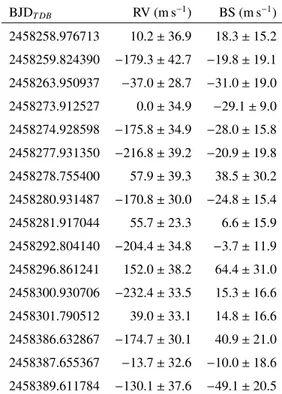
It has been well established (e.g.,Queloz et al. 2001,Torres et al. 2005) that if the observed RV pattern were a result of a blend with an eclipsing binary, the spectral line bisectors (see Tables2,3, and4) would follow a similar pattern, that is, they would vary in phase with the photometric period and with a similar amplitude. The measured line bisectors are shown in the bottom panel in Figures5,6, and7on the same scale as the RV residuals from the Keplerian orbit fit. No obvious pattern is seen in all three cases. To quantify that we performed a significance test on the Pearson’s correlation between the BS and RV for each star, and also the BS and the Keplerian fit model. In each of the three cases, the correlation between the BS and the RV (or between the BS and the Keplerian model) is insignificant, while the correlation between the RV and the Keplerian model is highly significant.
QATAR-8B, 9B AND10B EXOPLANETS 9
Table 4. Relative RVs and BS variations for Qatar-10. BJDT DB RV (m s−1) BS (m s−1) 2458258.976713 10.2 ± 36.9 18.3 ± 15.2 2458259.824390 −179.3 ± 42.7 −19.8 ± 19.1 2458263.950937 −37.0 ± 28.7 −31.0 ± 19.0 2458273.912527 0.0 ± 34.9 −29.1 ± 9.0 2458274.928598 −175.8 ± 34.9 −28.0 ± 15.8 2458277.931350 −216.8 ± 39.2 −20.9 ± 19.8 2458278.755400 57.9 ± 39.3 38.5 ± 30.2 2458280.931487 −170.8 ± 30.0 −24.8 ± 15.4 2458281.917044 55.7 ± 23.3 6.6 ± 15.9 2458292.804140 −204.4 ± 34.8 −3.7 ± 11.9 2458296.861241 152.0 ± 38.2 64.4 ± 31.0 2458300.930706 −232.4 ± 33.5 15.3 ± 16.6 2458301.790512 39.0 ± 33.1 14.8 ± 16.6 2458386.632867 −174.7 ± 30.1 40.9 ± 21.0 2458387.655367 −13.7 ± 32.6 −10.0 ± 18.6 2458389.611784 −130.1 ± 37.6 −49.1 ± 20.5 -600 -400 -200 0 Radial velocity (m s -1) -150 0 150 Residuals (m s -1) 0.0 0.2 0.4 0.6 0.8 1.0 Phase -150 0 150 Bisector var. (m s -1)
Figure 6. Orbital solution for Qatar-9b, showing the velocity curve and observed velocities and the bisector values.
Numerically, the probability of chance RS/RV correlation is higher than the typical significance level (5%): Qatar-8b – p-values, p= 0.061; Qatar-9b – p = 0.073; Qatar-10b – p = 0.067. This supports our argument that the observed RV pattern is a result of a gravitationally induced motion from a planet orbiting a single star.
A further argument in favor of the planet scenario can be drawn from the equal transit depths across all filters (accounting for limb darkening effects). We do, however, note that an eclipse of a stellar companion with very similar colors would also lead to equal depths at different wavelengths. As such, we consider the equal depths as supportive argument only, albeit in full agreement with our conclusion regarding the planetary nature of the transits.
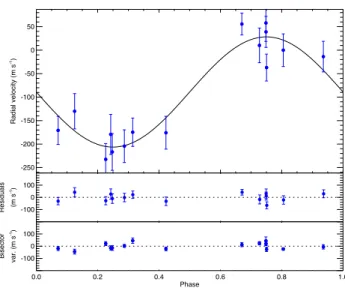
-250 -200 -150 -100 -50 0 50 Radial velocity (m s -1) -100 0 100 Residuals (m s -1) 0.0 0.2 0.4 0.6 0.8 1.0 Phase -100 0 100 Bisector var. (m s -1)
Figure 7. Orbital solution for Qatar-10b, showing the velocity curve and observed velocities and the bisector values.
0.1 1.0 10.0 λ (µm) 10-13 10-12 10-11 10-10 10-9 log λ Fλ (erg s -1 cm -2) 0.1 1.0 10.0 λ (µm) 10-13 10-12 10-11 10-10 log λ Fλ (erg s -1 cm -2) 0.1 1.0 10.0 λ (µm) 10-13 10-12 10-11 10-10 10-9 log λ Fλ (erg s -1 cm -2)
Figure 8. SED fit for the hosts stars of Qatar-8b (left panel), Qatar-9b (middle panel), and Qatar-10b (right panel). Photometric measurements used in each fit (Table5) are plotted here as error bars, where the vertical bars represent the quoted 1σ measurement uncertainties, and the horizontal bars mark the effective width of the passbands. The solid curve is the best fit SED from the NextGen library of models from the global EXOFASTv2 fit.
Physical properties of each system were determined through a global model fit using the EXOFASTV2 package. A detailed description of EXOFASTV2 can be found inEastman(2017) andRodriguez et al.(2017). For each of the three exoplanetary systems the global fit includes the RV measurements listed in Tables2,3and4, the follow-up transit light curves shown in Figures
2,3, and4, respectively, the distance and boradband photometry for each star, and the uses priors on the stellar atmospheric parameters (Teffand [Fe/H]) determined from the available specta.
Effective temperature (Teff), surface gravity (log g), metallicity ([m/H]) and projected rotational velocity (vrot) – for the host
stars were determined using the Stellar Parameter Classification tool (SPC,Buchhave et al. 2012). SPC works by cross correlating an observed spectram against a grid of synthetic spectra based on the Kurucz atmospheric models. We used the ATLAS9 grid of models with the Opacity Distribution Functions fromCastelli & Kurucz(2004). In Table5we list the weighted mean values and the associated uncertainties of the stellar athmospheric parameters determined from the SPC analysis of each individual spectrum. Broadband photometric surveys provide measurements across the electromagnetic spectrum for all three host stars, from the optical (APASS) to the mid-IR (WISE). These measurements are gathered in Table5 and used to fit a model Spectral Energy Distribution (SED) for each one of the stars as described below. The resulting SED fits are shown in Figure8.
In the global fit we apply Gaussian priors on the parallax from Gaia DR2, including the offset determined byStassun & Torrres
(2016) and impose an upper limit on the V-band extinction from the Galactic dust reddening maps (Schlafly & Finkbeiner 2011). The limb darkening coefficients (LDCs) were fit with a prior derived from an interpolation from theClaret & Bloemen(2011) tables for each band. We note that while all transit light curves were normalized as described in2.2in the global fit EXOFASTV2 treats the baseline flux (the flux outside the transit) as a free constant and adjusts its value to unity. Because all transit light curves were normalized in advance this adjustment is naturally very small.
QATAR-8B, 9B AND10B EXOPLANETS 11
Table 5. Basic observational and spectroscopic parameters of Qatar-8b, 9b, 10b host stars and photometry used for the SED fit.
Parameter Description Value Ref.
Names Qatar-8b Qatar-9b Qatar-10b
3UC 322-045544 302-100935 320-060170 2MASS J23540364+3701185 J23540364+3701185 J23540364+3701185 Astrometry α2000 RA (J2000) 10h29m38.962s 10h42m59.543s 18h57m46.537s 1 δ2000 DEC (J2000) +70o31037.5000 +60o57050.8300 +69o34015.0100 1 Photometry B Johnson B, mag 12.132 ± 0.084 15.515 ± 0.088 13.437 ± 0.080 2 V Johnson V, mag 11.526 ± 0.046 14.133 ± 0.048 12.879 ± 0.079 2 g Sloan g, mag 11.806 ± 0.018 14.894 ± 0.065 13.147 ± 0.124 2 r Sloan r, mag 11.355 ± 0.028 13.569 ± 0.061 12.712 ± 0.079 2 i Sloan i, mag 11.174 ± 0.015 13.074 ± 0.078 12.569 ± 0.109 2 J 2MASS J, mag 10.299 ± 0.023 11.835 ± 0.019 11.754 ± 0.022 3 H 2MASS H, mag 10.005 ± 0.024 11.235 ± 0.017 11.474 ± 0.023 3 K 2MASS K, mag 9.937 ± 0.015 11.104 ± 0.023 11.382 ± 0.017 3 W1 WISE1, mag 9.890 ± 0.023 11.021 ± 0.024 11.375 ± 0.023 4 W2 WISE2, mag 9.932 ± 0.021 11.120 ± 0.021 11.413 ± 0.020 4 W3 WISE3, mag 9.902 ± 0.033 10.986 ± 0.090 11.348 ± 0.067 4 Spectroscopic parameters
Spectral type G0V K5V F7V this work
Teff Effective temperature, K 5687±50 4363±51 6123±50 this work
log g Gravity, cgs 4.22±0.10 4.65±0.10 4.36±0.10 this work
[m/H] Metallicity 0.0±0.08 0.25±0.08 0.40±0.08 this work
γabs Systemic velocity, km s−1 5.57 ± 0.10 2.92 ± 0.10 −25.49 ± 0.10 this work vrot Rotational velocity, km s−1 2.7±0.5 4.3±0.5 5.9±0.5 this work
References—(1) GAIA DR2http://gea.esac.esa.int/archive/, (2) APASS9http://www.aavso.org/apass,
(3) 2MASShttp://irsa.ipac.caltech.edu/Missions/2mass.html, (4) WISEhttp://irsa.ipac.caltech.edu/Missions/wise.html
All of the host stars properties were determined during the global fit. EXOFASTV2 simultaneously uses the SED, the stellar density and limb darkening constraint from the transit, the MIST isochrones (Dotter 2016,Choi et al. 2016), priors from SPC (Teff, [Fe/H]) and Gaia (parallax), and an upper limit on the reddening, to simultaneously determine all the stellar properties.
The stellar radius is predominantly constrained by the SED and Gaia parallax, while the stellar age and mass are predominantly constrained by the MIST isochrones and spectroscopic priors. In addition, consistency between the stellar mass and radius derived from these methods and the stellar density from the transit is strictly required.
In fitting Qatar-8b, 9b, and 10b we only considered circular orbits and kept the eccentricity fixed to zero. On one hand, our RV data is not of high enough quality to allow investigation of potential small departures from circularity, and on the other hand we expect the planets orbits to have circularized. Following the equations fromJackson et al.(2008), and using the values from Table6of M?, R?, MP, RP, and a/ R?we estimate orbit circularization time-scales τcirc∼ 0.04, 0.01, 0.01 Gyr, respectively, for
the entire range of tidal quality factors Q?and QPconsidered by the authors (104− 108for each Q). This is much lower than the
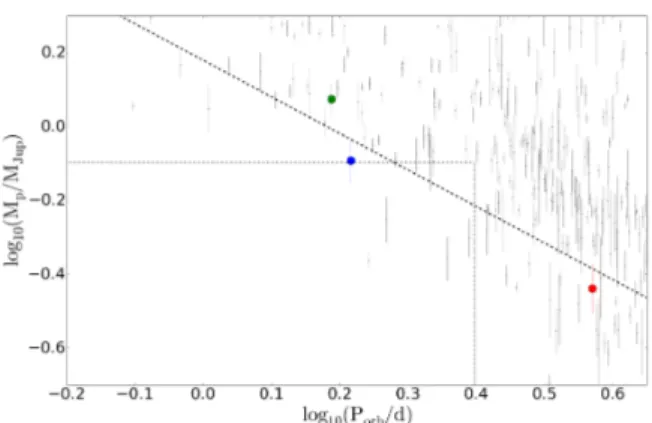
Figure 9. Orbital period versus planet mass. The planets data (gray points) are from TEPCat, while Qatar-8b, 9b and 10b are plotted as the red, green and blue points, respectively. The dotted box is the sub-Jupiter desert as defined bySzabó & Kiss(2011), while the dashed line is the upper limit of the same, as defined byMazeh et al.(2016).
A precise orbital period for each system is also obtained during the global fit. The best ephemeris for each star is calculated by fitting all transits simultaneously to a linear ephemeris within EXOFASTV2:
TC= 2458210.83980(85) + 3.71495(100) E (1)
TC= 2458227.75643(27) + 1.540731(38) E (2)
TC= 2458247.90746(36) + 1.645321(10) E (3)
where E is the number of cycles after the reference epoch, which we take to be the transit time that minimizes the covariance between TC and period, and the numbers in parenthesis denote the uncertainty in the last two digits. Equations 1,2, and3
correspond to Qatar-8b, 9b and 10b, respectively.
Table6summarizes the physical parameters of each planetary system. We note, that for Qatar-8b, for which we have RV measurements from two different telescopes and instruments, EXOFASTV2 fits the relative offset for each RV data set separately. These are the reported γrelvalues in the table. The Safronov number is not used in the current paper and is provided in Table6
for completeness, as it may be useful for other studies.
4. DISCUSSION AND CONCLUSIONS
In this paper we present Qatar-8b, 9b and 10b, a transiting hot Saturn and two transiting hot Jupiters identified by QES. We combine follow-up photometric and spectroscopic observations, together with available broadband photometry and GAIA measurements, to calculate a full set of physical parameters for the planets and their host stars. In Figures9and10we present the new discoveries in the context of the current state of the field. To produce these Figures, we made use of the well-studied sample of planets from the Transiting Extrasolar Planets Catalogue (TEPCat;Southworth 2011, online version4as of October 10, 2018)
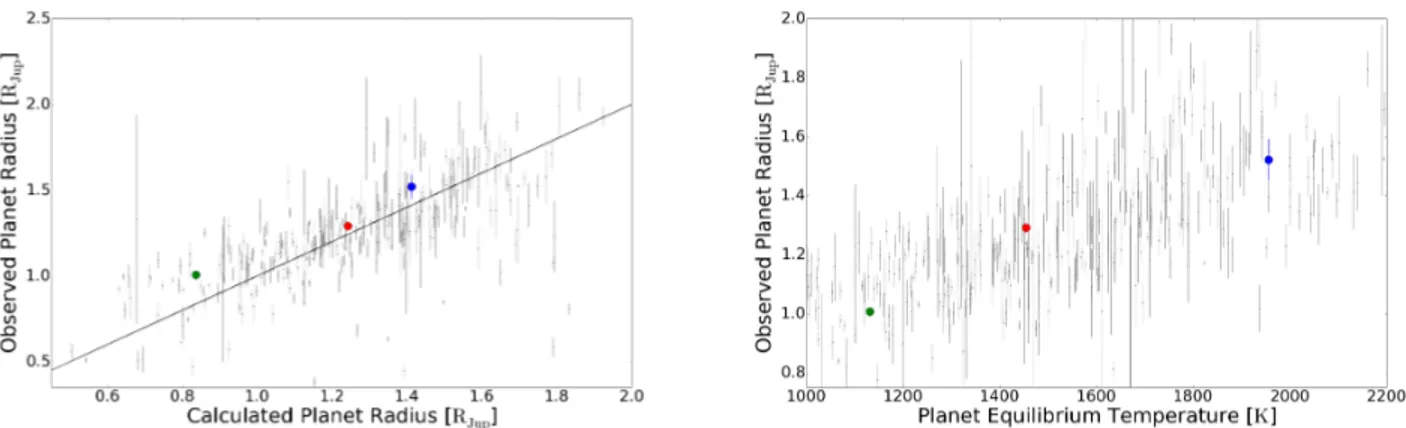
Qatar-8b is a typical example of a hot Saturn, Qatar-9b is slightly more massive than Jupiter itself, but with a similar radius, and Qatar-10b is a sub-Jupiter mass planet, very similar to HATS-9b (Brahm et al. 2015) and WASP-142b (Hellier et al. 2017). In the left panel of Figure10we present a predicted vs. observed planetary radii plot based on the widely usedEnoch et al(2012) relations. At face value, theEnoch et al(2012) relations underpredict the observed radius of Qatar-9b, while the observed radii of Qatar-8b and Qatar-10b are close to the theoretical predictions. We note however, that none of the three new exoplanets stand out from the rest and follow the general trend well.
An interesting aspect of Qatar-9b is the moderately large planet mass, MP = 1.19 MJ, in relation to the relatively low host
star mass, M? = 0.72 M . Using data from TEPCat, we find 59 planets with host mass M? < 0.8 M and only eight of these
have masses in the range 0.7 ≤ MP[ MJ] ≤ 2.5. The position of Qatar-9b in this scarcely populated region of the parameter
QATAR-8B, 9B AND10B EXOPLANETS 13
Table 6. Median values and 68% confidence intervals.
Parameter Units Qatar-8b Qatar-9b Qatar-10b
Stellar Parameters:
M∗. . . . Mass ( M ) . . . 1.029 ± 0.051 0.719 ± 0.024 1.156 ± 0.068 R∗. . . Radius ( R ) . . . 1.315 ± 0.020 0.696 ± 0.008 1.254 ± 0.026 L∗. . . Luminosity ( L ) . . . 1.690 ± 0.068 0.151 ± 0.004 1.993 ± 0.094 ρ∗. . . Density (g/cm3) . . . 0.641 ± 0.024 3.015 ± 0.086 0.823 ± 0.062 log(g∗) . Surface gravity (cgs) . . . 4.214 ± 0.016 4.610 ± 0.010 4.303 ± 0.027 Teff. . . . Effective temperature (K) . . . 5738 ± 51 4309 ± 31 6124 ± 46 [Fe/H] . Metallicity . . . 0.025 ± 0.071 0.252 ± 0.076 0.016 ± 0.089 τMIST. . Age (Gyr) . . . 8.3 ± 2.1 7.5 ± 4.5 3.2 ± 1.9 AV . . . . Extinction (mag) . . . 0.063 ± 0.042 0.016 ± 0.010 0.119 ± 0.062 π . . . Parallax (mas) . . . 3.614 ± 0.043 4.730 ± 0.036 1.855 ± 0.035 d. . . Distance (pc) . . . 276.7 ± 3.4 211.4 ± 1.6 539 ± 10 Planetary Parameters:
P. . . Period (days) . . . 3.71495 ± 0.00100 1.540731 ± 0.000038 1.645321 ± 0.000010 a. . . Semi-major axis (AU) . . . 0.0474 ± 0.0008 0.0234 ± 0.0003 0.0286 ± 0.0006 MP. . . . Mass ( MJ) . . . 0.371 ± 0.062 1.19 ± 0.16 0.736 ± 0.090 RP. . . . Radius ( RJ) . . . 1.285 ± 0.022 1.009 ± 0.014 1.543 ± 0.040 ρP. . . Density (g/cm3) . . . 0.216 ± 0.037 1.43 ± 0.20 0.248 ± 0.036 log(gP) Surface gravity . . . 2.745 ± 0.080 3.460 ± 0.063 2.884 ± 0.059 Teq. . . . Equilibrium Temperature (K) . . 1457 ± 14 1134 ± 9 1955 ± 25 Θ . . . Safronov Number . . . 0.0265 ± 0.0044 0.0764 ± 0.0100 0.0236 ± 0.0028 RV Parameters:
K. . . RV semi-amplitude (m/s) . . . 47.7 ± 8.0 259 ± 35 114 ± 13 γrel. . . . Relative RV offest, TRES (m/s) −34.2 ± 6.8 −252 ± 32 −89 ± 11 γrel. . . . Relative RV offest, FIES (m/s) 25 ± 13
e. . . Eccentricity (fixed) . . . 0 0 0
Primary Transit Parameters:
TC. . . . Time of transit (BJDTDB) . . . 2458210.83980 ± 0.00085 2458227.75643 ± 0.00027 2458247.90746 ± 0.00036 RP/R?. Radius of planet in stellar radii 0.1005 ± 0.0008 0.1489 ± 0.0009 0.1265 ± 0.0010 a/R?. . Semi-major axis in stellar radii 7.761 ± 0.100 7.236 ± 0.069 4.90 ± 0.12 i. . . Inclination (degrees) . . . 89.29 ± 0.70 89.23 ± 0.64 85.87 ± 0.96 b. . . Impact Parameter . . . 0.096 ± 0.093 0.097 ± 0.079 0.379 ± 0.055 T14. . . . Total duration (days) . . . 0.1678 ± 0.0017 0.0778 ± 0.0004 0.1155 ± 0.0009
space is shown in Figure11. We also note that Qatar-10b, at an orbital period of 1.65 days, is situated on the upper edge of the "sub-Jupiter desert” (e.g.Szabó & Kiss 2011;Mazeh et al. 2016, and see again Figure9).
The combination of relatively low surface gravity and relatively high equilibrium temperature for both 8b and Qatar-10b imply considerable-sized atmospheres. The atmospheric scale height, given by H = kT/gµ and assuming a Jupiter mean molecular mass of 2.3 times the mass of a proton, is calculated to be ∼930 km for Qatar-8b and ∼850 km for Qatar-10b. Taking into account the somewhat large host radii, the absorption signal, A, of an annular area of one atmospheric scale height during transit (Brown 2001) is calculated to be ∼200 ppm and ∼250 ppm for Qatar-8b and 10b, respectively.
Figure 10. Left panel: theoretical planetary radii, calculated fromEnoch et al(2012), versus observed planetary radii. Right panel: planetary equilibrium temperatures versus observed planetary radii. As in Figure9, in both panels, gray points are data from TEPCat, while the R-G-B dots represent Qatar-8b, 9b and 10b, respectively.
Figure 11. Stellar mass versus planet mass, illustrating the scarcity of Jupiter- and super-Jupiter mass planets around low mass hosts M∗ < 0.8 M . Gray points are data from TEPCat, while the larger green point indicates Qatar-9b.
ACKNOWLEDGEMENTS
This publication is supported by NPRP grant no. X-019-1-006 from the Qatar National Research Fund (a member of Qatar Foundation). The statements made herein are solely the responsibility of the authors. The Nanshan 1m telescope of XAO is supported by the CAS "Light of West China" program (XBBS-2014-25,2015-XBQN-A-02), and the Youth Innovation Promotion Association CAS (2014050). This article is partly based on observations made with the MuSCAT2 instrument, developed by ABC, at Telescopio Carlos Sánchez operated on the island of Tenerife by the IAC in the the Spanish Observatorio del Teide. This work is partly financed by the Spanish Ministry of Economics and Competitiveness through grants ESP2013-48391-C4-2-R. TRAPPIST-North is a project funded by the University of Liège, and performed in collaboration with Cadi Ayyad University of Marrakesh. The research leading to these results has received funding from an ARC grant for Concerted Research Actions financed by the Wallonia-Brussels Federation. M. Gillon and E. Jehin are F.R.S.-FNRS Senior Research Associates. L.M. acknowledges support from the Italian Minister of Instruction, University and Research (MIUR) through FFABR 2017 fund and from the University of Rome Tor Vergata through “Mission: Sustainability 2016” fund. This work has made use of data from the European Space Agency (ESA) mission Gaia (https://www.cosmos.esa.int/gaia), processed by the Gaia Data Processing and Analysis Consortium (DPAC,https://www.cosmos.esa.int/web/gaia/dpac/consortium). Funding for the DPAC has been provided by national institutions, in particular the institutions participating in the Gaia Multilateral Agreement. We also acknowledge support from JSPS KAKENHI Grant Number no. JP16K13791, 17H04574, 18H01265 and 18H05439, and JST PRESTO grant no. JPMJPR1775.
QATAR-8B, 9B AND10B EXOPLANETS 15
Alonso, R., Brown, T. M., Torres, G., et al. 2004, ApJ, 613, L153 Alsubai K., Parley, N. R., Bramich, D. M., West, R. G., et al., 2011,
MNRAS, 417, 709
Alsubai K., Parley, N. R., Bramich, D. M., Horne, K., et al., 2013, Acta Astron., 63, 465
Alsubai K., Mislis, D., Tsvetanov, Z. I., Latham, D. W., et al., 2017, AJ, 153, 200
Alsubai K., Tsvetanov, Z. I., Latham, D. W., Bieryla, A., et al., 2018, AJ, 155, 52
Bakos, G., Noyes, R. W., Kovács, G., et al. 2004, PASP, 116, 266 Barklem, P. S., Stempels, H. C., Allende Prieto, C., Kochukhov, O.
P., et al., 2002, A&A, 385, 951
Brahm, R., Jordán, A., Hartman, J. D., et al., 2015, AJ, 150, 33B Bramich D. M., 2008, MNRAS, 386, L77
Brown D. J. A., 2014, MNRAS, 442, 1844 Brown T. M., 2001, ApJ, 553, 1006B
Buchhave L. A., Bakos, G. Ã ˛A., Hartman, J. D., Torres, G., et al., 2010, ApJ, 720, 1118
Buchhave L. A., Latham, D. W., Johansen, A., Bizzarro, M., et al., 2012, Nature, 486, 375
Castelli F. & Kurucz, R. L., 2004, astro-ph/0405087 Claret A. & Bloemen, S., 2011, A&A, 529, 75 Collier Cameron, A. et al., 2006, MNRAS, 373, 799 Collier Cameron, A., Pollacco, D., Street, R. A., et al., 2006,
MNRAS, 373, 799
Choi, J., Dotter, A., Conroy, C., Cantiello, M., et al., 2016, ApJ, 823, 102
Dotter, A., 2016, ApJS, 222, 8
Eastman J., 2017, Astrophysics Source Code Library, ascl:1710.003
Enoch, B., Collier Cameron, A., Horne, K., 2012, A&A, 540A, 99E
Hellier, C., Anderson, D. R., Collier Cameron, A., et al., 2017, MNRAS, 465, 3693H
Henden A. A., Levine, S., Terrell, D., & Welch, D., 2015, AAS, 22533616H
Jackson B., Greenberg R., & Barnes R., 2008, ApJ, 678, 1396 Kovács G., Bakos G. & Noyes R., 2005, MNRAS, 356, 557 Kovács G., Zucker S. & Mazeh T., 2002, A&A, 391, 369
Mayor, M. and Queloz, D., 1995, Nature, 378, 355 Mazeh T., Holczer T., Faigler S., 2016, A&A, 589, A75 McCullough, P. R., Stys, J. E., Valenti, J. A., et al. 2005, PASP,
117, 783
Meléndez, J., Bergemann, M., Cohen, J. G., Endl, M., et al., 2012, A&A, 543, A29
Meléndez, J., Bergemann, M., Cohen, J. G., et al., 2014, A&A, 567, L3
Mislis, D., Pyrzas, S., Alsubai, K. A., et al. 2017, MNRAS, 465, 3759M
Mislis, D., Pyrzas, S., Alsubai, K. A., et al. 2018, MNRAS, 481, 1624M
Narita, N., Fukui, A., Kusakabe, N., et al., 2019, JATIS, 5, id.015001 (arXiv:1807.01908)
Pepper, J., Pogge, R. W., DePoy, D. L., et al. 2007, PASP, 119, 923 Pollacco, D. L., Skillen, I., Collier Cameron, A., et al. 2006, PASP,
118, 1407
Queloz, D., Henry, G. W., Sivan, J. P., et al. 2001, A&A, 379, 279 Quinn, S. N., White, R. J., Latham, D. W., et al. 2014, ApJ, 787, 27 Quinn, S. N., White, T. R., Latham, D. W., et al. 2015, ApJ, 803, 49 Rodriguez J. E., Zhou, G., Vanderburg, A., et al., 2017, AJ, 153,
256
Schlafly E. F. & Finkbeiner D. P., 2011, ApJ, 737, 103 Southworth, J., 2011, MNRAS, 417, 2166
Southworth, J., Hinse, T. C., Jørgensen, U. G., et al., 2009, MNRAS, 396, 1023
Southworth, J., Hinse, T. C., Burgdorf, M., et al., 2014, MNRAS, 444, 776
Stassun, K. G. & Torres G., 2016, ApJ, 831, 6 Stetson, P. B., 1987, PASP, 99, 191
Szabó G. M. & Kiss L. L., 2011, ApJ, 727L, 44S
Telting, J. H., Avila, G., Buchhave, L., Frandsen, S., et al., 2014, AN, 335, 41
Torres, G., Konacki, M., Sasselov, D., & Jha, S., 2005, ApJ, 619, 558
Torres, G., Andersen, J., & Giménez A., 2010, A&ARv, 18, 67 Tucci Maia M., Meléndez, J., Castro, M., et al., 2015, A&A, 576,
L10
Udalski, A., Paczynski, B., Zebrun, K., et al. 2002, Acta Astron., 52, 1