Surfology: concrete surface evaluation prior to
repair
Luc COURARD*, Frédéric MICHEL*, Damien SCHWALL*, Audrey Van der WIELEN*, Tomacz PIOTROWSKI**, Andrzej GARBACZ**, Fabien PEREZ *** and Benoît BISSONNETTE***
*University of Liège (Belgium), **Warsaw University of Technology (Poland) and ***Laval University (Québec, Canada)
Abstract
The study of adhesion of repair materials on concrete structures implies a good knowledge of the influence of concrete surface treatment. The effects of surface preparation technique are rarely clearly described and parameterised: it is consequently difficult to point out the real influence of roughness on adhesion results. A large research project has been realized with regards to the influence of concrete substrate strength and preparation technique efficiency. The surface roughness of concrete has been quantified by means of the projection “Moiré” technique, which is an interferometrical measurement method. Comparison between polished, scrabbled and hydro-jetted surfaces evaluation is presented. Keywords: concrete, surface, micro-cracking, NDT, roughness
1 Introduction
The study of adhesion of repair materials on concrete structures implies a good knowledge of the influence of concrete surface treatment (Courard [1]). Many authors describe the influence of the surface preparation technique on the superficial cohesion of
concrete (Bissonnette [5]) or the adhesion (Garbacz [6]). However, the effects of surface preparation technique is never clearly
described or quantified: it is consequently difficult to point out the real influence of roughness on adhesion results, as this is disturbed
by other effect like microcracking or bond coating (Bissonnette [5]). A first step was made by using mechanical profilometry to differentiate polished and sandblasted concrete surfaces (Courard [2], Courard [3] & Courard [4]). This technique is very accurate for investigations in laboratory, on a limited surface area. If Quality Control is requested or if it is impossible to core samples from the site, other procedures should be followed. That is the reason why optical analysis has been developed(Perez [7, 8]) in order to analyse larger surfaces. Some considerations about the two techniques are given hereafter.
2 Description of materials and surface preparation
Different types of surface preparation techniques were investigated: scarifying (SC), high pressure water jetting (HPW) and polishing (PTW) (Courard [2]). The visual observation of the concrete surfaces indicates that the high pressure water jetting technique induces a particular texture characterized by large waves mostly parallel to the water flow while scarifying will generally induce some oriented macro-roughness (grooved surface) (Fig.1).
polishing scarification hydro-jetting Figure 1. Different types of concrete surface
preparation
3 Scale effect and roughness parameters
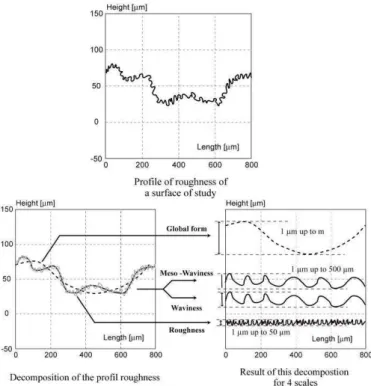
After treatment, concrete surfaces present fractal topography. As for any fractal object, it is possible to break up this surface or this profile in a sum of under-profiles. Each under-profile can be differentiated in terms of wavelengths; there is however no limit or precise criterion to validate the choice of decomposition method
(Fig.2). As the two surfometry methods have different resolutions, they make it possible to reach complementary scales of topography.
Figure 2. Scale effect on profile decomposition
The method with mechanical stylus and high resolution reaches two scales of roughness named: roughness (R) and waviness (W). The optical method, with a resolution of 0.200-µm, makes possible to reach two higher scales named meso-waviness (M) and form (F). A series of parameters make it possible to break up a total wave into two waves. The determination of surface parameters (Table 1) is realised on the basis of the mean line as a reference line (Courard [4]). Interesting information from surface analysis is the bearing ratio (Courard [3]) and the Abbott’s curve (Fig. 3).
The surface parameters defined on the basis of this curve let us to analyse not only the depth of the holes but also the shape of the profile: CF represents the depth of the profile, excluding high peaks and holes; CL is the relative height of the holes and CR the relative height of the peaks.
Table 1: Profile amplitude and statistic parameters. Parameter Definition
Xt total height of the profile
Xv maximum depth of the profile (holes)
Xp maximum height of the profile (peaks)
Xa arithmetic mean of the deviation of the profile from the mean line
Xq quadratic mean of the deviation of the profile from the mean line
Sk skewness of surface height distribution
Sm mean spacing between profile peaks at the mean line, measured
over the assessment length
The CF parameter gives an idea of the flatness of the surface: the lower it is, the more flat the profile is. Parameter CL gives an idea of the volume of voids, beneath the mean line of the profile, which could be fulfilled by the bond coat or the repair material.
4 Evaluation of the profile roughness by mechanical surphometry
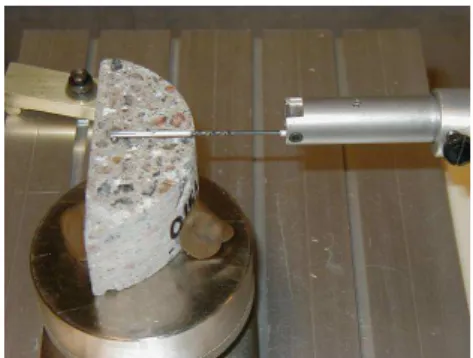
The technique has been already described in details (Courard [3]) and is only here rapidly remembered. A stylus is walked along the surface to be analysed and the profile is continuously registered (Fig. 4). The total registered profile is filtered in high and low frequencies in order to separate roughness and waviness, respectively (Courard [3]). Filtering will reduce to 50 % of the initial amplitude of a wave when its wavelength corresponds to the filter characteristic.
5 Evaluation of the profile roughness by opto-morphometry The projection “moiré” technique is an interferometrical
measurement method. The “moiré” phenomenon appears when two networks of light rays, made of equidistant lines - alternatively opaque and transparent -, are superimposed.
Figure 3. Abbott's curve (curve of bearing ratio) and curve parameters.
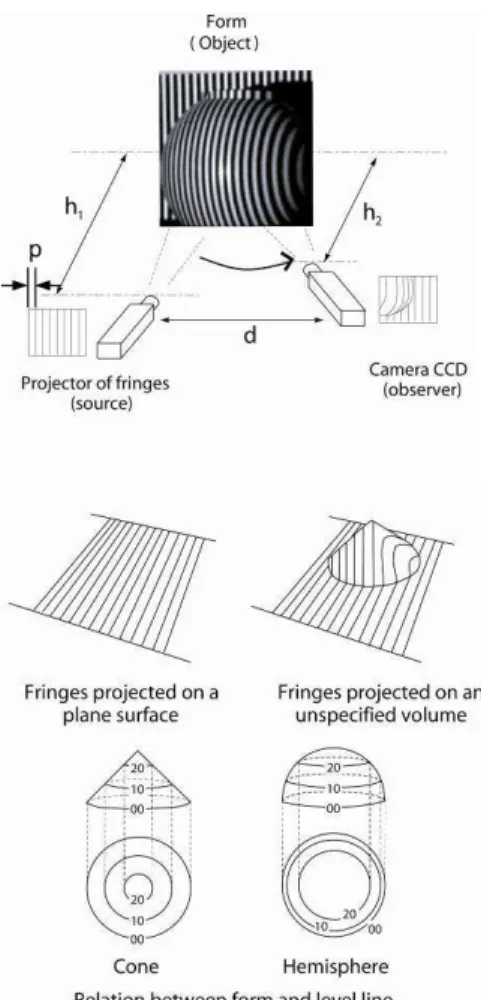
The technique of identification of relief is based on the
deformation’s measurement of a parallel fringes pattern projected on a surface (Fig. 5). The moiré’s fringes are similar to level lines representing the variations height of the object. By projecting a network of parallel fringes on a plane surface, this network will not be deformed; however, when projected on an unspecified form, this same network will be deformed according to the level of rise in this form (Fig. 5).
Figure 4. Stylus walking on the concrete surface.
Moreover, there is a relation between rise in the form and distance between each level line.
The measurement accuracy (Perez [8] is directly related to the density of the fringes network and the capacity of differentiation of the network by the system of image analysis (Fig.6).
Figure 5. Principles of the Moiré projection technique.
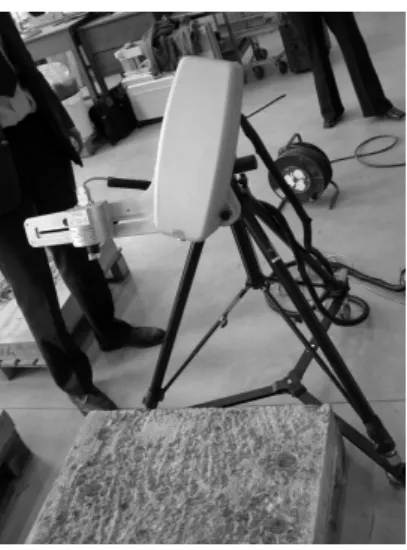
Because of the vertical resolution of the device, it is impossible, in this case, to separate roughness from waviness. A profile obtained through this approach will consequently give the description of meso-waviness and global form. A program – RugoDS - based on MatLab 7.0 (Courard [9]) permits to process numeric data from representation of Moiré projection in order to get surfometric
image of the profile (Fig. 6) as well as all the amplitude and statistic parameters before and after filtration (Table 2).
Figure 6. Testing system with camera CCD and parallel fringes pattern on surface.
6 Results
6.1 Mechanical evaluation
A first evaluation by mechanical profilometry has been realized by means of a stylus with diamond sphere radius of 6 µm. The length of measurement was 8 mm and the filter used to separate roughness from the profile was fixed to 0.8 mm. Three profiles were
registered on one sample of each kind of preparation; each profile on the sample was made in different directions. A second
measurement was made with stylus of 79-mm long and a diamond of 1.5 mm radius, in order to point out waviness. The length of the measurement was enlarged to 30-mm or more. The filter was again chosen at 0.8-mm and the filter to separate shape from the profile was 16mm (two times the dimensions of the aggregates).
Observation of the values of the roughness amplitude parameters (Table 2) clearly shows that Ra, Rq, Rt parameters are between 1.5 and 3 times smaller for the polished concrete profile than for water
jetting and scarification, and that the values of amplitude and statistical roughness parameters are equal for water jetting and scarification.
Table 2: Waviness (W) and roughness (R) parameters for mechanical evaluation (µm)
Treatment Polishing Water jetting Scarification
Wa 6 420 127 Wp 13 1003 346 Wq 9 501 158 Wv 47 923 445 Wt 60 1926 791 Ra 5 14 15 Rq 7 17 19 Rt 70 96 102 CR 4 152 412 CF 10 228 827 CL 14 231 537
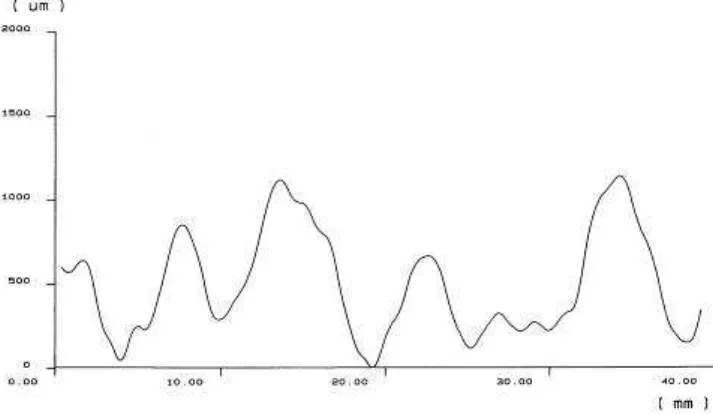
It is here confirmed that the surface treatment technique has no major influence on the micro-roughness (“high frequencies waves”) of the profile. However, the differences are more effectives for waviness parameters (Fig. 7).
Figure 7. Waviness profile after hydro-jetting surface treatment.
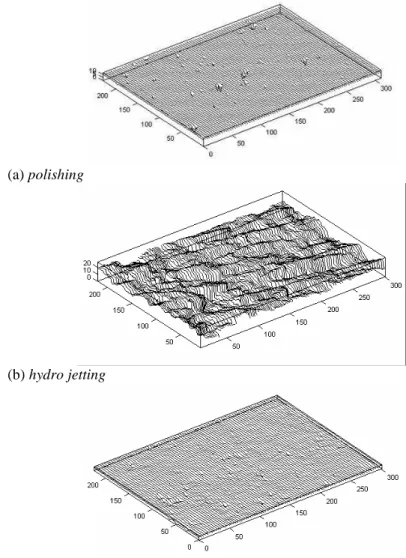
6.2 Opto-metrical evaluation
As the same way to mechanical evaluation, optometric topography evaluations have been realized. Fig. 8 presents the statements of the optical measurements. At this scale, water jetting seems to induce the largest”roughness”. Polishing and scarification are quite similar.
(a) polishing
(b) hydro jetting
(c) scarification
It’s probably due to the bubble effect at the surface which gives roughness aspect.
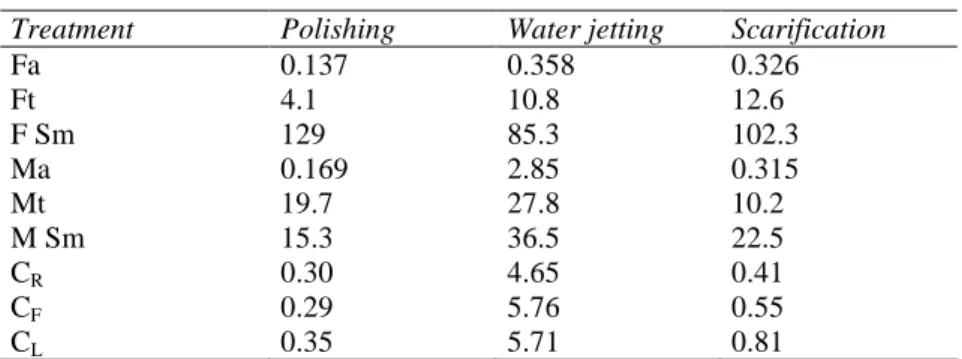
Observation of the values of the roughness amplitude parameters (Table 3) clearly shows that Ma parameter is 20 times more important for hydro jetting than for scarification and polishing. At this scale, the other treatments induce smooth surface. Polishing gives the less rough surface. The major part of apparent roughness of polishing surface comes from the bubble.
Table 3: Global form (F) and meso-waviness (M) parameters.for opto-metric evaluation (mm)
Treatment Polishing Water jetting Scarification
Fa 0.137 0.358 0.326 Ft 4.1 10.8 12.6 F Sm 129 85.3 102.3 Ma 0.169 2.85 0.315 Mt 19.7 27.8 10.2 M Sm 15.3 36.5 22.5 CR 0.30 4.65 0.41 CF 0.29 5.76 0.55 CL 0.35 5.71 0.81 7 Conclusions
The following conclusions may be reached from the present investigations. For mechanical analysis technique, one may consider that:
• stylus: because of the shape of the stylus, it is impossible to make measurements on very rough surfaces prepared by hydro-jetting for example;
• air bubbles: some of the air bubbles in concrete are so large that the stylus falls and the measurement is interrupted. That means that the selection of the zone to be investigated is very important;
• dimensions: this measurement is very high time consuming and it is the reason why the surface of investigation is limited. Moreover, this system is not usable on site.
Considering the use of opto-morphometry technique for the
concrete surface roughness characterization, it is important to point out that:
• all the amplitude and statistic parameters are higher for hydro-jetting than for scabbling and polishing at the end which is the equivalent of aggressiveness of treatment. Decreasing values are obtained for scabbling and polishing, respectively;
• for each profile, there are more high peaks than deep valleys. The highest asymmetry is present for scabbling profile; • opto-morphometric technique allows to analyze large surface
areas (1000cm², with horizontal resolution of 500µm and vertical resolution of 300µm);
But it remains that the filtration process has a major influence on results and profiles; it should be clearly discussed, as well as the accuracy that is needed for roughness profile representation, with regards to adhesion.
References
[1] Courard L., Bissonnette B. and Belair N. 2005. Effect of surface preparation techniques on the cohesion of superficial concrete: comparison between jack-hammering and water-jetting.. In: ICCRRR 2005 International Conference on Concrete Repair, Rehabilitation and Retrofitting (Eds. H. Beushausen, F. Dehn and M.G. Alexander), Cape Town, South Africa (21-23 Novembre 2005)
[2] Courard L., Garbacz, A. and Gorka, M. 2004. Concrete surface treatments quantification by means of mechanical profilometry. in: ICPIC, XIth International Congress on Polymers in Concrete (Ed. M. Maultzsch, Federal Institute for Materials Research and Testing), Berlin, Germany (2-4 June 2004): 125-132.
[3] Courard, L. and Nélis, M. 2003. Surface analysis of mineral substrates for repair works: roughness evaluation by profilometry and surfometry analysis. Magazine of Concrete Research. 55(4): 355-366.
[4] Courard, L. 1998. Parametric Definition of sandblasted and polished Concrete Surfaces, in: IXth International Congress on Polymers in Concrete, Bologna, Italy (ICPIC , Ed. P. Sandrolini,): 771-778.
[5] Concrete removal techniques: influence on residual cracking and bond strength. B. Bissonnette, L. Courard, A. Vaysburd and N. Bélair. Concrete International, 28(12) (Dec. 2006), 49-55.
[6] Garbacz, A., Courard, L., and Gorka, M. On the effect of concrete surface treatment on adhesion in repair systems. Magazine of Concrete Research. 57(1):49-60.
[7] Perez, F. 2005. Contribution à l’étude du comportement mécanique des éléments bicouches composés de bétons d’âges différents sous sollicitations statiques et cycliques. PhD Dissertation, Université Laval, Département de Génie Civil, Québec, Canada, 219p.
[8] F. Perez, L. Courard, B. Bissonnette, A. Garbacz and M. Gorka Two different techniques for the evaluation of concrete surface roughness.. In: ICCRRR 2005 International Conference on Concrete Repair, Rehabilitation and Retrofitting (Eds. H. Beushausen, F. Dehn and M.G. Alexander, 2006 Taylor & Francis Group, London), Cape Town, South Africa (21-23 Novembre 2005), 1015-1020.
[9] L. Courard, D. Schwall and T. Piotrowski. 2007. Concrete surface roughness characterization by means of opto-morphology technique. Monography: Adhesion in Interfaces of Building Materials: a Multi-Scale Approach (AMSR Advances in Material Science and Restoration, Eds. L. Czarnecki and A. Garbacz, Aedificio Publishers), pp.107-116.
8 Acknowledgments
This research project was financially supported by the Government of Québec (MRI), Canada, the Government of Poland and the Regional Government of Wallonia (DRI), Belgium.