arXiv:0908.0241v3 [astro-ph.EP] 5 Aug 2009
August 5, 2009
Transiting exoplanets from the
CoRoT space mission
⋆
VIII. CoRoT-7b: the first Super-Earth with measured radius
A. L´eger
1, D. Rouan
2, J. Schneider
3, P. Barge
4, M. Fridlund
11, B. Samuel
1, M. Ollivier
1, E. Guenther
5, M. Deleuil
4,
H.J. Deeg
6, M. Auvergne
2, R. Alonso
4, S. Aigrain
8, A. Alapini
8, J.M. Almenara
6, A. Baglin
2, M. Barbieri
4, H. Bruntt
2,
P. Bord´e
1, F. Bouchy
7, J. Cabrera
9,3, C. Catala
2, L. Carone
18, S. Carpano
11, Sz. Csizmadia
9, R. Dvorak
10, A. Erikson
9,
S. Ferraz-Mello
23, B. Foing
11, F. Fressin
13, D. Gandolfi
5, M. Gillon
12, Ph. Gondoin
11, O. Grasset
19, T. Guillot
13, A.
Hatzes
5, G. H´ebrard
20, L. Jorda
4, H. Lammer
14, A. Llebaria
4, B. Loeillet
1,4, M. Mayor, M.
12, T. Mazeh
17, C. Moutou
4,
M. P¨atzold
18, F. Pont
8, D. Queloz
12, H. Rauer
9,22, S. Renner
9,24, R. Samadi
2, A. Shporer
17, Ch. Sotin
19, B. Tingley
6, G.
Wuchterl
5, Adda M.
2, Agogu P.
16, Appourchaux T.
1, Ballans H.,
1, Baron P.
2, Beaufort T.
11, Bellenger R.
2, Berlin R.
25,
Bernardi P.
2, Blouin D.
4, Baudin F.
1, Bodin P.
16, Boisnard L.
16, Boit L.
4, Bonneau F.
16, Borzeix S.
2, Briet R.
16, Buey
J.-T.
2, Butler B.
11, Cailleau D.
2, Cautain R.
4, Chabaud P.-Y.
4, Chaintreuil S.
2, Chiavassa F.
16, Costes V.
16, Cuna Parrho
V.
2, De Oliveira Fialho F.
2, Decaudin M.
1, Defise J.-M.
15, Djalal S.
16, Epstein G.
2, Exil G.-E.
2, Faur C.
16, Fenouillet
T.
4, Gaboriaud A.
16, Gallic A.
2, Gamet P.
16, Gavalda P.
16, Grolleau E.
2, Gruneisen R.
2, Gueguen L.
2, Guis V.
4,
Guivarc’h V.
2, Guterman P.
4, Hallouard D.
16, Hasiba J.
14, Heuripeau F.
2, Huntzinger G.
2, Hustaix H.
16, Imad C.
2,
Imbert C.
16, Johlander B.
11, Jouret M.
16, Journoud P.
2, Karioty F.
2, Kerjean L.
16, Lafaille V.
16, Lafond L.
16, Lam-Trong
T.
16, Landiech P.
16, Lapeyrere V.
2, Larqu´e T.
2, Larqu T.
16, Laudet P.
16, Lautier N.
2, Lecann H.
4, Lefevre L.
2, Leruyet
B.
2, Levacher P.
4, Magnan A.
4, Mazy E.
15, Mertens F.
2, Mesnager J-M
16, Meunier J.-C.
4, Michel J.-P.
2, Monjoin W.
2,
Naudet D.
2, Nguyen-Kim K.
1, Orcesi J-L.
1, Ottacher H.
14, Perez R.
16, Peter G.
25, Plasson P.
2, Plesseria J.-Y.
15, Pontet
B.
16, Pradines A.
16, Quentin C.
4, Reynaud J.-L.
4, Rolland G.
16, Rollenhagen F.
25, Romagnan R.
2, Russ N.
25, Schmidt
R.
2, Schwartz N.
2, Sebbag I.
16, Sedes G.
2, Smit H.
11, Steller M.B.
14, Sunter W.
11, Surace C.
4, Tello M.
16, Tiph`ene D.
2,
Toulouse P.
16, Ulmer B.
21, Vandermarcq O.
16, Vergnault E.
16, Vuillemin A.
4, and Zanatta P.
2(Affiliations can be found after the references) Received February 23, 2009; accepted xxxxx
ABSTRACT
Aims. We report the discovery of very shallow (∆F/F ≈ 3.410−4), periodic dips in the light curve of an active V = 11.7 G9V star observed by the
CoRoT satellite, which we interpret as caused by a transiting companion. We describe the 3-colour CoRoT data and complementary ground-based observations that support the planetary nature of the companion.
Methods. We used CoRoT colours information, good angular resolution ground-based photometric observations in- and out- of transit, adaptive optics imaging, near-infrared spectroscopy, and preliminary results from radial velocity measurements, to test the diluted eclipsing binary scenarios. The parameters of the host star were derived from optical spectra, which were then combined with the CoRoT light curve to derive parameters of the companion.
Results.We examined all conceivable cases of false positives carefully, and all the tests support the planetary hypothesis. Blends with separation
>0.40′′or triple systems are almost excluded with a 8 10−4risk left. We conclude that, inasmuch we have been exhaustive, we have discovered a
planetary companion, named CoRoT-7b , for which we derive a period of 0.853 59 ± 3 10−5day and a radius of R
p= 1.68 ± 0.09 REarth. Analysis
of preliminary radial velocity data yields an upper limit of 21 MEarth for the companion mass, supporting the finding.
Conclusions. CoRoT-7b is very likely the first Super-Earth with a measured radius. This object illustrates what will probably become a common situation with missions such as Kepler, namely the need to establish the planetary origin of transits in the absence of a firm radial velocity detection and mass measurement. The composition of CoRoT-7b remains loosely constrained without a precise mass. A very high surface temperature on its irradiated face, ≈ 1800 – 2600 K at the substellar point, and a very low one, ≈ 50 K, on its dark face assuming no atmosphere, have been derived.
Key words.planetary systems – techniques: photometry – techniques: adaptive optics – techniques:spectroscopy – stars: fundamental parameters
⋆ The CoRoT space mission, launched on 27 December 2006,
has been developed and is operated by CNES, with the contribu-tion of Austria, Belgium, Brazil, ESA, Germany, and Spain. First CoRoT data are available to the public from the CoRoT archive: http://idoc-corot.ias.u-psud.fr. The complementary observations were obtained with MegaPrime/MegaCam, a joint project of CFHT and CEA/DAPNIA, at the Canada-France-Hawaii Telescope (CFHT) which is operated by NRC in Canada, INSU-CNRS in France, and the
University of Hawaii; ESO Telescopes at the La Silla and Paranal Observatories under programme ID 081.C-0413(C), DDT 282.C-5015; the IAC80 telescope operated by the Instituto de Astrof´ısica de Tenerife at the Observatorio del Teide; the Isaac Newton Telescope (INT), op-erated on the island of La Palma by the Isaac Newton group in the Spanish Observatorio del Roque de Los Muchachos of the Instituto de Astrofisica de Canarias; and at the Anglo-Australian Telescope that have been funded by the Optical Infrared Coordination network
1. Introduction
The space mission CoRoT is performing wide-field stellar pho-tometry at ultra-high precision (Rouan et al. 1998; Baglin et al. 2006). During an observing run, up to 12,000 stars can be mon-itored simultaneously and continuously over 150 days of obser-vation. CoRoT is thus particularly well-suited to detecting plan-ets with orbital periods shorter than 50 days. Because the transit signal is proportional to the planet’s projected surface, the first published CoRoT results (Barge et al. 2008; Alonso et al. 2008; Deleuil et al. 2008; Aigrain et al. 2008; Moutou et al. 2008) were focused on the population of rather massive planets, one of which has even been quoted as “the first inhabitant of the
brown-dwarf desert”, with a well-defined mass (20 ± 1 MJup)
and a well-defined radius (1.0 ± 0.1 RJup) (Deleuil et al. 2008).
However, CoRoT has the capability of detecting significantly smaller planets, and analysis of the noise on the light curves (LC hereafter) indeed shows that in many cases it is not far from the photon noise limit (see Aigrain et al., this volume). In the same line, blind tests performed by different teams of the CoRoT con-sortium on actual LCs where transits were added did confirm that the performances of CoRoT are such that ≈ 2 REarth hot
Super-Earth planets1are within reach. Such planets on close-in orbits should be accessible for stars brighter than mV≈13 (Auvergne 2006).
The study of small hot planets is becoming a major question (Mayor & Udry 2008; Mayor et al. 2009; Bouchy et al. 2009) that has a direct link with planetary system formation and evolu-tion. In this paper, we report the discovery of the smallest transit-ing object detected so far around a main-sequence star, an object that deserves the name of Super-Earth.
In transit surveys, ground-based follow-up is mandatory for confirming a transiting planet candidate. In the case of CoRoT-7b an intensive follow-up campaign has been set up, including programmes of photometry, imaging, spectroscopy, and radial velocity (RV), using different ground-based facilities over the world. The results of this campaign allow us to exclude almost all the possible false positive cases that could mimic a transiting planet. Preliminary results of RV measurements are consistent with the presence of a low mass planet and exclude any giant planet or stellar companion.
We present the photometric analysis of the CoRoT data where we discovered this shallow transit candidate (Sects. 2 and 4), as well as the photometric and imaging follow-up, includ-ing adaptive optics (Sect. 3), infrared spectroscopy (Sect. 5), and preliminary results of the RV measurements (Sect. 7) , all done in order to secure the planetary nature of the transiting body. The stellar parameters are presented in Sect. 8 and planetary ones in Sect. 9. Such a small and hot planet raises several questions about its composition, structure, and surface temperature, as dis-cussed in Sect. 10.
2. Photometric observations withCoRoT
The star CoRoT-7 was observed during the first long run of
CoRoT towards the Monoceros constellation (anti-centre run (OPTICON), a major international collaboration supported by the Research Infrastructures Programme of the European Commissions Sixth Framework Programme; Radial-velocity observations were ob-tained with the SOPHIE spectrograph at the 1.93m telescope of Observatoire de Haute Provence, France.
1 We define a Super-Earth as a planet larger than the Earth but without
a significant hydrogen envelope, e.g. < 10−3times the Earth mass. It can
be either rocky or water-rich (L´eger et al. 2004; Grasset et al. 2009).
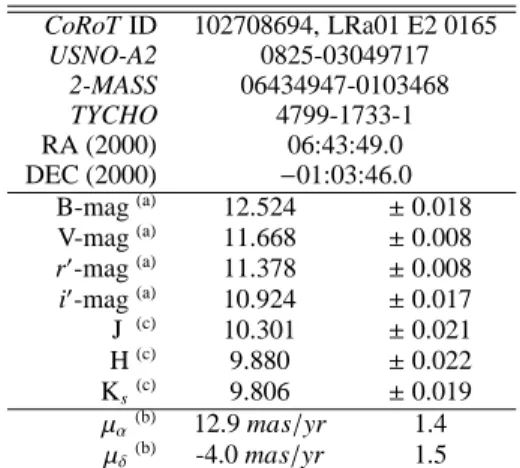
Table 1: CoRoT-7 IDs, coordinates, and magnitudes. CoRoT ID 102708694, LRa01 E2 0165 USNO-A2 0825-03049717 2-MASS 06434947-0103468 TYCHO 4799-1733-1 RA (2000) 06:43:49.0 DEC (2000) −01:03:46.0 B-mag(a) 12.524 ±0.018 V-mag(a) 11.668 ±0.008 r′-mag(a) 11.378 ±0.008 i′-mag(a) 10.924 ±0.017 J (c) 10.301 ±0.021 H(c) 9.880 ±0.022 Ks(c) 9.806 ±0.019 µα(b) 12.9 mas/yr 1.4 µδ(b) -4.0 mas/yr 1.5
(a) Provided by Exo-Dat, based on observations taken at theINT telescope.
(b) From TYCHO catalogue. (c) From 2-MASS catalogue.
LRa01, the letter a indicating that the field is close to the Galactic anti-centre). Its ID is given in Table 1, based on the Exo-Datdatabase (Deleuil et al. 2009). Because it is one of the brightest stars monitored in this field, it was a member of the oversampled (32 sec) target list from the beginning of theLRa01 run. After the first 40 days of data acquisition, theAlarm Mode pipeline (Quentin et al. 2006; Surace et al. 2008) detected the first series of transits in the star LC.
As illustrated by the whole CoRoT LC (Fig 1), CoRoT-7 is an active star. Its LC shows ≈ 2 % modulations, interpreted as the effect of stellar spots driven by the stellar rotation and crossing the disk. A period of ≈ 23 days is inferred.
Several teams of the CoRoT exoplanet consortium have searched for transits. Spurious spikes and stellar variations at frequencies outside the range expected for planetary transits were removed with low- and high-pass filters. Then, different detection algorithms were used and 153 individual transits were eventually detected. In agreement with the CoRoT consortium rules, the CoRoT-7 LC, with the same data pre-processing as in the present paper (v1 of data pipeline), will be accessible from 30 July 2009 at http://idoc-corot.ias.u-psud.fr/index.jsp (select: CoRoT Public N2 data / Run LRa01 / object with Corot ID 102708694), so that the reader can make his or her own reduc-tion and analysis of the data.
In this section, we seek to estimate the main transit parame-ters, i.e., period, central date, ingress/ egress duration, total du-ration, and relative depth, using a simple trapezoidal model. We proceed as follows: (1) outliers (mainly due to the satellite cross-ing of the South Atlantic anomaly) are filtered out from the LC using a 7-sample running median; (2) long-term stellar activ-ity is removed by subtracting a 0.854-day running median; (3) individual transits are corrected from a local linear trend com-puted on 3.75-hr windows centred on the transits but excluding the transits themselves; (4) a least-square fit of a trapezoidal tran-sit signal is performed using only data inside 3.75- hr windows centred on each transit.
Errors on the transit parameters were estimated using a procedure analogous to the bootstrap method described by Press et al. (1992), although slightly modified in order to pre-serve the correlation properties of the noise: (1) we compute a
Fig. 1: LC of the target CoRoT-7 without low-frequency filtering. The stellar rotation period, Protof 23 days can be inferred from
spot induced dips, as pointed out by arrows.
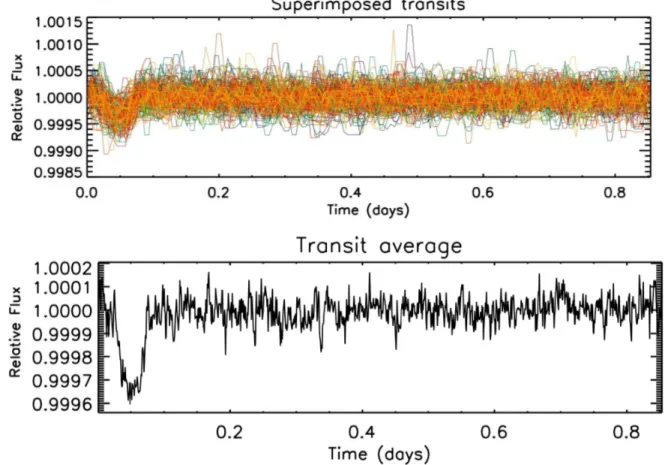
Fig. 2: Upper panel: superimposition of 153 individual segments of the LC divided according to the transit period determined by a detection algorithm after high-pass (3 times the transit period = 2.56 days) and low-pass (3 times the time resolution = 3 × 512 s) filtering. Individual transits are clearly seen when superimposed. Lower panel: mean value of the upper curves but with a shorter time resolution (64s) and a different low pass filtering (3 times the time resolution = 3 × 64 s) in order to better preserve the transit shape.
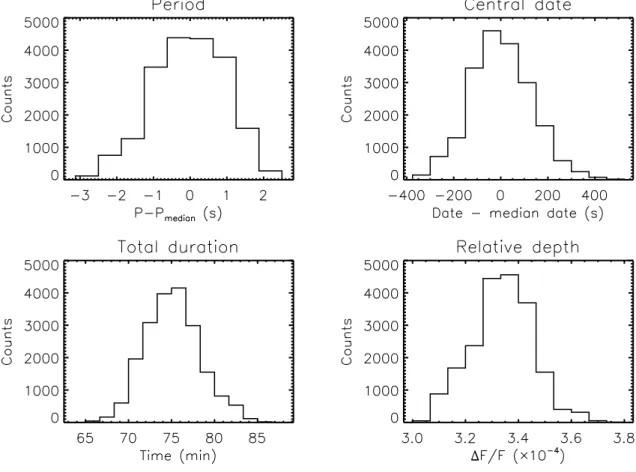
transit-free LC by subtracting our best-fit trapezoidal model to the data; (2) we re-insert the same transit signal at a randomly chosen phase; (3) we fit a trapezoidal model to the data and record the best-fit parameters; (4) steps 1-3 are repeated 20,000 times to build histograms used as estimators of the probability distributions for every transit parameter (Fig. 4). Finally, the
er-ror on a given parameter is computed as the median absolute deviation of its distribution.
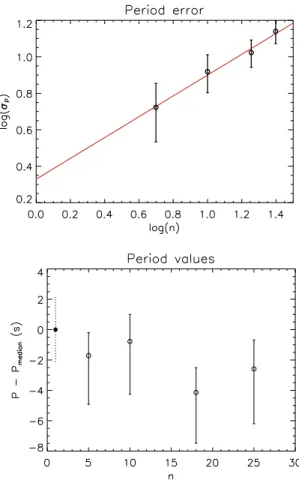
Because the period error yielded by the bootstrap seemed fairly small, we decided to check this result by carrying out a different calculation: (1) we produce 4 sets of n = 5, 10, 18, and 25 sub-LCs, each LC having the total duration of the initial LC, by keeping just one complete transit period out of 5,10,18,
Fig. 3: Averaged folded LCs in the three colours provided by the CoRoT instrument, after normalization. Red, green and blue signals are represented with the corresponding colours, and the white signal, summation of the three bands prior to normalization, is in black.
Fig. 4: Transit parameter distributions obtained from a bootstrap method for a trapezoidal transit signal.
and 25 consecutive transits respectively; within one set, the first transit of a sub-LC is shifted of one with respect to the previ-ous sub-LC; (2) for each of the 4 sets, we measure the period for every sub-LC with a trapezoidal least-square fit, compute the median period, the period standard deviation σP, and the error
on the standard deviation (Fig. 5); (3) we estimate the period standard deviation for the full LC by extrapolating σPfor n = 1.
For this purpose, we performed a least-square fit of a power law of the form σP(n) = σP(1) × nαand got α = 0.57 (close to the 0.5
exponent expected for uncorrelated measurements) and σP(1) =
2.1 s. We note that this error is a factor of 2 larger than the one obtained with the bootstrap method, so we conservatively chose to keep this higher value as our final estimate of the period error (Table 2).
We finally find a period of 0.853585 ± 24 10−6day. Figure 2, where all transits are superimposed, shows that even individual transits can be tracked down despite the low S/N. The fit by a trapezoid on the average curve yields the parameters: τ23= 0.808
Fig. 5: Period error calculation for the full LC based on a extrap-olation of period error estimates from chopped LCs containing one transit out of n and spanning the LC total duration. Left: pe-riod errors as a function of n. Right: deviation from the pepe-riod value Pmedianyielded by the bootstrap.
Table 2: Transit parameters and associated uncertainties, as modelled with a trapezoid.
period 0.853 585 ± 0.000 024 day
central date (1sttransit) 2 454 398.0767 ± 0.0015 HJD
ingress/egress duration 15.8 ± 2.9 min total duration (trapezoid) 75.1 ± 3.2 min
depth (trapezoid) 3.35 10−4±0.12 10−4
h, τ14= 1.253 h for the short and long bases of the trapezium2, and ∆F/F = 3.35 10−4±0.12 10−4. This is the faintest relative
flux change that has been detected in transit search photometry, up to now.
The CoRoT camera is equipped with a low-dispersion de-vice (a bi-prism) before the exoplanet CCDs (Rouan et al. 2000, 1998; Auvergne 2006) that provides LCs in three colours, called red, green and blue, even if the band pass does not correspond to classical photometric filters. The corresponding phase-folded and averaged LCs are shown in Fig.3. The transit is observed in the three colours with similar relative depths, a behaviour
ex-2 We use τ
i jfor the parameters related to the trapezoidal fit and Ti j
for the parameters related to the more realistic transit modelling (see Sect. 9)
Fig. 6: Shift-and-add image of the stack of 100 exposures taken at CFHT with MEGACAM. The arrows indicate the two faint stars located at ≈ 5 arcsec from CoRoT-7 (at the centre of the image) and about ∆m = 10 mag fainter. The size of the field shown is 1 arcmin (see scale); north is to the top and east to the left. The insert to the left shows the shape, size, and orientation of the photometric mask applied on the star CoRoT-7 onboard
CoRoT and the X marks the position of the star on the mask.
The grey levels corresponds to the measurement by CoRoT on an imagette.
pected for the transit of a planet in front of its star that will be used to assess the planet hypothesis (Sect. 4).
3. Photometric and imaging follow-up
Whenever transits are detected in a CoRoT LC and when the candidate survives the set of tests performed to rule out obvi-ous stellar systems (see Carpano et al, this volume) a ground based follow-up programme is initiated. The goal is to check fur-ther for possible contaminating eclipsing binaries (EBs) whose point spread function (PSF) could fall within the CoRoT photo-metric mask. In the specific case of CoRoT-7b with its shallow transits, we performed a rigorous complementary observational campaign to check all conceivable blend scenarios. These in-cluded i) a search for photometric variations on nearby stars dur-ing the assumed transit; ii) deep imagdur-ing, with good-to-high an-gular resolution, searching for the presence of fainter and closer contaminating stars; iii) spectroscopic observations of the tar-get at high resolution and high S/N; iv) infrared spectroscopy, searching for faint low-mass companions; v) examination of X-ray flux from putative close binary systems; and vi) RV measure-ments. In addition, we took advantage of CoRoT’s capability to provide colour information on transit events.
3.1. Time-series photometric followup
The CoRoT exoplanet channel has a large PSF. In the case of the CoRoT-7 target, the FWHM is 8.6 arcsec along the disper-sion axis and 6.0 arcsec perpendicular to it. Ninety-nine percent of the flux is extended over a larger and roughly ellispoidal area of 60 arcsec × 32 arcsec (Fig. 6 - left). This large area implies a significant probability that candidates detected in the CoRoT data arise from nearby background eclipsing binaries (BEBs). A photometric follow- up programme of CoRoT candidates in-tends to identify such BEBs, comparing observations during
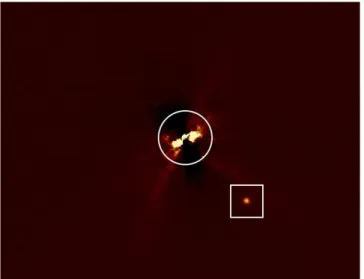
pre-Fig. 7: Final NACO image in J-band after substraction of a me-dian PSF and de-rotation of the field. The circles locate the three faint stars that are detected in the field, the two at east identified with those marked by arrows in Fig. 6. The scale is given by a line of 5 arcsec length, and the central circle of 0.5 arcsec radius gives an idea of the angular distance at which the presence of a faint star could not be detected close to CoRoT-7 . North is at top, and east to the left, as in Fig. 6.
dicted transit-times with observations out of transit. This follow-up programme, as well as the time- series follow-follow-up performed on CoRoT-7, are described in more detail in Deeg et al. (2009). Here we only give a summary.
For any catalogued nearby star around the CoRoT-7 target, we calculated the expected eclipse amplitude if this star was the source of the observed dips. Calculation of this amplitude is based on a model of the stellar PSF, the shape of the photomet-ric aperture, and the position and magnitudes of the target and the contaminating stars, respectively. Several stellar candidates for false alarms were identified that way, with expected eclipse amplitudes between 0.2 and 1 mag.
Observations to identify such alarms were then done on two telescopes: IAC-80 and CFHT. Images with the IAC-80 were taken on several occasions of the observed periodic loss of flux between February and April 2008; CFHT observations with MEGACAM (Boulade et al. 2003) were performed during the ingress of a transit on 7 March 2008. From both data sets, tometric LCs were extracted through classical differential pho-tometric techniques and the stars on- and off-transit brightness are compared. The observations from IAC-80 showed that none of the known contaminating stars could have been the source of an alarm, with all of them varying several times less than the amount required for a false positive. The CFHT time-series im-ages (Fig 6) also shows a faint contaminator of about V = 19.5 some 10 arcsec north of the target. However, this faint star would have to show strong variations of its brightness by a factor of 5 – 8 to become a false alarm source, something that can clearly be excluded. Follow-up from photometric time-series imaging therefore allowed any false alarm to be excluded from sources at distances over about 4 arcsec from the target.
Fig. 8: Central part of the NACO image, after a simulated star 6.5 magnitudes fainter than CoRoT-7 was added (within square). The circle of 400 mas radius defines the only region in which such a star could be confused with residual speckles.
3.2. High angular resolution imaging followup
The next step is to search for additional faint stars closer to the target that might be potential sources for false alarms. This test employs high-resolution imaging with three different kinds of observations: construction of the best image from the CFHT set, sharp short exposures images taken with FASTCAM at the 1.5m CST and finally adaptive optics imaging with NACO at VLT.
In the first case we made a sub-pixel recentring of all 100 MEGACAM images and took the median image. The result is shown in Fig. 6. Two very faint stars, invisible in single images, become apparent at angular distances of 4.5 and 5.5 arcsec from CoRoT-7 (indicated with arrows in Fig. 6). By adding simulated stars with known brightnesses at similar angular distances, we estimated them to be about 10 mag fainter than CoRoT-7, which is too faint to be potential alarms, even if they were to totally vanish during the transit.
FASTCAM is a lucky imaging camera (Oscoz et al. 2008). Here we only report on the deeper observations taken at the NOT, where 12,000 images, each with 50 ms exposure time, were ob-tained on 24 October 2008 in I band, with a pixel resolution of 32 mas. The best result was obtained from a selection of the best 10% of images followed by their centring and co-adding. Based on the absence of signals with an S/N higher than 5, the presence of relatively bright nearby objects with I ≤ 15 could be excluded beyond 0.18 arcsec, I ≤ 16 beyond 0.3 arcsec and I ≤ 17 beyond 0.8 arcsec. However, significantly fainter objects would not have been detected at any larger distance.
The VLT/NACO observations were performed thanks to dis-cretionary time granted by ESO (DDT 282.C-5015). A set of J-band images with a pixel size of 13 mas was taken at different an-gles of the NACO rotator (15ostep), in jitter mode. The images are recentred at sub-pixel level and median- stacked for each ro-tator angle. The median of these stacked images gives essentially the PSF of CoRoT-7, as all other objects in the field are removed by the median operation. Each stacked image is then substracted from this PSF and is de-rotated before a final median-stacked image is produced. This resulting image is shown in Fig. 7: it reveals 3 faint stars (circled) at distances of 4.9, 5.9 and 6.7 arc-sec, whereas no other star could be indentified between 0.5 and
5 arcsec. Clearly two of those stars are the counterpart of the two stars detected on the CFHT stacked image: the small difference in astrometry can be explained by our using of the average pixel size of Megacam, which is not constant throughout its very wide field of view. Photometry – cross-checked against added simu-lated stars – shows that the brightness difference between these stars and CoRoT-7 is ∆mJ= 8.1 – 8.4. If we take mJ(CoRoT-7)
= 10.3, this translates to mJ(faint stars) = 18.4 – 18.7. On aver-age, stars in the neighbourhood exhibit V-J = 1.7, so that, if we apply this reddening to the three faint stars we find : mV(faint stars) = 20.1 – 20.4. Indeed the true reddening of those three very faint stars is likely larger: either those stars are nearby low mass stars and thus are fairly red, or they are very distant and thus suffer a large interstellar extinction. Their brightness differ-ence to CoRoT-7 in V of ∆mV≈10, is thus consistent with what is found on the CFHT stacked image. Even if these stars undergo a 50 % decrease in brightness, they would produce only an am-plitude variation ∆F/F = 5 10−5in the CoRoT LC, i.e. much less than the observed value of 3.35 10−4. We conclude that none of the detected sources in the field around CoRoT-7could account for the dips in the CoRoT LC, even if it would vanish totally.
We now have to assess the probability of a contaminator still closer to the target. This case would correspond to a background of foreground system of a star and a transiting object (planet or star), the star having the same colours as CoRoT-7. For instance it could be a star instrinsically bluer than CoRoT-7 but distant enough to be both reddened and faint enough to provide the ob-served signal. In that case, the star should be at maximum 6.5 magnitudes fainter than CoRoT-7 in J, taking the reddening into account and assuming that its flux could be reduced by 50% at maximum to mimic a transit (case of a fully symmetric EB). To assess this case, we added on the NACO image a simulated star 6.5 magnitudes fainter than CoRoT-7 as shown in Fig. 8. The simulated star shows up clearly, brighter than any residual speckles farther than 400 mas from CoRoT-7. We can conclude that if it is a background binary system that mimics the observed transit on CoRoT-7 , it must be inside a circle of 400 mas radius, because at any other location it would have been seen. The prob-ability p that this is the case is simply the ratio of the surface of the 400 mas radius circle to the surface of the CoRoT mask: p = π 0.42/ 640 = 8 10−4. The additional condition of similar colours for the CoRoT-7 and the contaminant makes this prob-ability even lower, but, conservatively, we keep the preceding value3.
4. CoRoT colours
While the probability that there is a background star closer than 400 mas is low (< 810−4), the probability that CoRoT-7 is a triple system is significantly higher. A detailed study of stars by Tokovinin (2008) shows that at least 8% of the solar-type stars have three or more components.
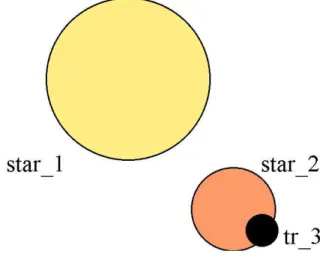
Illustrated in Fig. 9, the triple system could be a giant planet or a brown dwarf (tr 3) transiting in front of a fainter star (star 2)
3 An independent estimate of this probability of a false positive can
be made using CoRoTLux 2007 (Fressin et al. 2007). With that model, we computed the probability that a background eclipsing object is lo-cated at a distance 0.4 arcsec from a given CoRoT target, with an ampli-tude that produces an apparent transit depth lower than 5 10−4and with
an SNR above the CoRoT detection threshold (defined in Aigrain et al. 2009, this volume). We obtain an average of 4 10−4object in the
sim-ulation of the LRa01 field (≈104 stars) that exhibits such a small and
detectable transit, a probability compatible with the upper limit we find here.
Fig. 9: Scheme of a triple system that could mimic the transit of a small planet in front of the target star (star 1). Star 2 is a physically associated faint star and tr 3 a dark transiting object, e.g. a hot Jupiter or a brown dwarf.
Fig. 10: Distribution of the flux of a K0V star (proxy for CoRoT-7 , a G9V star) into the 3 channels, according to the measured relative intensities of the coloured fluxes in photo-electrons.
physically associated with the target star (star 1). Assuming that the transiting object has a Jupiter size radius, the spectral type of the secondary star can be estimated thanks to the required brightness differences between (star 1) and (star 2).
Using the Eddington’s approximation for the limb-darkening effect (Fig. 12), the maximum reduction of star 2 flux is (∆F2/F)max= 1.25[0.4 + 0.6(1 − z2)1/2](R3/R2)2,
where z is the impact parameter of the transit on star 2. Assuming a mean value for z = 0.5 (not necessarily that esti-mated in section 9), the maximum flux reduction as measured by CoRoT is
(∆F/F)max= 1.15(R3/R2(M))2F2(M)/[F1+ F2(M)],
where the radius and flux of star 2 are a function of its mass M. Assuming that the transiting object, either a hot Jupiter or a
Fig. 11: Expected distribution into the 3 colours of the flux drop,
∆F, if it was due to the eclipse of a M5V star. Frontiers between
colours are the same as in Fig. 10, but the stellar spectrum is dif-ferent. In that triple system, the flux drop would be significantly redder than observed.
Fig. 12: Limb darkening effect versus fractional radius of the star: superimposition of the Eddington’s classical law (black dash line) and of the predicted ones for a K0 star (best proxy in Claret’s tables for a G9V star) in filter V (blue line), R (green line), I (red line) and their mean value (thick green, in fact al-most coinciding with R). The data for the predicted laws are from Claret (2000), using Teff= 5250 K, log g = 4.5, M/H = 0.0.
brown dwarf, has a Jupiter radius, R3 = RJup, and using the
ra-dius and the flux of a mean sequence star (Drilling & Landolt 2000) for star 2, and the CoRoT measured (∆F/F)max =
3.5 10−4, the preceding relation can be solved as an equation in M. The found star spectral type is M5.1V, approximated as M5V. The assumption that the transiting object has a Neptune size would lead star 2 to be a K9V star. Now, such a star would
be redder than the target star 1, providing a criterion to qualify / falsify the hypothesis.
The details of the argumentation are explained in a dedicated paper (Bord´e et al, in preparation). Only the principles and the results are reported here. The bi-prism of CoRoT produces a mini-spectrum for each star, split by a proper selection of pixels into 3 spectral bands whose fluxes are recorded independently (Rouan et al. 2000; Auvergne 2006). The boundaries within the photometric mask that define these colours are chosen so that the red, green, and blue parts correspond, as much as possible, to given fractions of the total, but they must also correspond to an integer number of columns on the CCD (dispersion is done in rows). In the case of the G9V target star (star 1) that dominates the total flux, the actual fractions are 73.3%, 10.9%, and 15.8%, respectively, as indicated by the number of photoelectrons in the different channels (Fig. 10).
Assuming that the M5V star 2 is part of the triple system, it would be at an angular position so close to the target star that it would be indistinguishable with the CoRoT spatial resolution. The same boundaries on the CCD for defining the colours would then apply. This transiting star would lead to photoelectron con-tents in the 3 bands that are different from those of the target. They can be estimated from the spectrum of an M5V star (Fig. 11). The red fraction would increase to 94.9% and the green and blue decrease to 2.9% and 2.2%, respectively. These fractions correspond to the expected transit flux variations in that hypoth-esis, (∆F)Red, (∆F)Green, and (∆F)Blue.
If the r, g, b quantities are defined as
r = (∆F/F)Red (∆F/F)White, g = (∆F/F)Green (∆F/F)White and b = (∆F/F)Blue (∆F/F)White,
their expected and observed values can be compared. To work with a sufficient S/N, we bin 150 colour transit curves into 15 bins of 10 LCs each, calculate the r, g and b values, make the corresponding histograms and estimate the observed mean val-ues and standard deviations. The observed and expected valval-ues are
robs= 0.88 ± 0.18, rM5= 1.29; gobs= 1.24 ± 0.30, gM5= 0.27; bobs= 1.42 ± 0.41, bM5= 0.14.
We conclude that the observed colours are incompatible with those of a transit in front of an M5V star, whereas they are com-patible with a transit in front of the target star (rG9= gG9= bG9= 1)4. Another possibility could be that star 2 is a white dwarf with, by chance, the very temperature of the target star. With a proper luminosity ratio, this could be indistinguishable from a small planet in front of the target star, just from the colour crite-rion. However, this situation would produce a transit duration, 1 mn, much shorter than what is observed, because a white dwarf has a similar size to a terrestrial planet, not that of a main se-quence star. The white dwarf possibility is then discarded with-out ambiguity. We conclude that the observed LC is not produced
by a triple system where a Jupiter size object transits in front of a secondary star.
4 If a circular orbit is assumed, the mere duration of the transit
re-quires that the star undergoing the transit has a minimum size. The ob-served duration of the transit is a fraction f = 0.061 of the period. f also satisfies f ≤ (R2+ R3)/πa, the equality corresponding to an equatorial
transit. For a Jupiter-size transiting object, or smaller, this translates into R2>0.72 R⊙, corresponding to a star 2 earlier than K6V, if it is a main sequence star, a statement that is stronger than the one we derive but that needs the additional assumption of a circular orbit
5. Infrared spectroscopy
The reasoning of Sect. 4 can even tell more about the possible spectral types of star 2. The observed colours of the transit per-mit to restrict these to earlier types than M0V because later stars would produce ratios g < 0.55 and b < 0.45 that are not compat-ible with the observations (mean values ±2σ).
We can now conclude that the remaining possible star 2 that could still produce a false positive is rather bright. This could produce observable signatures in the target spectrum, particu-larly in the IR where the contrast between a G9V and M or K type star is lower, so we took these spectra of the CoRoT-7 star. Thanks to ESO DDT time (DDT 282.C-5015), we obtained a high-resolution spectrum of CoRoT-7 using the infrared spec-trograph CRIRES mounted on the VLT-UT1 (Antu). The AO-system was used along with a slit-width of 0.3 arcsec that re-sulted in spectral resolution of R = 60,000. The wavelength cov-erage was 2256 to 2303 nm, a region that included the CO- over-tone lines, which have an equivalent width about a factor of three larger in an M5V star than in a G9V star. The total integration time of 1800 s resulted in an S/N = 100 per resolution element. Standard IRAF routines were used for flat-fielding, sky subtrac-tion, and wavelength calibration. A spectrum of HD48497 taken with the same setup during the same night and at similar air mass was used to remove the telluric absorption lines.
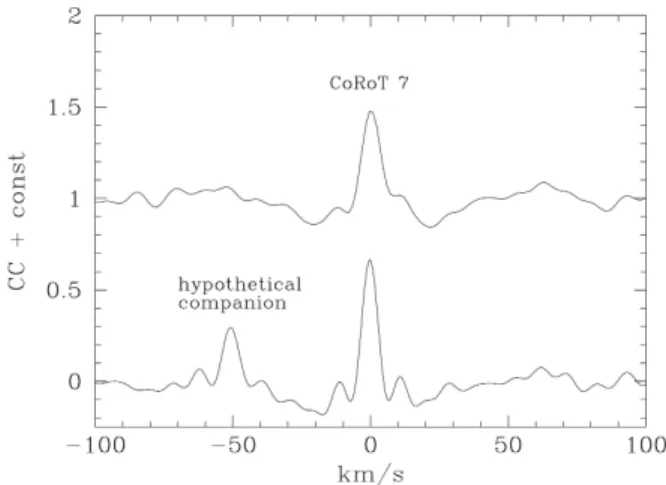
Figure 13 (top) shows the cross-correlation function of the CoRoT-7 spectrum with the theoretical spectrum of an M5V star. Since we could not find an M5V template in the ESO archives, we simply calculated the theoretical spectrum by using the spectrum of an M2V star and increased the strength of the CO lines to the strength of an M5V star. If there is an early M star associated to CoRoT-7, we would expect a secondary max-imum exhibiting a difference in RV with respect to CoRoT-7. This difference would be less than about 100 km/s, since a sys-tem with a shorter orbital period would not be stable. Figure 13 (bottom) shows the cross-correlation function when a putative M5V star at the same distance as CoRoT-7 and with an RV dif-ference of 50 km/s added. With this analysis, we conclude that, if the separation in RV of the two stars is greater than 8 km/s, the primary and secondary peaks would be well separated. If the separation was between 3 and 8 km/s, we would still detect an asymmetry of the cross-correlation function.
An independent analysis of the CRIRES spectrum using TODCOR (Zucker & Mazeh 1994) was able to exclude the pres-ence of an M star with a brightness as low as 7% of CoRoT-7, thus more than a factor of two lower than needed to rule out the presence of a bounded M-star. Such a secondary M star is clearly detected by TODCOR analysis when its spectrum is in-serted with a proper weight to a sunspot template, a proxy for an M-star.
Therefore, the CRIRES spectra can rule out the presence of a secondary star earlier than M5V within 0.3 arcsec (CRIRES slit width) from CoRoT-7 except if, by chance, observations were performed when star 1 and star 2 had the same RV within 3 km/s. Assuming that CoRoT-7 is a binary consisting of a G-star orbited by an M-star that has a eclipsing planet, then the prob-ability that we observe the system at the very moment of the conjunction so that the separation is less than 3 km/s is below 10−6.
Eventually, CoRoT colours allow us to exclude a secondary companion fainter (redder) than M0V, and CRIRES spectrum a companion brighter than M5V, but for a very special case whose probability is less than 10−6. As the exclusion intervals over-lap, we can conclude that the observed events are not due to an
associated star (star 2) subjected to a transit. The triple system hypothesis is essentially rejected.
Fig. 13: Top: cross correlation function between the CRIRES spectrum of CoRoT-7 and a synthetic spectrum of an M5V star. Bottom: same as above, but an M5V star spectrum with a shift in RV of -50 km/s was added to the CoRoT-7 spectrum. We conclude that there is no such companion.
6. Lack of X-ray emission
The case of a triple system made of the main target and two graz-ing eclipsgraz-ing binaries is already practically excluded by Sects. 4 and 5 and the U shape of the transit. An additional hint is pro-vided by the lack of X-ray emission. If CoRoT-7 were a triple system consisting of a G9V star and an eclipsing binary of late spectral type with an orbital period of ≈ 0.9 day, the binary would likely be detectable in the X-ray spectral domain. As a prototype object of this kind, we consider the eclipsing binary YY Gem consisting of two M1Ve stars with an orbital period of 0.85 days (Haisch et al. 1990; Stelzer et al. 2002). The bright-ness of YY Gem in the X-ray regime is 2 - 8 1029erg/s, and its distance is 15.8 ± 0.30 pc (Stelzer et al. 2002). Strassmeier et al. (1993) in their catalogue of chromospherically active binaries list at least 7 late-type stars (late G- to early M-type) with rota-tional (binary) periods of less than 1 day. All of these have X-ray luminosities in the range 0.3 – 0.9 × 1030 erg/s. Using the data obtained in the ROSAT all sky survey (Voges et al. 1999) in the 0.1 to 2 keV band, we searched for possible X-ray emission from hypothetical companions of CoRoT-7. With the lowest X-ray lu-minosity of such short-period binaries, we would have detected these companions of CoRoT-7at 4 σ level, if present. Using d(CoRoT-7) = 150 pc, we can state that LX(CoRoT-7)< 51028
erg/s, that is the level of the sky background above which one cannot find any evidence of a source at the location of the target.
7. Radial velocity campaign
We have obtained two measurements of CoRoT-7 with the spec-trograph SOPHIE (Bouchy & The Sophie Team 2006) at the 1.93m telescope in Observatoire de Haute Provence (France). The RV observations were conducted on 17 and 20 February 2008, just a few weeks after the early discovery of the transiting candidate and during the CoRoT observing run. RV follow-up
Table 3: SOPHIE RV observations of CoRoT-7.
Julian date Orb. RV 1σ error
day Phase km/s km/s
2454514.32514 0.19 31.1444 0.0095
2454517.40230 0.79 31.1392 0.0073
Fig. 14: SOPHIE RV measurements of CoRoT-7 obtained in February 2008, versus time. The two data points are shown with 1σ error bars. Superimposed are Keplerian orbital curves of a 0.854 day period planet at the CoRoT ephemeris, which are ex-cluded by the data at 1σ (dotted line) and 2σ (plain line). They correspond to semi-amplitudes of 6 and 15 m/s, or planetary masses of 8.5 and 21 MEarth. The systemic velocity V0is left as a free parameter in this simple fit. We conclude that the planet, if present, has a mass Mpl<21 MEarth at a 95 % confidence level.
observations were assigned high priority because of the shallow-ness of the transit. The SOPHIE RV measurements are given in Table 3 and shown in Figure 14. The two measurements were obtained on CoRoT dates 514.3 and 517.4 JD-2 454 000 (see Fig. 1), i.e., at a time when the photometric activity from the star is relatively low; consequently, they are not strongly affected by this variability. Quantitatively, the photometric difference mea-sured by CoRoT between the two SOPHIE observations is 0.2%, which is 10 times smaller than the largest variation in the to-tal CoRoT light curve, and twice smaller than the mean stan-dard deviation. The difference in RV between the two measure-ments is only 5 ± 10 m/s, although they were obtained at al-most extreme phases (0.19 and 0.79, when the transit occurs at phase=0). When fitting the systemic velocity and radial-velocity semi- amplitude of a circular orbit at the CoRoT ephemeris, we
can exclude a planetary mass higher than 21 MEarth at 2σ.
Due to the lack of detected RV signal at the level of 10 m/s (1 σ ), it was decided to observe CoRoT-7 with HARPS, which has a higher velocity accuracy, at the next observing season start-ing October 2008. More than 100 measurements were taken and the results will be described in another paper (Queloz et al., in preparation).
The following conclusions can be drawn from the RV SOPHIE measurements5:
5 It is interesting to note that we do not need this RV information
for-mally. The case of a grazing large object, e.g. a Jupiter or a late star, can
(i) there is no Jupiter mass planet or, a fortiori, a stellar companion, bound to CoRoT-7. A Jupiter mass object with a 0.854day period would produce a 230 m/s RV signal and a white dwarf companion an amplitude over 100 km/s. None of these are observed;
(ii) the data are compatible with a planet with a 0.854day period and a mass of less than 21 MEarth, provided that no other change
in the RV of the star occurs between these two observations (due to other companions or stellar activity). A formal detection and an accurate estimate of the mass is discussed in Queloz et al (in preparation).
As a result of Sects. 3 to 7, where we excluded almost all the cases of false positives, we conclude that a small planet orbits the star CoRoT-7 with a 0.854 day period, with a risk of false positives conservatively estimated to be < 8 10−4.
8. Stellar parameters
The central star was first spectroscopically observed in January 2008 with the AAOmega multi-object facility at the Anglo-Australian Observatory. By comparing the low-resolution (R/approx1300) AAOmega spectrum of the target with a grid of stellar templates, as described in Frasca et al. (2003) and Gandolfi et al. (2008), we derived the spectral type and lumi-nosity class of the star (G9 V). These observations allowed us to asses the dwarf nature of the target, rule out the false positive scenario of a low-mass star orbiting a giant star, and trigger fur-ther and systematic high-resolution spectroscopic follow-up of the system.
A preliminary photospheric analysis of the central star was carried out using a UVES spectra registered on October 2008 (Programme 081.C-0413(C)). The resolving power of this observation is ≃ 75,000 and the S/N is about 100 per resolution element at 5500Å. Later, we also took advantage of a series of 80 HARPS spectra acquired during the RV monitoring of the target. Even though the detailed analysis of those more recent specta is still in progress, the first results we achieved are in good agreement with those derived from the UVES spectrum analyses and are also presented in this paper.
Abundances
Using the VWA method (see Bruntt et al. 2008, and refer-ences therein) a preliminary abundance analysis was carried out from non-blended lines. The derived abundances calculated relative to the solar ones are given in Table 4. They indicate [M/H] = + 0.03 ± 0.06, i.e. solar-like. This spectral analysis also shows that CoRoT-7 is a slowly rotating main-sequence star late G main-sequence star with nearly solar- like abundances.
Mass, radius, and effective temperature
To determine the atmospheric parameters of the star, we used the same approaches as for the other CoRoT host stars (see Deleuil et al. 2008, e.g.), with different groups carrying inde-pendent analyses using different methods. The mass and radius of the star were determined from the photospheric parameters
be eliminated because the corresponding transit duration would be sig-nificantly shorter than observed. In the χ2map resulting from the transit
fit using the orbit inclination and planetary radius as free parameters, we find a minimum at the values given in Sect. 9 but no secondary minima that would correspond to larger inclinations and radii. For instance, a grazing Jupiter would give a 22 min long transit – assuming the limb darkening of Fig. 12 – which is excluded by the CoRoT observations.
Table 4: Abundances of 21 elements in Corot-Exo7, from VWA. Last column indicates the number of lines.
C i +0.11 ± 0.36 3 Na i +0.02 ± 0.08 4 Mg i +0.07 1 Al i +0.12 2 Si i +0.05 ± 0.04 21 Ca i +0.09 ± 0.05 7 Sc i −0.00 2 Sc ii +0.03 ± 0.05 5 Ti i +0.06 ± 0.04 36 Ti ii +0.00 ± 0.05 11 V i +0.17 ± 0.05 16 Cr i +0.04 ± 0.04 23 Cr ii −0.01 ± 0.04 3 Mn i −0.03 ± 0.05 10 Fe i +0.05 ± 0.04 250 Fe ii +0.04 ± 0.05 18 Co i +0.04 ± 0.05 15 Ni i +0.04 ± 0.04 62 Cu i −0.02 1 Zn i +0.01 1 Sr i +0.14 1 Y ii +0.09 ± 0.07 3 Zr i +0.01 1 Ce ii +0.22 1 Nd ii +0.04 ± 0.07 2
derived from our spectroscopic analysis combined with evolu-tionary tracks in the H-R diagram.
Recent studies have clearly demonstrated that the luminos-ity in transiting systems can be very well constrained by the LC fitting (Pont et al. 2007; Sozzetti et al. 2007). However, for CoRoT-7 the shallow transit and the stellar activity result in a large uncertainty on the stellar density and further on the planet radius, so we have abandoned it.
On the other hand, the Na i D and Mg i line wings in the spec-tra yield good consspec-traints on the measured log g value, ± 0.10, an accuracy already obtained by other authors, e.g. Sozzetti et al. (2007), so we used our spectroscopic estimate of the surface gravity (log g = 4.50) as a proxy for the luminosity.
The grid of the STAREVOL stellar evolution models (Siess 2006) was interpolated within the locus defined by the three ba-sic parameters (Teff, M⋆, R⋆) and their associated errors. The
resulting stellar parameters are reported in Table 5.
Table 5: CoRoT-7 parameters derived from RV and spectro-scopic analyses. vrad(km s−1) +31.174 ±0.0086 vrotsin i (km s−1) <3.5 Teff 5275K ±75 log g 4.50 ±0.10 [M/H] +0.03 ±0.06 Spectral Type G9 V M⋆ 0.93 ±0.03 R⋆ 0.87 ±0.04 MV 5.78 ±0.10 Age 1.2 - 2.3 Gyr Distance 150 pc ±20
We also use the available visible and near infrared photo-metric data to estimate the effective temperature independently.
The map of neutral hydrogen column density NH in the
galac-tic plane of Paresce (1984) indicates a maximum value of
NH = 1020 cm−2 for the line of sight of CoRoT-7 within 200
pc, which corresponds to E(B − V) ≈ 0.01 − 0.02 mag. The presence of a small amount of extinction in this direction is also confirmed by the maps of Lallement et al. (2003). Using Exodat (Deleuil et al. 2009) and 2MASS photometry, the Masana et al. (2006) calibration yields Teff= 5300 ± 70 K. This effective temperature from broad-band colours therefore agrees with the spectroscopic determination reported in Table 5.
Distance
For the distance estimate we have first converted the 2MASS magnitudes into the SAAO system with the relations of Carpenter (2001). The calculated colours J-H and H-K are 0.474 ± 0.030 and 0.046 ± 0.029, respectively. These colours are compatible with main sequence stars of spectral types between G8 and K2. Given the constraint on the spectroscopic measurement of Teff our best estimate of the spectral type is G9. Assuming for this spectral type an absolute magnitude of
MV = 5.8 ± 0.1 (Straizys & Kuriliene 1981) and extinction
as already reported, we obtain an estimation of the distance
d = 150 ± 20 pc.
Projected rotational velocity
The projected rotational velocity is determined by fitting several isolated lines in the HARPS spectrum with synthetic profiles. The synthetic spectra are convolved by the instrumental profile approximated by a Gaussian function (R = 115,000), and a broadening profile comprised of macroturbulence and rotation. Since macroturbulence and rotation are strongly coupled, the value of v sin i is somewhat uncertain. We therefore explored a grid of values for macroturbulence. The possible range for the macroturbulence is 0 – 3 km/s since higher values provide poor fits for all lines. For this range of increasing macrotubulence, the best fit of v sin i values decreases from 3.5 to 0 km/s. Our estimate is then v sin i < 3.5 km/s.
Age
The age estimate derived from the H-R diagram is poorly constrained. To overcome this limitation, we use different age in-dicators: Li i abundance, the Ca ii H and K chromospheric emis-sions (Noyes et al. 1984), and gyrochronology (Barnes 2007).
In the CoRoT-7 spectra, no Li i line is detected (Fig. 16), even in the co-added 53 HARPS exposures. This non-detection points to an older age than the 0.6 Gyr of the Hyades (Sestito & Randich 2005).
The activity of CoRoT-7 is apparent not only in the CoRoT light curve (Fig.1), but also in the broad photospheric Ca ii H & K absorption lines (Fig. 15), which vary with time. For each HARPS spectrum, following the prescription of Santos et al. (2000), we calculated the usual chromospheric flux index, log RHK, which measures the Ca ii H & K fluxes, converted to the Mount Wilson system, and corrected for the photospheric flux. Over the one-year period of our series of HARPS spectra, we estimated the mean stellar activity level to be log R HK = -4.601 ± 0.05, with an uncertainty estimated from the range of observed values. Using the relations in Wright et al. (2004), we derive a chromospheric age estimate of 1.4 ± 0.40 Gyr and a rotational period of 23 ± 3 days. We compared this chromo-spheric age estimate with the new activity-age relation given by Mamajek & Hillenbrand (2008) that yields an age of 2.0 ± 0.3 Gyr. Both values are consistent within the error bars.
Fig. 15: Ca ii H line emission as observed in the co-added
HARPS spectra of CoRoT-7 .
Fig. 16: Comparison of CoRoT-7 (black line, co-added HARPS spectra) and CoRoT-2b spectra (red line, UVES spectrum) in a spectral window centered on the Li i λ6707.8 doublet. While the CoRoT-2b spectra displays a strong Li i feature, only the nearby Fe i line at 6707.44Å is visible in the co-added HARPS spectra of our target.
A fourth age estimate could be done from the stellar rotation rate. The rotation-age relation is often presented as of limited in-terest; however, Barnes (2007) recently revised the method and proposes a procedure, called gyrochronology, which provides the age of a star as a function of its rotation period and colour. Using his formalism, we infer an age of 1.7 ± 0.3 Gyr using the rotational period of 23 days derived from the LC. These different diagnostics all agree. We thus adopt an age between 1.2 and 2.3 Gyr. The measured chromospheric activity, higher than the solar value, also points to the idea that CoRoT-7 is not an old, quiet star.
9. Planetary parameters
We derive the planetary parameters using the stellar parameters of the previous section and the information derived from the
CoRoT LC.
Fig. 17: Phase-folded LC of CoRoT-7b using the ephemeris given in Table 2, and combined in bins of ∼1.5 min. A fixed pe-riod (Table 6) has been used. The green line is the 4-parameter best-fit model, using Gim´enez (2006), but it leads to a stellar density in conflict with the one determined by spectroscopy. The red line corresponds to the finally adopted solution, leaving only inclination and planet radius as free parameters; the bottom panel shows the residuals of the fit. See the text for details.
Fig. 18: Contour of the chi2 of residuals in the space [relative planet radius, inclination], when a classical fit with 4 free pa-rameters is used, fixing the stellar mass and radius at the spec-troscopically determined values. Contours at 68%, 95%, and 99.7 % confidence level for parameter estimates are plotted (red, green, and purple contours). One notes the high degeneracy of the secure solutions (green and purple contours).
Semi-major axis
Applying Newton’s law and using estimates of M⋆and
R⋆from Sect. 8, we find
a = [M⋆(M⊙)P(yr)2]1/3= 0.0172 ± 0.0002 AU, a / R⋆= 4.27 ±
0.20.
The uncertainties are mainly caused by the stellar mass and ra-dius uncertainties, because the period is known to a high degree of accuracy.
Radius of the planet and inclination of the orbit.
Following the technique used for the other CoRoT discov-ered planets (Barge et al. 2008), all the observed transits are combined after a low-order polynomial (order 2 in this case) is
Fig. 19: Contour of the chi2 of residuals in the two-parameter space [relative planet radius, inclination], fixing the stellar mass and radius at the spectroscopically determined values. Contours at 68%, 95% and 99.7 % confidence level are plotted. There is no more degeneracy, so mean values and uncertainties of the fit can be derived. The uncertainties on the stellar parameters are not taken into account here.
fitted in the parts surrounding each transit and substracted. The period is fine-tuned by choosing the one that provides the short-est duration of the phase- folded transit. The individual measure-ments are combined in bins of 0.0012 in phase, corresponding to about 1.5 min, and the error assigned to each binned point is es-timated as the standard deviation of the points inside each bin, divided by the square root of the number of points .
We first used the formalism of Gim´enez (2006), combined with the AMOEBA minimization algorithm (Press et al. 1992) in order to obtain a first evaluation of the transit parameters. Because of the moderate S/N of the curve, we did not try to fit for the quadratic limb-darkening coefficients, but instead we fixed them to values corresponding to a G9V star (from Claret 2000, with u+ = ua+ ub = 0.6, u− = ua−ub = 0.2). The four
fitted variables were the centre of the transit, the ratio k=Rpl /
R⋆, the orbital inclination i, and the phase of transit ingress θ1, which can be translated into the scale of the system a/R⋆using
Eq. 12 of Gim´enez (2006). Figure 17 shows a fit of the transit as the thin green line. Under the assumption of a circular orbit, the scale of the system, a/R⋆=1.9± 0.1, can be translated into a
density of 0.17 g cm−3for the host star, a value much lower than expected for a G9V star (2.0 g cm−3). This apparent discrepancy probably arises from the transit ingress and egress appearing less steep than expected for a main sequence star. To investigate the origin of this problem, we divided the LC in 32 groups, and indi-vidually fitted each group of transits (containing between 4 and 5 transits each). The fitted inclinations in groups of transits is sys-tematically larger than the inclination obtained from the global phase-folded LC. The mean a/R⋆= 4.0 is significantly different
and the resulting density (1.6 g cm−3) agrees better with that of a G9V star.
Consequently, we assume that the global transit gives slightly degraded information on the actual ingress and ingress of the transit. This may result in large errors on the inferred stel-lar parameters, including the density, if we rely on the analysis with four free parameters. We consider two possible causes for this degradation.
The first one is transit timing variations (TTVs) – temporal shifts to the centre of each transit caused by the presence of addi-tional bodies in the system (Agol et al. 2005; Holman & Murray 2005). In fact, when each group of transit is shifted accord-ingly to the best-fitted center, and the combined transit is built, we obtain a shape with a steeper ingress/egress, thus alleviat-ing the discrepancy. However, the time scales of the putative TTVs and their amplitudes are not easily understood in terms of gravitational interactions with other bodies, due to the short distance between CoRoT-7b and its host star. We thus favour a second explanation in terms of the stellar activity. Several works (Pont et al. 2008; Alonso et al. 2009) have shown that the occul-tations of active regions and/or spots can induce apparent shifts of the transit centers that might erroneously be attributed to addi-tional bodies in planetary systems. Because the host star CoRoT-7 is clearly an active star, and because of the comparable sizes of the transiting object and the stellar spots, we suspect that this effect is important. Unfortunately, to verify this hypothesis, we would need photometry of individual transits with the same or-der of precision as the combined transit (54 ppm per 1.5 min data point), which will be difficult to achieve in the next few years.
These limitations mean that we are not able to obtain alto-gether precise stellar parameters and planetary parameters from the LC alone, as is the case for giant planets with a high S/N transit. The solution is too degenerate as illustrated by Fig. 18 where the contour map of chi2 is plotted in the [Rpl, inclination
] frame: clearly the range of possible solutions within the 2 σ contour is too broad to be useful; e.g. the resulting ranges for the planet radius and orbital inclination are Rpl ∈[1.4 – 2.3 REarth]
and i ∈ [60 – 90o], taking the uncertainty on R
⋆ into account and
with a 5% risk of error.
Instead, we rely on the spectroscopic analysis described in Sect. 7 and make the assumptions of a circular orbit and of a limb-darkening law following Claret (2000) quadratic approxi-mation. By forcing the stellar radius to be R⋆= 0.87±0.04 and
considering the phase-folded light curve of Fig. 2 (i.e. without any correction for putative TTVs), we looked for the best fit when leaving two free parameters: the radius of the planet and the inclination of the orbit. To assess the significance of the best fit and estimate uncertainties, we divided the light curve into five phase-folded subsets and computed the fitting parameters in each case. The mean and standard deviation were then computed for each of the derived parameters: planetary radius, transit duration, and inclination.
We obtain Rpl = 1.68 ± 0.09 REarth, T14 = 1.125± 0.05 h, and i = 80.1 ± 0.3o. The error bars are fully dominated by the uncertainties on the stellar parameters. The resulting transit curve (Fig. 17) can be compared to the observations. We must grant that the agreement is not fully satisfying, especially in the ingress, but we also note equivalent residual structures at phase values out of the transit that may indicate the effect of stellar activity, as previously stated.
From the previous analysis, the mean half-length of the tran-sit projected on the stellar disk, in stellar radius unit, is h = (π a τ / P)/ R⋆= 0.71 ± 0.06 , and the impact parameter is 0.70 ±
0.06. The final set of adopted planet parameters is summarised in Table 6.
10. Discussion
Table 6: Planetary parameters.
Parameter Value Uncertainty
Period (day) 0.853585 ±2.4 10−5 a (AU) 0.0172 ±2.9 10−4 a/R⋆ 4.27 ±0.20 T14(h) 1.125 ±0.05 impact parameter z 0.61 ±0.06 k = Rpl / R⋆ 0.0187 ±3 10−4 Rpl / REarth 1.68 ±0.09 Mpl/ MEarth <21 i (deg) 80.1 ±0.3
10.1. Tidal and centrifugal force effects
The star and the planet are exchanging strong tidal forces. Tidal forces influence the motion and the evolution the Corot-7 system. One consequence is the planetary spin-orbit coupling. According to Murray & Dermott (1999), the star raises tides on the planet that lead to the synchronization of the planetary rota-tion with its revolurota-tion, in a characteristic time τsynch
τsynch= |(n−Ωp| 3 2 M⋆ Mpl( Rpl a)3( GM⋆ a3 ) IQp k2p,
where n is the mean motion of the revolution rate of the planet,
Ωp the primordial rotation rate of the planet, I the normalized
moment of inertia of the planet, Qp the planetary dissipation
constant, and k2p the Love number of second order. Several of the stellar and planetary parameters have been determined in this work. Some planetary characteristics are unknown or poorly known, but can be estimated within reasonable ranges. The nor-malized moment of inertia I describes how the mass of a body is distributed in its interior. If the body is differentiated (a safe assumption for a body larger than 1000 km in size), the heavier materials are concentrated in the core and I < 0.4. The planets and even the large moons of the Solar System have 0.2 < I < 0.35. The solar terrestrial planets show values of the Love num-ber Qp/k2pbetween 30 and 1000 (Yoder 1995). The primordial planetary rotation rate Ωpis not known, of course, but using
val-ues for a fast rotator (10 hours) and a slow rotator (10 days) and using the estimated parameters in the ranges above yields a time constant τsynchin the range one year to decades.
As a consequence, regardless of the poorly known planetary parameters, the synchronization of the planetary rotation with its revolution is a fast and efficient process that has already been completed, given that the age of system age (1 – 2 Gyr) is much longer than τsynch. Although the planet has a telluric nature and
the planetary to stellar mass ratio is small, the decisive factor for the efficiency of tidal dissipation is the short distance to the star. The stability of the planetary orbit under the influence of tidal forces depends crucially on the ratio of the stellar dissipa-tion rate and the stellar Love number Q∗/k∗
2(Carone & P¨atzold 2007). The time scale for the decay of the planetary orbit from the currently observed distance toward the Roche zone of the star is (P¨atzold & Rauer 2002; P¨atzold et al. 2004)
τ = 2 13[a 12/3−a12/3 Roche]Q⋆ 3(Mpl/M⋆)R5⋆(GM⋆)1/2k2⋆,
with aRoche = 2.46R⋆ as the Roche radius of the star
(Chandrasekhar 1969). The dissipation constant and the Love number of a star are poorly known. Values for Q⋆/k2⋆ vary in wide ranges in the literature. Values from 105to 105.5(Lin et al. 1996; Jackson et al. 2008) would yield unrealistic small time scales of 70 Myr for the decay because it would be highly im-probable to observe this planet today. For Q⋆/k2⋆= 106to 106.5,
Fig. 20: Planetary radius as a function of mass for different com-positions of planets (Grasset et al. 2009). The curves [Fe], [ sil-icates], [ices], [H2-He] correspond to planets made of pure Fe, silicates, and metallic core (analogous to the Earth), pure wa-ter ice and pure H2-He gas, respectively. The shaded area cor-responds to planets with both silicates and water. The region between this area and the curves [H2-He] corresponds to plan-ets with a water-silicate core and a thick H2-He envelope, e.g. Uranus, Neptune or GJ 436. The red band corresponds to the present determination of the radius, Rpl = 1.68 ± 0.09 REarth,
and upper limit for the mass, Mpl< 21 MEarth. A purely iron
planet can be excluded.
the orbit would decay within 2 Gyr. The orbit may be consid-ered stable with respect to tidal forces for Q⋆/k2⋆ > 107. The latter limit has also been derived by Carone & P¨atzold (2007) for the case of OGLE-TR-56b and seems to fit observations bet-ter. These values were computed with the upper planetary mass limit of 21 Earth masses.
The shape of the planet is a triaxial Roche ellipsoid (Chandrasekhar 1969), distorted by the tidal and rotational po-tentials. The longest of the ellipsoid axes is directed towards the star while the shortest is directed along the rotation axis of the planet. In the case of an homogeneous distribution of mass, the equator prolateness (tidal bulge) of the Roche ellipsoid is given by (15/4)(M⋆/Mpl)(Rpl/a)3, and the polar flattening, referred to
the mean equatorial radius, by (25/8)(M⋆/Mpl)(Rpl/a)3. Using
the values given in Table 6 and Mpl<21 MEarth, we obtain an
equator prolateness < 0.016 and a polar flattening < 0.013. If the non-uniform distribution of masses in the interior of the planet is taken into account, the results are smaller. If we use the reduc-tion factor that corresponds to the Earth (≈ 0.78), the expected values are 0.0125 (≈ 1/80) for the polar flattening and 0.010 (≈ 1/100) for the tidal bulge. This means that the largest equator radius of the planet (high tide) is < 140 km larger than the short-est equator radius (low tide) and that the polar radius is <120 km smaller than the mean equatorial radius.
In any case, the corresponding stretching of the planet is small enough to be neglected in the estimate of its volume be-cause the corresponding uncertainty is less than on the radius determination from the transit and spectroscopy (± 570 km).


![Table 5: CoRoT-7 parameters derived from RV and spectro- spectro-scopic analyses. v rad (km s −1 ) +31.174 ± 0.0086 v rot sin i (km s −1 ) < 3.5 T eff 5275K ± 75 log g 4.50 ± 0.10 [M/H] +0.03 ± 0.06 Spectral Type G9 V M ⋆ 0.93 ± 0.03 R ⋆ 0.87 ± 0.04 M V](https://thumb-eu.123doks.com/thumbv2/123doknet/5821420.140660/11.918.183.322.129.511/table-corot-parameters-derived-spectro-spectro-analyses-spectral.webp)
