1
Association between school policies and built environment, and youth’s participation in various types of physical activities
ABSTRACT
BACKGROUND: School environmental characteristics may be associated with youth’s
participation in different types of physical activities (PA). This study aimed to identify which school policies and built environmental characteristics were associated with participation in organized, non-organized, individual and group-based activities.
METHODS: This cross-sectional analysis included 776 Grade 5 and 6 students from 16
schools. The school environment was assessed through school-based questionnaires completed by school representatives. Types of PA and attainment of PA recommendations were obtained using self-administered student questionnaires. Associations between environment and student PA were examined using multilevel logistic regressions.
RESULTS: Schools with favorable active commuting environments were positively
associated with girls’ participation in organized (OR=1.34, CI=1.04, 1.74) and group-based PA (OR=1.54, CI=1.19, 1.99) and with boys’ odds of participating in individual activities (OR=1.45, CI=1.04, 2.04). There was also a positive relationship between having a school environment favorable to active commuting and boys’ odds of meeting PA
recommendations (OR=2.19, CI=1.43, 3.37). School policies supporting PA were positively associated with girls’ odds of participating in non-organized activities (OR=1.18, CI=1.00, 1.40).
2
CONCLUSIONS: School environments which favor active commuting may encourage
participation in different types of PA. School policies promoting PA may also encourage girls to participate in organized activities.
3
Physical inactivity is the fourth leading risk factor for global mortality. 1 Although
many benefits of physical activity have been established, 2–4 only 7% of Canadian youth
accumulate the recommended 60 minutes of moderate-to-vigorous intensity physical activity per day. 5 Studies across North America and Europe have shown a significant
decrease in physical activity levels throughout adolescence, particularly between the ages of 10 and 15. 5–9 Given that inactive children often become inactive adults, 10 it is important
to identify factors associated with higher physical activity levels among youth to guide the development of effective interventions.
The rate at which physical activity levels decline during adolescence may differ by the type of activity in which adolescents participate. 11 It has been suggested that children
who participate in organized physical activities tend to be more physically active than children who engage in non-organized activities. 12 Also, children who participate in
individual activities may be more likely than those who participate in group activities to maintain participation throughout adolescence. 11 One study that followed 7,794 Dutch
14-year olds until they were 31 showed that participation in organized activities or sports after school hours was associated with higher levels of physical activity in adulthood. 13
Adults were also more likely to be active if they had participated in sports that required or encouraged a diversification of skills during adolescence. 13 The same study also found that
those who took part in physical activities that can be performed alone during adolescence generally reported more frequent participation in individual physical activities during adulthood. 13
4
Because children and adolescents spend about half of their waking hours at school
14 and accumulate up to 40% of their daily physical activity at school, 15 the school
environment has been identified as a key location for physical activity promotion. 2,4,14,16–23
Much research has been done to examine the environmental correlates of physical activity in youth, 24 many of which were found at the school level. 17 Schools’ physical and political
environmental factors that are associated with students’ physical activity include
playground facilities, 16,19,22,25–27 quality and length of physical education classes, 15 factors
that promote active transportation to school, 4,28 intramural and interscholastic sports and
activities, 17,23,29 and school policies. 19,30–32 Despite the many studies on the relationship
between school environment and general physical activity, no study has examined the environment in relation to participation in specific types of physical activity, such as participation in organized, non-organized, individual and group activities. Data on activity preferences suggest that boys prefer to participate in group activities while girls prefer individual activities. 6,33,34 Boys and girls may also respond differently to physical activity
opportunities, such as having low-cost recreational facilities 35 in their neighbourhood or
attending a school that offers active commuting programs. 36 Despite sex differences in
activity preferences, to our knowledge, no study has examined how the school environment influences types of physical activity by sex. This paper examines the association between schools’ physical and political environment and participation in organized, non-organized, individual and group-based physical activities among boys and girls, as well as their likelihood of meeting physical activity recommendations.
5
METHODS Participants
Data for this secondary analysis were obtained from the MATCH study (Measuring Activities of Teenagers to Comprehend their Habits), an ongoing prospective cohort study in New Brunswick, a bilingual Canadian province of approximately 756,000 residents. 37
For MATCH, a convenience sample of 19 schools was recruited. These were selected to include the provincial mix of French and English language, urban and rural areas and socioeconomic (SES) distributions. Two of the 19 schools were excluded because of the low return rate of consent forms. All Grade 5 and 6 students, aged 10-11, from the 17 schools were invited to participate in the study. This age group was chosen because it is the period during which physical activity levels are highest, and which precedes the marked decline in physical activity that often occurs in adolescence. 5 In total, 802 participants (51%
response proportion) were recruited in the fall of 2011. The MATCH study, which is described in more details elsewhere, 38 received approval from the Centre Hospitalier de
l’Université de Sherbrooke (Université de Sherbrooke Hospital Centre) ethics review board. All participants and a parent or guardian provided signed informed consent.
Procedure
Data collection began in the fall of the 2011-2012 school year and was repeated every four months in order to capture seasonal variation in physical activity. 39 At each
cycle, participants reported which activities they had practiced in the past four months. Data from cycles 1 through 3 were combined to represent one year of physical activity participation and eliminate seasonal variation. 39 Previous studies have shown this recall
6
period allows reliable measurement of adolescents’ activity. Participants answered questionnaires during class hours in the language of instruction of the school. The student questionnaire was developed in English. When validated French translations were not available, the English items were translated into French and back-translated using a standard protocol. 40,41 the pilot-test of the questionnaire amongst 12 Grade 5 and 6
students followed by interviews indicated that children easily understood and answered the questions included in this analysis. The questionnaire took 45 minutes to complete at the first cycle of data collection and less than 30 minutes to complete at subsequent visits. Participation proportion was similar at all three questionnaire cycles (93.21%, 93.08%, and 91.95%, respectively).
A questionnaire measuring the schools’ policies and built environments was completed in the spring of 2012. It was distributed to a designated school staff to be completed in consultation with other staff members. It took 20 minutes to complete and schools were given a month to respond. Answers were then validated on site by members of the research team.
Instruments
The attainment of the physical activity guideline of a total of 60 minutes of
moderate-to-vigorous physical activity on a daily basis was measured using a simple 2-item questionnaire developed for children (“Over the course of the past 7 days, how many days were you physically active for a total of at least 60 minutes per day?” and “Over the course of a typical or usual week, how many days are you physically active for a total of at least 60 minutes per day?”). 42 This questionnaire has demonstrated strong 2-week test-retest
7
reliability (ICC = 0.79) and correlated significantly with accelerometer data (r = 0.40). 42
Students were described as having met the physical activity recommendation if the mean of their responses to the two items was 7 days per week at each survey cycle (rounded values of ≥ 6.5).
Participants reported all free-time physical activity in the past four months using a list of 36 physical activities commonly engaged in by youth in Atlantic Canada. 43. This
questionnaire is similar to other physical activity checklists validated among youth. 44–46
Using response options including never, once per month or less, 2-3 times per month, once per week, 2-3 times per week, 4-5 times per week, almost every day, students reported how often (“Think about the activities that you have done outside of your gym class in the past 4 months. How often did you take part in the following activities?”) and with whom (alone, organized group or team, siblings, friends, parents) they most often practiced each activity. 47 Physical activities during physical education classes were excluded because
youth do not have control over the content or duration of these classes. Based on previous research, 47–53 activities were coded as organized or non-organized, and also as
group-based or individual. The four researchers responsible for these categorizations also took the nature of the activity and with whom participants engaged in the activity into
consideration. They then worked to consensus on the following categorizations: Seven of the 36 physical activities were categorized as non-organized, including trampoline, jump rope, games, home exercises, weight lifting, indoor and outdoor chores. Participation in the other 29 activities was categorized as non-organized if it was reported to be practiced usually alone, with friends, with siblings or with a parent. Participation in these activities
8
was categorized as organized if it was reported practiced most often with an organized group or team.
Similarly, 24 of the 36 physical activities were categorized as individual activities. These were defined as activities generally practiced individually or if competition results were based on the performance of one individual, such as ice skating, inline skating, skateboarding, bicycling, walking for exercise, track and field, jogging or running, golfing, swimming, gymnastics, aerobics or yoga or exercise classes, home exercises, weight training, badminton, tennis, kayaking or canoeing, trampoline, jump rope, downhill skiing or snowboarding, boxing or wrestling, karate or judo or tai chi or taekwondo, cross-country skiing, indoor and outdoor chores. The remaining 12 physical activities were categorized as individual activities if they were reported to be most often practiced alone; or group-based if they were practiced most often with siblings, parents, an organized group or team or with friends (see appendix).
The average frequency of participation in each of the four types of physical activities was computed using data collected in the three cycles. The four variables representing types of physical activities therefore take into account seasonal variations in the practice of the 36 physical activities over one year. For example, softball in the summer, football in the fall, and skiing in the winter. Students were described as having participated in organized, non-organized, group-based and individual physical activity categories (yes, no) if any activity pertaining to each category was reported at least once per week at each cycle.
The school questionnaire was based on the 2007-2008 School Health Environment Survey (SHES). 54 Of the items used, 79.4% had excellent stability (same response when
9
repeated after one week), and the other 20.6% had strong stability (similar response) in a previous study. 54 Exact agreement between questionnaire administration and
consensus-based response (from in depth interview) was observed for 75% of items, and 77.3% of items had excellent inter-rater reliability. 54 The school questionnaire consisted of 19
multi-item questions aimed at identifying the presence and availability of school-ground facilities (29 items), rules during recess (12 items), the availability of intramural activities (3 items), and interscholastic sports and activities (2 items), frequency and duration of physical education classes (2 items), promotion of active commuting (2 items), and policies related to physical activity at school (10 items). For each item, the least favorable option for promoting physical activity was scored 1, the most favorable option was scored 3, and the moderate options were scored 2. Scores were computed for each environmental
characteristic individually and the sum of all questionnaire items was combined to create a global environment variable.
Other variables included students’ age, primarily-spoken language and
socioeconomic status of the schools. The students’ birth date and age were obtained from the student questionnaire and primarily-spoken language of the schools was determined by the school district status (francophone or anglophone). Socioeconomic status was obtained using the socio-economic status of the region in which the schools are located. 55
Data Analysis
Overall, missing data occurred in 4.0% of the school questionnaire items. Given that school policies are generally governed at the district level, missing items related to school policies were imputed using the mode of scores of other schools in the same district. As for
10
the other missing items, scores for these items were generally similar across all other schools, so the mode was used to determine the values to impute. We conducted logistic regression models to estimate the association between components of the school
environment characteristics and participation in organized, non-organized, individual, and group-based physical activities. All analyses were conducted within a multi-level
framework to account for correlation at the school level. We sequentially computed models for each physical activity component starting with (1) the inclusion of environmental characteristic variables individually, followed by (2) adjusted models including all
environmental characteristics, except for policies, and (3) fully-adjusted models including variables on primary-language spoken (French or English), age and socioeconomic status. As these variables were included empirically, no automated variable selection approaches were used. 56 Separate models were computed for the variable representing policies
related to physical activity because most of the items used to create this variable were already included as part of the variables representing infrastructures, recess rules,
intramural and interscholastic activities and active commuting. Since girls and boys seem to prefer participating in different types of physical activities and because of the interest in identifying how the school environment was associated with the activity categories of each sex separately, the analyses were sex-specific. To avoid redundancy, and since partially-adjusted models including all environmental variables and fully partially-adjusted models (Steps 2 and 3 above) led to the same results, we only present the latter.
Secondary analyses were also conducted to test for relations between (1) physical education class duration, (2) physical education time spent in moderate-to-vigorous physical activity, (3) number of physical education classes offered per week, iv) number of
11
intramural, and (4) number of interscholastic activities offered in the course of the school year, and the types of physical activities practiced by boys and girls. All analyses were conducted using the R statistical software version 2.15.
RESULTS
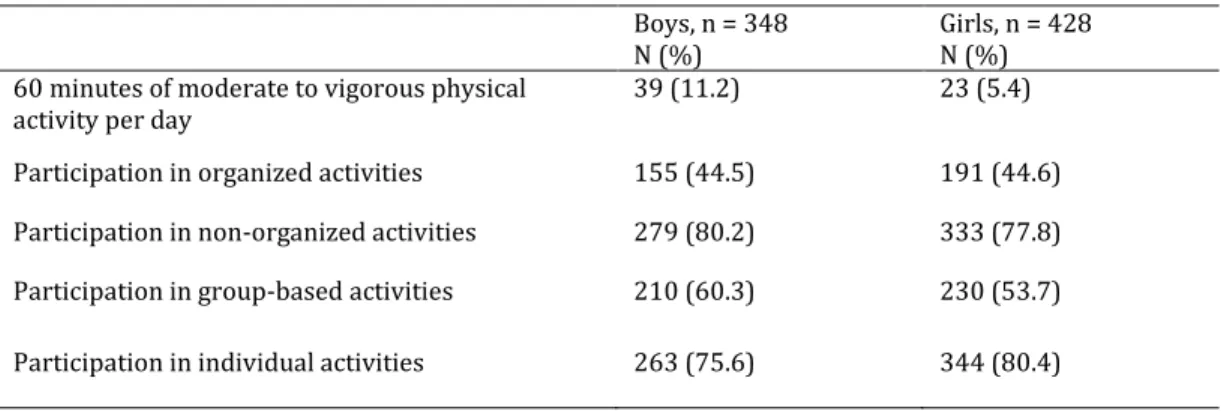
One school did not complete the school questionnaire leaving 16 schools and 776 participants for analyses. The average (standard deviation) age of participants in this study was 10.7 (0.6). Results showed that only 11.2% of boys and 5.4% of girls reported
accumulating 60 minutes of moderate-to-vigorous physical activity 7 days of the week at each survey cycle (Table 1). For both girls and boys, more students participated in non-organized than non-organized activities and also more participated in individual than in group activities.
There was considerable variability in all the school environment characteristics scores between schools (Table 2). Interscholastic sports and physical education variables had the largest variability in scores, as expressed in terms of relative range, while
variability was smallest for school policies.
When school environmental characteristics were analysed separately, scores relating to the global environment, presence of interscholastic sports, and physical education were positively associated with the odds of participating in individual physical activities among boys (Table 3). Scores representing opportunities for intramural activities and interscholastic sports were also positively associated with their odds of participating in non-organized physical activities. None of the environmental characteristics were significantly associated with boys’ odds of participating in organized or group-based
12
physical activities. Among girls, the score for physical education was negatively associated with the odds of participating in organized physical activities. None of the environmental characteristics were significantly associated with their participation in non-organized, group-based and individual physical activities.
Among girls, the fully adjusted models (Table 4) indicated that one additional unit of active commuting score was associated with 34% higher odds of participating in organized physical activities and 54% higher odds of participating in group-based physical activities. To put this in context of our data, girls attending the school with the highest score for active commuting characteristics (5) would have 2.4 times higher odds of participating in
organized activities than girls attending the school with the lowest active commuting score (2) (calculated on the basis that the OR is derived from exp(β), such that exp((5-2) x β) = OR of participating in organized activities). Girls also had 18% higher odds of participating in non-organized physical activities for each additional unit of policies score. Their odds of participating in individual activities were not associated with any of the school-level
environmental variables. An examination of the r2 for each model indicates that the various
policy and environmental variables accounted for 2 to 6% of the variance in likelihood of participating in any given type of physical activity (data not shown).
Among boys, none of the variables were associated with the odds of participating in organized, non-organized or group-based physical activities. Boys nevertheless had 45% higher odds of participating in individual physical activities for each additional unit of active commuting score.
13
Table 5 presents the odds of meeting physical activity guidelines as they relate to school environment characteristics in models where the variables representing
environmental characteristics were included separately and concurrently. In the fully adjusted model for boys, one additional unit of active commuting scores was associated with 2 times greater odds of meeting the physical activity recommendation. In this model, boys also had 14% lower odds of meeting the recommendation for each additional unit of infrastructure score. As for girls, none of the variables were associated with their odds of meeting the physical activity recommendation.
Secondary analyses showed no relationship between physical education class duration, time spent in moderate-to-vigorous physical activity during physical education, number of physical education classes per week, total number of intramural, and number of interscholastic activities, and types of physical activities practiced by either sex, nor with their odds of meeting the physical activity guidelines (data not shown).
DISCUSSION
Our results suggest that the most important school environmental characteristic for the promotion of several types of physical activity and for meeting physical activity
recommendations is one that favours active commuting. For girls, we found that a school environment favorable to active commuting was associated with a higher likelihood of participating in organized and group-based physical activities. In boys, it was associated with greater likelihood of participating in individual physical activities and achieving physical activity recommendations. These results are consistent with other studies
14
showing that school environments favorable to active commuting are associated with higher levels of physical activity. 36,57
In this study, a school environment favorable to active commuting was associated with the odds of achieving physical activity recommendations among boys, but not girls. Similarly, Mendoza et al found that boys were more likely than girls to increase their participation in moderate-to-vigorous physical activity in the presence of environments supportive of active commuting. 36 In boys, school environments more favorable to active
commuting were positively associated with individual activities. Based on previous data showing that boys are more likely than girls to walk and cycle to and from school, 58 our
results may indicate that boys are more responsive than girls to favorable active
commuting environments. Paradoxically, although the non-organized and individual-based activities of walking and cycling are those characterising active transportation, we found that favorable active commuting environments were associated with girls’ participation in organized and group-based activities. It is possible that schools which promote active commuting also promote organized and group-based activities. Since girls tend to engage in relatively more school clubs and government activities than boys, 59 it is possible that
girls participate more in school-based organized physical activities in the presence of school environments favouring active commuting, while such characteristics are not associated with participation in non-school-based organized physical activities among boys.
Our finding that school environments favorable to active commuting were
15
odds of attaining physical activity recommendations could be due to the differences in criteria used for classifying students into types of activity and whether or not they met physical activity recommendations. It is possible that an environment favorable to active commuting relates to an increase in physical activity, but not to the extent that it would change the proportion of girls attaining the recommended amount of physical activity. Based on the prevalence of attainment of physical activity recommendations, this criterion appears difficult to achieve, particularly among girls who are nearly half as likely as boys to be considered as sufficiently physically active. 5
Our study showed that policies encouraging physical activity were positively associated with girls’ odds of participating in non-organized physical activities. This could possibly be explained by the possibility that schools making an effort to promote physical activity through policies are also generally more favorable to physical activity. In addition, policies tend not to be sport-specific, suggesting that non-organized physical activity may be relatively more affected than organized activities by school policies. We also noted that policies were associated with the types of physical activities practiced by girls, but not boys. This result may be explained by the finding that girls are more likely than boys to follow rules at school, 60 therefore being more influenced by policies than boys.
Contrary to expectations, the availability of sports and exercise facilities and equipment were negatively associated with the odds of meeting the physical activity recommendations among boys. Most studies that have explored the relationship between facilities and physical activity have found positive associations. 16,25–27,61,62 However, the
16
fully adjusted model which also included active commuting. Since an active commuting environment was strongly associated with boys’ odds of meeting the physical activity recommendations, it is likely that the explanatory factor of this and maybe other variables was reduced because of the shared variance explained by the different environmental characteristic variables. 63
Despite what has been demonstrated in previous studies relating to the school environment and physical activity levels, 16,61,62,64 our study did not find any association
between presence and accessibility of facilities, recess rules, intramural activities,
interscholastic sports, and physical education classes, and participation in different types of physical activities. It is possible that our measure of physical education, intramural
activities and interscholastic sports may not have been as strong a measure as the other environmental characteristics. However, secondary analyses did not show any positive relationship between these variables and children’s participation in various types of physical activities. Other studies have also failed to show significant associations between certain variables of the school environment and students’ physical activity levels. 19,20,23
Limitations
This study had several strengths including the inclusion of three cycles of data collection, which appropriately represented physical activities practiced in a one year period. Limitations included reliance on self-reported measures for participation in various physical activities and for attainment of physical activity recommendations. However, data suggest that repeated use of a questionnaire, as we did in this study, provides a valid estimation of involvement in physical activity. 65 Moreover, objective data would not have
17
enabled the investigation of different types of physical activity. Another limitation was that the school questionnaire was not completed by the same type of staff member in all
schools. However, in addition to possessing very good validity and reliability properties, 54
the school questionnaires were reviewed and validated by the research group during school visits. Although the number of schools was small, they included various
sociodemographic characteristics of New Brunswick in terms of language, socio-economic status and urban-rural divide and considerable variation was present in the scores
representing all environment characteristics. Other studies with similar numbers of schools also showed significant associations. 26,27 Finally, the cross-sectional nature of the
analyses limits the assessment of causal relationships.
Conclusions
These results provide insight on how different characteristics of the school environment may be associated with participation in different types of physical activity. We have shown that environments which favour active commuting were associated with a higher likelihood of participation in different types of physical activities among boys and girls, and that physical activity supporting school policies were associated with higher participation in non-organized physical activities among girls. Our results will inform future studies designed to identify the types of environmental interventions that
potentially improve participation of young students in different types of physical activities.
IMPLICATIONS FOR SCHOOL HEALTH
Results from our study suggest that making a school environment more favorable to active commuting may be associated with increasing girls’ participation in organized and
18
group-based physical activities as well as boys’ participation in individual physical
activities. Promoting physical activity through school policies could also be an interesting way of encouraging girls to participate in non-organized physical activities. Schools and school boards could work together to implement active commuting programs, such as “Walking school bus” programs, active transportation days, and modify policies or create infrastructures that promote active commuting to school, such as allowing skateboards on school premises, offering bike racks so that adolescents can safely lock their bicycles in front of the school, and ensuring that crossing guards are present at pedestrian crossings. School nurses could also play an important role in promoting safe active commuting to school, by advocating the importance of wearing helmets and ensuring that youth
understand the rules of the road. Future studies should seek to evaluate such approaches through experimental or quasi-experimental studies.
Human Subjects’ Approval Statement
The study received approval from the Research Ethics Review Board of the Université de Sherbrooke Hospital Centre.
ACKNOWLEDGEMENTS
The MATCH study is funded through the Social Sciences and Humanities Research Council and Sport Canada joint Sport Participation Research Initiative.
19
REFERENCES
1. World Health Organization (WHO). Global Health Risks: Mortality and Burden of Disease Attributable to Selected Major Risks. Geneva, Switzerland: World Health Organization; 2009.
2. Strong WB, Malina RM, Blimkie CJ, Daniels SR, Dishman RK, Gutin B, et al. Evidence based physical activity for school-age youth. J Pediatr. 2005;146(6):732–737. 3. Janssen I, Leblanc AG. Systematic review of the health benefits of physical activity
and fitness in school-aged children and youth. Int J Behav Nutr Phys Act. 2010;7:40– 55.
4. Davison KK, Lawson CT. Do attributes in the physical environment influence children’s physical activity? A review of the literature. Int J Behav Nutr Phys Act. 2006;3:19–35.
5. Colley RC, Garriquet D, Janssen I, Craig CL, Clarke J, Tremblay MS. Physical activity of Canadian children and youth: accelerometer results from the 2007 to 2009 Canadian Health Measures Survey. Health Rep. 2011; 22:15–23.
6. Aaron DJ, Storti KL, Robertson RJ, Kriska AM, LaPorte RE. Longitudinal study of the number and choice of leisure time physical activities from mid to late adolescence: implications for school curricula and community recreation programs. Arch Pediatr Adolesc Med. 2002;156(11):1075–1080.
7. Fjørtoft I, Löfman O, Halvorsen Thorén K. Schoolyard physical activity in 14-year-old adolescents assessed by mobile GPS and heart rate monitoring analysed by GIS. Scand J Public Health. 2010;38(5 Suppl):28–37.
8. Nader PR, Bradley RH, Houts RM, McRitchie SL, O'Brien M. Moderate-to-vigorous physical activity from ages 9 to 15 years. JAMA. 2008; 300(3):295–305.
9. Riddoch CJ, Bo Andersen L, Wedderkopp N, Harro M, Klasson-Heggebø, Sardinha LB, et al. Physical activity levels and patterns of 9- and 15-yr-old European children. Med Sci Sports Exerc. 2004;36(1):86–92.
10. Hallal PC, Victora CG, Azevedo MR, Wells JC. Adolescent physical activity and health: a systematic review. Sports Med. 2006;36(12):1019–1030.
11. Bélanger M, Gray-Donald K, O’Loughlin J, Paradis G, Hanley J. When adolescents drop the ball: sustainability of physical activity in youth. Am J Prev Med. 2009;37(1):41–49. 12. Bélanger M, Gray-Donald K, O'Loughlin J, Paradis G, Hutcheon J, Maximova K, et al.
Participation in organised sports does not slow declines in physical activity during adolescence. Int J Behav Nutr Phys Act. 2009;6:22–27.
20
13. Tammelin T, Näyhä S, Hills AP, Järvelin M. Adolescent participation in sports and adult physical activity. Am J Prev Med. 2003;24(1):22-28.
14. Naylor PJ, McKay HA. Prevention in the first place: schools a setting for action on physical inactivity. Br J Sports Med. 2009;43(1):10–13.
15. Hobin EP, Leatherdale ST, Manske SR, Robertson-Wilson J. A multilevel examination of school and student characteristics associated with moderate and high levels of physical activity among elementary school students (Ontario, Canada). Can J Public Health. 2010;101(6):495–499.
16. Haug E, Torsheim T, Samdal O. Physical environmental characteristics and individual interests as correlates of physical activity in Norwegian secondary schools: the health behaviour in school-aged children study. Int J Behav Nutr Phys Act. 2008;5:47-56.
17. Wechsler H, Devereaux R, Davis M, Collins J. Using the school environment to promote physical activity and healthy eating. Prev Med. 2000;31(2):S121–S137. 18. Ridgers ND, Stratton G, Fairclough SJ. Physical activity levels of children during
school playtime. Sport Med. 2006;36(4):359–371.
19. Durant N, Harris SK, Doyle S, Person S, Saelens BE, Kerr, J, et al. Relation of school environment and policy to adolescent physical activity. J Sch Health. 2009;79(4):153-159.
20. Van Sluijs EM, Jones NR, Jones AP, Sharp SJ, Harrison F, Griffin SJ. School-level correlates of physical activity intensity in 10-year-old children. Int J Pediatr Obes. 2011;6(2-2):e574–581.
21. Gomes TN, dos Santos FK, Zhu W, Eisenmann J, Maia J. Multilevel analyses of school and children’s characteristics associated with physical activity. J Sch Health.
2014;84(10):668–676.
22. Hood NE, Colabianchi N, Terry-McElrath YM, O’Malley PM, Johnston LD. Physical activity breaks and facilities in US secondary schools. J Sch Heal. 2014;84(11):697– 705.
23. Fuller D, Sabiston C, Karp I, Barnett T, O’Loughlin J. School sport opportunities influence physical activity in secondary school and beyond. J Sch Health. 2011;81(8):449–454.
24. Ferreira I, van der Horst K, Wendel-Vos W, Kremers S, van Lenthe FJ, Brug J. Environmental correlates of physical activity in youth - a review and update. Obes Rev. 2007;8(2):129–154.
21
25. Fernandes M, Sturm R. Facility provision in elementary schools: correlates with physical education, recess, and obesity. Prev Med.2010;50 Suppl 1:S30–35.
26. Tucker P, Irwin JD, Gilliland J, He M, Larsen K, Hess P. Environmental influences on physical activity levels in youth. Health Place. 2009;15(1):357–363.
27. Willenberg LJ, Ashbolt R, Holland D, Gibbs L, MacDougall C, Garrard J, et al. Increasing school playground physical activity: a mixed methods study combining
environmental measures and children’s perspectives. J Sci Med Sport. 2010;13(2):210–216.
28. Pont K, Ziviani J, Wadley D, Bennett S, Abbott R. Environmental correlates of children’s active transportation: a systematic literature review. Health Place. 2009;15(3):827–840.
29. Bocarro JN, Kanters MA, Cerin E, Floyd MF, Casper JM, Suau LJ, et al. School sport policy and school-based physical activity environments and their association with observed physical activity in middle school children. Health Place. 2012;18(1):31–38. 30. Fitzgerald E, Bunde-Birouste A, Webster E. Through the eyes of children: engaging
primary school-aged children in creating supportive school environments for physical activity and nutrition. Health. Promot J Austr. 2009;20(2):127–132. 31. Pate RR, Trilk JL, Byun W, Wang J. Policies to increase physical activity in children
and youth. J Exerc Sci Fit. 2011;9(1):1–14.
32. Taylor RW, Farmer VL, Cameron SL, Meredith-Jones K, Williams SM, Mann JI. School playgrounds and physical activity policies as predictors of school and home time activity. Int J Behav Nutr Phys Act. 2011;8:38–44.
33. Sallis JF, Zakarian JM, Hovell MF, Hofstetter CR. Ethnic, socioeconomic, and sex differences in physical activity among adolescents. J Clin Epidemiol. 1996;49(2):125– 134.
34. Hovell MF, Sallis JF, Kolody B, McKenzie TL. Children’s physical activity choices: a developmental analysis of gender, intensity levels, and time. Pediatr Exerc Sci. 1999;11:158–168.
35. Santos MP, Page AS, Cooper AR, Ribeiro JC, Mota J. Perceptions of the built
environment in relation to physical activity in Portuguese adolescents. Health Place. 2009;15(2):548–552.
36. Mendoza JA, Watson K, Baranowski T, Nicklas TA, Uscanga DK, Hanfling MJ. The walking school bus and children’s physical activity: a pilot cluster randomized controlled trial. Pediatrics. 2011;128(3):e537–544.
22
37. Statistics Canada. Table 051-0001 - Estimates of Population, by Age Group and Sex for July 1, Canada, Provinces and Territories, Annual (Persons Unless Otherwise Noted), CANSIM (Database). Available at:
http://www5.statcan.gc.ca/cansim/pick-choisir?lang=eng&p2=33&id=0510001. Accessed February 18, 2013.
38. Bélanger M, Caissie I, Beauchamp J, O'Loughlin J, Sabiston C, Mancuso M. Monitoring activities of teenagers to comprehend their habits: study protocol for a mixed-methods cohort study. BMC Public Health. 2013;13:649–654.
39. Bélanger M, Gray-Donald K, O’Loughlin J, Paradis G, Hanley J. Influence of weather conditions and season on physical activity in adolescents. Ann Epidemiol.
2009;19(3):180–186.
40. Brislin R. Back-translation for cross-cultural research. J Cross Cult Psychol. 1970;1(3):185–216.
41. Chapman DW, Carter JF. Translation procedures for the cross cultural use of measurement instruments. Educ Eval Policy Anal. 1979;1(3):71–76.
42. Prochaska JJ, Sallis JF, Long B. A physical activity screening measure for use with adolescents in primary care. Arch Pediatr Adolesc Med. 2001;155(5):554–559. 43. Craig CL, Cameron C, Russell SJ, Beaulieu A. Increasing Physical Activity: Building a
Supportive Recreation and Sport System. Ottawa, ON: Canadian Fitness and Lifestyle Research Institute; 2001.
44. Crocker PR, Bailey DA, Faulkner RA, Kowalski KC, McGrath R. Measuring general levels of physical activity: preliminary evidence for the Physical Activity
Questionnaire for Older Children. Med Sci Sports Exerc. 1997;29(10):1344–1349. 45. Janz KF, Lutuchy EM, Wenthe P, Levy SM. Measuring activity in children and
adolescents using self-report: PAQ-C and PAQ-A. Med Sci Sports Exerc. 2008;40(4):767–772.
46. Sallis JF, Condon SA, Goggin KJ, Roby JJ, Kolody B, Alcaraz JE. The development of self-administered physical activity surveys for 4th grade students. Res Q Exerc Sport. 1993;64(1):25-31.
47. Pate RR, Sallis JF, Ward DS, Stevens J, Dowda M, Welk GJ, et al. Age-related changes in types and contexts of physical activity in middle school girls. Am J Prev Med.
2010;39(5):433–439.
48. Aarnio M, Winter T, Peltonen J, Kujala UM, Kaprio J. Stability of leisure-time physical activity during adolescence: a longitudinal study among 16, 17 and 18 year old Finnish youth. Scand J Med Sci Sports. 2002;12(3):179–185.
23
49. Erwin HE. Middle school students’ leisure activity engagement: implications for park and recreation administrators. J Park Recreat Admi. 2008;26(3)59–74.
50. Findlay LC, Garner RE, Kohen DE. Patterns of children’s participation in unorganized physical activity. Res Q Exerc Sport. 2010;81(2):133-142.
51. Kjønniksen L, Torsheim T, Wold B. Tracking of leisure-time physical activity during adolescence and young adulthood: a 10-year longitudinal study. Int J Behav Nutr Phys Act. 2008;5:69-79.
52. Lunn PD. The sports and exercise life-course: a survival analysis of recall data from Ireland. Soc Sci Med. 2010;70(5):711–719.
53. Taylor WC, Blair SN, Cummings SS, Wun CC, Malina RM. Childhood and adolescent physical activity patterns and adult physical activity. Med Sci Sports Exerc.
1999;31(1):118–123.
54. Manske S. In: Pilot Phase of the 2007-2008 School Health Environment Survey:
Technical Report. Edited by Centre for Behavioral Research and Program Evaluation. Waterloo, ON: University of Waterloo; 2008.
55. The Atlas of Canada. Atlas of Canada. Available at:
http://atlas.nrcan.gc.ca/auth/english/maps/peopleandsociety/QOL/eco_qoluc_p. Accessed September 24, 2012.
56. Greenland S. Modeling and variable selection in epidemiologic analysis. Am J Public Health. 1989;79(3):340–349.
57. Heelan KA, Abbey BM, Donnelly JE, Mayo MS, Welk GJ. Evaluation of a walking school bus for promoting physical activity in youth. J Phys Act Health. 2009;6(5):560–567. 58. Evenson KR, Huston SL, McMillen BJ, Bors P, Ward DS. Statewide prevalence and
correlates of walking and bicycling to school. Arch Pediatr Adolesc Med. 2003;157(9):887–892.
59. Gurian M, Carter P. Boys and Girls Learn Differentlly!: A Guide for Teachers and Parents. San Fransisco, CA: Jossey-Bass; 2002.
60. Lind A, Brzuzy S. Battleground: Women, Gender and Sexuality. Santa Barbara, CA: Greenwood Publishing Group; 2008.
61. Ridgers ND, Stratton G, Fairclough SJ, Twisk JW. Long-term effects of a playground markings and physical structures on children’s recess physical activity levels. Prev Med. 2007;44(5):393–397.
24
62. Huberty J, Siahpush M, Beighle A, Fuhrmeister E, Silva P, Welk G. Ready for recess: a pilot study to increase physical activity in elementary school children. J Sch Health. 2011;81(5):251–257.
63. Nathans LL, Oswald FI, Nimon K. Interpreting multiple linear regression : a guidebook of variable importance. PARE. 2012;17(9):1-19.
64. Sallis JF, Conway TL, Prochaska JJ, McKenzie TL, Marshall SJ, Brown M. The
association of school environments with youth physical activity. Am J Public Health. 2001;91(4):618-620.
65. Levin S, Jacobs DR Jr, Ainsworth BE, Richardson MT, Leon AS. Intraindividual
25
TABLES
Table 1: Study Participants’ Involvement in Different Types of Physical Activity (N=776)
Boys, n = 348
N (%) Girls, n = 428 N (%) 60 minutes of moderate to vigorous physical
activity per day 39 (11.2) 23 (5.4)
Participation in organized activities 155 (44.5) 191 (44.6) Participation in non-organized activities 279 (80.2) 333 (77.8) Participation in group-based activities 210 (60.3) 230 (53.7) Participation in individual activities 263 (75.6) 344 (80.4)
26 Table 2: School Scores for Each Environment Characteristics Variable (N= 16)
Environment characteristics variables Possible range of score (pts) Average of
scores (pts) Observed range of scores (minimum– maximum) Relative range (%) Global Environment 53-159 99.3 80 – 123.5 41.0 Facilities 29-87 50.2 39 – 68 50.0 Recess rules 12-36 25.5 19 – 32 54.2 Intramural activities 3-9 7.1 5 – 9 66.7 Interscholastic sports 2-6 5.2 2 – 6 100.0 Physical education 2-6 3.6 2 – 6 100.0 Active commuting 2-6 3.4 2 – 5 75.0 Policies 10-30 19.1 16 – 22 30.0
27 Table 3 : Odds Ratios and 95% Confidence Intervals of Participation in Different Types of Physical Activity for Different Environmental Characteristics in Unadjusted Multilevel Analyses (N=776)
Environment characteristics variables (range)
Organized activities Non-organized activities Group-based activities Individual activities
Girls Boys Girls Boys Girls Boys Girls Boys
OR CI OR CI OR CI OR CI OR CI OR CI OR CI OR CI Global Environment (53 – 150 pts) 0.99 0.97, 1.02 0.99 0.97, 1.01 1.01 0.99, 1.04 1.01 1.03 0.99, 1.00 0.98, 1.02 1.00 0.98, 1.01 1.01 0.99, 1.04 1.01* 1.00, 1.03 Facilities (29 – 87 pts) 1.00 0.96, 1.04 0.99 0.96, 1.02 1.01 0.97, 1.05 0.99 0.96, 1.01 1.00 0.96, 1.03 1.00 0.98, 1.02 1.01 0.97, 1.05 1.01 0.98, 1.04 Recess rules (12 – 36 pts) 0.98 0.93, 1.06 0.95 0.89, 1.02 1.06 0.98, 1.15 0.92 1.00 0.85, 1.01 0.93, 1.09 0.96 0.89, 1.02 1.03 0.95, 1.12 1.00 0.91, 1.08 Intramural activities (3 – 9 pts) 0.89 0.71, 1.12 1.07 0.88, 1.31 1.09 0.87, 1.36 1.32* 1.68 1.04, 0.89 0.72, 1.09 1.05 0.85, 1.30 1.11 0.88, 1.39 1.22 0.97, 1.54 Interscolastic sports (2– 6 pts) 0.88 0.71, 1.10 1.02 0.85, 1.22 1.15 0.94, 1.41 1.29* 1.58 1.06, 0.99 0.81, 1.22 0.96 0.79, 1.17 1.18 0.96, 1.44 1.23* 1.00, 1.50 Physical education (2 – 6 pts) 0.74* 0.58, 0.95 0.90 0.73, 1.11 1.05 0.80, 1.37 1.20 1.58 0.90, 0.85 0.67, 1.09 0.87 0.70, 1.09 1.11 0.85, 1.46 1.31* 1.02, 1.68 Active commuting (2 – 6 pts) 1.01 0.80, 1.32 0.91 0.75, 1.11 1.19 0.96, 1.48 1.18 1.56 0.89, 1.14 0.91, 1.43 1.02 0.82, 1.26 1.11 0.87, 1.41 1.32 0.80, 1.29 Policies ( 10 – 30 pts) 1.01 0.85, 1.18 0.93 0.81, 1.06 1.10 0.93, 1.29 0.99 1.20 0.82, 1.10 0.94, 1.26 1.01 0.88, 1.17 1.01 0.86, 1.20 1.04 0.88, 1.24 *p < .05
28
Table 4: Odds Ratios and 95% Confidence Intervals of Participation in Different Types of Physical Activity for Different Environmental Characteristics in Fully Adjusted Multilevel Analyses (N=776)†
Environment characteristics variables (range)
Organized activities Non-organized activities Group-based activities Individual activities
Girls Boys Girls Boys Girls Boys Girls Boys
OR CI OR CI OR CI OR CI OR CI OR CI OR CI OR CI Environment ( 53 – 150 pts) 0.99 0.97, 1.01 0.98 0.95, 1.00 1.02 0.99, 1.04 0.99 1.02 0.97, 1.00 0.97, 1.02 1.00 0.97, 1.02 1.02 0.99 1.05 1.02 0.99, 1.05 Facilities (29 – 87 pts) 0.97 0.92, 1.02 0.99 0.93, 1.04 1.01 0.95, 1.08 0.96 1.03 0.90, 0.97 0.92, 1.02 1.03 0.97, 1.10 1.02 0.96, 1.08 0.98 0.92, 1.05 Recess rules (12 – 36 pts) 1.01 0.93, 1.09 0.96 0.87, 1.05 1.04 0.94, 1.15 0.95 1.07 0.85, 1.01 0.93, 1.09 0.95 0.87, 1.05 1.02 0.92, 1.13 0.99 0.89, 1.11 Intramural activities (3 – 9 pts) 1.06 0.75, 1.47 1.10 0.76, 1.58 1.02 0.69, 1.51 1.18 0.73, 1.92 0.84 0.60, 1.17 1.09 0.76, 1.57 1.04 0.69, 1.58 1.11 0.72, 1.71 Interscholastic sports (2 – 6 pts) 1.01 0.76, 1.35 0.98 0.72, 1.33 1.25 0.88, 1.77 1.23 1.83 0.83, 1.28 0.97, 1.71 1.00 0.73, 1.36 1.30 0.90, 1.88 1.14 0.79, 1.64 Physical education (2 – 6 pts) 0.85 0.62, 1.16 0.90 0.64, 1.26 0.78 0.53, 1.12 0.96 1.43 0.65, 0.94 0.68, 1.28 0.75 0.54, 1.04 0.87 0.58, 1.30 1.13 0.76, 1.69 Active commuting (2 – 6 pts) 1.34* 1.04, 1.74 0.97 0.74, 1.28 1.17 0.87, 1.57 1.40 2.05 0.96, 1.54* 1.19, 1.99 0.95 0.72, 1.26 1.17 0.86 1.59 1.45* 1.04, 2.04 Policies (10 – 30 pts) 0.93 0.80, 1.10 0.84 0.70, 1.00 1.18* 1.00, 1.40 1.06 1.38 0.92, 1.08 0.91, 1.28 1.03 0.86, 1.23 1.07 0.89, 1.27 1.18 0.97, 1.18 †Adjusted for age, SES and language (French or English-speaking school)
29 Table 5 : Odds Ratios and 95% Confidence Intervals of Attaining Physical Activity Recommendations for
Different Environmental Characteristics in Unadjusted and Fully Adjusted Multilevel Analyses (N=776)†
Environment characteristics variables (range)
Participating in 60 minutes of moderate to vigorous physical activity per day
Models for individual environmental characteristics Model including all environmental characteristics
Girls Boys Girls Boys
OR CI OR CI OR CI OR CI Environment ( 53 – 150 pts) 1.00 0.97, 1.03 1.00 0.95, 1.05 1.01 0.97, 1.04 0.98 0.93, 1.02 Facilities (29 – 87 pts) 0.98 0.94, 1.03 0.97 0.90, 1.04 1.02 0.94, 1.11 0.86* 0.78, 0.94 Recess rules (12 – 36 pts) 1.00 0.91, 1.10 1.04 0.89, 1.23 1.06 0.92, 1.22 1.12 0.97, 1.30 Intramural activities (3 – 9 pts) 1.07 0.80, 1.43 1.16 0.71, 1.88 0.98 0.52, 1.83 1.14 0.65, 1.98 Interscholastic sports (2 – 6 pts) 1.14 0.84, 1.55 1.16 0.74, 1.82 1.27 0.75, 2.14 1.05 0.64, 1.71 Physical education (2 – 6 pts) 0.96 0.69, 1.34 1.05 0.63, 1.73 0.64 0.32, 1.25 1.13 0.69, 1.86 Active commuting (2 – 6 pts) 0.97 0.72, 1.30 1.69 1.11, 2.58 0.81 0.53, 1.24 2.19* 1.43, 3.37 Policies (10 – 30 pts) 0.98 0.81, 1.20 1.17 0.86, 1.60 1.07 0.83, 1.38 1.25 0.85, 1.85
†Adjusted for age, SES and language (French or English-speaking school) *p < .05
30
APPENDIX - Classification of the 36 physical activities as organized, non-organized, group-based and individual
√ = automatically classified in this category
A = classified in this category if most often practiced alone, with siblings, with parents, with friends B = classified in this category if most often practiced with a group or team
C = classified in this category if most often practiced with siblings, with parents, with friends or with a group or team D = classified in this category if most often practiced alone
Physical activities Non-organized Organized Group-based Individual
Home exercises (push-ups, sit-ups) √ √
Weight training √ √
Trampoline √ √
Skipping rope √ √
Indoor chores (vacuuming, cleaning) √ √
Outdoor chores (mowing, gardening) √ √
Games (chase, tag, hide and seek) √ C D
Baseball or Softball A B C D Basketball A B C D Football A B C D Soccer A B C D Volleyball A B C D Dance A B C D
Handball or mini handball A B C D
Ball-playing (dodge ball, kickball,
catch) A B C D
Street hockey, Floor hockey A B C D
Ice hockey A B C D
Ringette A B C D
Ice skating (not for hockey or
ringette) A B √
In-line skating A B √
Skateboarding A B √
Bicycling A B √
Walking for exercise A B √
Track and Field A B √
Jogging or Running A B √
Golf A B √
Swimming A B √
Gymnastics A B √
Aerobics, yoga, exercise class A B √
Badminton A B √
Tennis A B √
Kayak, canoe A B √
Downhill skiing or snowboarding A B √
Boxing, wrestling A B √
Karate, Judo, Tai-chi ou Tae Kwon Do A B √