Sharing the “fame” of the ISO Standard Adoption:
Quality Supply Chain Effect Evidence from the French Employer
Survey
Marc-Arthur DIAYE
CREST (ENSAI) and Centre d'Etudes de l'Emploi. [email protected] Nathalie GREENAN
Centre d'Etudes de l'Emploi and TEPP (Cnrs FR, 3126). [email protected] Sanja PEKOVIC
Université Paris-EST Marne-La-Vallée (OEP), Centre d'Etudes de l'Emploi and TEPP (Cnrs FR, 3126)
Abstract:
The objective of this paper is to provide empirical evidence whether the hierarchical position of different types of quality supply chain categories (in terms of the quality signal strength) imply the same hierarchy in terms of monetary gains. Actually, using French cross-sectional surveys, we distinguish four types of quality supply chain categories what help us to empirically construct a relationship between firms and their suppliers (quality certified/non quality certified). Our findings, from a two-regime switching model, reveal that there is a positive correlation between hierarchical position of the quality supply chain categories and the impact on firm‟s productivity (measured by value added per employee).
Key words: ISO 9000 standard; Supply Chain; Signal; Quality; Club Goods JEL classification: L15, H41, D62
1. Introduction
In recent years, one of the central issues of discussion in economics has been the significant shift in patterns of work organization brought about by dramatic changes in the business environment. These changes have arisen due to a number of global factors, some of which include the spread of market globalization, severe competition, improvement in communication as well as rapid development and transfer of technology. In this context, adopting mechanisms that optimize quality approaches, such as ISO 9000 standards or Total Quality Management (TQM), has become a core competency for firms that strive to achieve long-term business success. As a result, firms have conferred an increasing importance on management practices based on quality, since these aim to eliminate sources of error and inefficiencies, which, in turn, can improve a firm‟s performance in terms of meeting customer requirements, and increasing organizational performance and employee job satisfaction (Hackman and Wageman, 1995). In parallel to becoming quality oriented, firms have also been urged to develop close partnership with their suppliers. Actually, in order to achieve a competitive edge, many firms realize that it is not enough to enhance their own performance since competition today is evaluated as a network of cooperating firms in the supply chain (Hult et al., 2004). In fact, in recent years, the competition is becoming less „firm vs. firm‟ and more „supply chain vs. supply chain‟ (Hult et al., 2007). In this sense, firms have begun to look beyond their own boundaries, their challenges are to move from internal efficiency to supply chain efficiency (Olhager and Selldin, 2002). Thus, supply chain could be defined as a strategic collaboration or partnership between the firms in order to leverage strategic position and to improve operating efficiency. In other words, it is argued that firms establish their supply chain not merely as a means to get products where they need to be, but also as a tool to enhance key outcomes (e.g. Hult et al., 2004). Furthermore, it is suggested that there is systematic share of information between firm and its suppliers (Creane, 2008) what makes the supply chain efficiency one of the most important drivers of a firm performance improvement (e.g. Lo et al., 2008).
Consequently, we argue that the effectiveness of firm performance varies also according to the characteristics of the relationship, in terms of quality level, between the firm and its supplier (Cusumano and Takeshi, 1991; Dyer and Nobeoka, 2000). However, the increased specialization within a production chain cannot be achieved without a cost. For instance, Hult et al. (2004) indicated that supply chain processes improvement has led firms to spend vast sums. Additionally, a costly process of ISO certification, as an obstacle for many firms,
influences firms‟ strategic behavior to become or not ISO certified1
. Hence, some firms may try to be indirectly certified, through their suppliers, to gain advantage of ISO certification, but at the same time try to avoid a difficult and costly process of ISO certification. Therefore, each firm tries to establish the structure of supply chain network that would best correspond with its strategic orientation in term of financial resources, quality level improvement, etc. The objective of this paper is not to show the impact of ISO 9000 certification on firms‟ economic performance as this has already been shown by studies of Terlaak and King (2006) and Corbett et al. (2005). Rather, it is to provide empirical evidence whether the hierarchical position of the four quality supply chain categories (in terms of the quality signal strength) imply the same hierarchy in terms of monetary gains? This question is important because a positive answer means that ISO standard is a Club2 Good3 leading to some fundamental open questions like whether the number of ISO certified firms is equal to the Pareto optimal number of ISO certified firms. Indeed given the existence of externalities it may be the case that the number of firms which are ISO certified is lower than the Pareto optimal number of ISO certified firms.
To verify whether the hierarchical position of quality supply chain categories is positively correlated with firm‟s performance, we distinguish four categories of quality supply chains based on the French Organizational Changes and Computerization survey4 (COI) from 2006. The first category called Direct Complete Quality Supply Chain includes firms that have ISO 9000 certification and whose suppliers are also ISO 9000 certified. The second category named Direct Non Complete Quality Supply Chain, presents those firms that are certified with ISO 9000 certification although their suppliers are not. The third category called Indirect Quality Supply Chain includes firms which are not ISO 9000 certified but their suppliers have ISO 9000 certification. The fourth category named Non Quality Supply Chain includes firms
1 The cost of certification can be very high (Anderson et al., 1999). More precisely, Anderson et al. (1999) report that obtaining ISO 9000 certification in the manufacturing sector in the U.S. takes from 9 to 28 months and approximately 35-40% of all sites fail the first audit. The costs of the standard adoption and certification are substantial. A medium size manufacturing facility employing 100 people can expect to spend $50 000. For larger firms (sales from $100 million to $500 million), the average cost that the authors report is $300 000. Moreover, Delmas (2000) argues that “design costs of ISO standard” are a more important constraint than are the “registration costs” and the “annual cost of maintaining” an ISO standard.
2 A club goods is classified as a subtype of Public Goods that is excludable but non rivalrous.
3 There are a number of studies conceptualizing ISO standard as a Club Good (e.g. Potoski and Prakash, 2005; Kollman and Prakash, 2002; Prakash, 1999); however there is, to the best of our knowledge, no empirical analysis showing that ISO standard could be considered as a Club Good. Additionally, an approach in terms of supply chain is significant for confirming that ISO 9000 standard acts as a Club Good because as shown by Bramoullé and Kranton (2007), the production of Public Goods fundamentally induces a network of relationships between different participants.
4
More details about the design and scope of this survey are available on www.enquetecoi.net. : Survey COI-TIC 2006-INSEE-CEE/Treatments CEE.
that are not ISO 9000 certified and their suppliers also do not have ISO 9000 certification. This categorization allows us to empirically construct a relationships between firms and their suppliers (certified/non certified).
The remainder of the paper is organized as follows: section 2 explains supply chain effect; section 3 develops the main issue of the paper; section 4 presents the data sets and introduces our econometric analysis; section 5 presents result, finally section 6 provides discussion and conclusion.
2. The impact of supply chain relationship
Firms seeking to improve their performance are increasingly concerned about the performance of other firms upstream in their supply chain what is justified by the fact that unsatisfactory quality performance records of suppliers could degrade the reputation of downstream customers who buy their products (Delmas and Montiel, 2009). Actually, a high level of involvement between firm and suppliers is an important characteristic of many successful businesses since more than half the value of a firm‟s product is purchased from suppliers (Levine, 1995). In the same vein, Baiman et al. (2000) argue that the quality of a firm‟s product depends not only on the firm‟s actions but those of its suppliers. Additionally, consumers‟ beliefs about firm‟s quality are updated upon observing firms‟ decision to form a quality partnership with its suppliers (Costa and Vasconcelos, 2010).
It is argued that a supply chain network can be more effective than a firm at the generation, transfer and recombination of knowledge since there is greater diversity of knowledge within a network of firms than in a firm (Dyer and Nobeoka, 2000). Hence, being certified is a positive signal concerning quality improvement (Terlaak and King, 2006), and having a supplier as a certified firm amplifies this positive signal.
Therefore, the firm‟s objective is to establish a good relationship with its suppliers in order to assure continuous improvement of its performance. Supplier quality management must become an integral part of achieving consistent total product quality. For this reason, ISO 9000 has become an international standard that serves as a key selection criterion for supplier selection (Lo et al., 2008). Moreover, preferential suppliers of large firms are often determined on the basis of a consistent supply of quality (Reyniers and Tapiero, 1995). Aditionally, numerous firms have demanded that their suppliers become quality certified (Anderson et al., 1999). For instance, in the US, large companies like General Electrics, Du Pont and Eastman Kodak demand that their suppliers become certified.
On the other hand, for a certified firm to have a non-certified firm as a supplier, reduces the positive signals stemming from quality improvement. However, having a certified firm as a supplier, while being non-certified, improves signals regarding quality improvement. In fact, supplier partnering, which involves close cooperation between firms and their suppliers, allows non-certified plants to learn about best quality management practices from their certified supply chain partners (Terlaak, 2001). Actually, firms choose high quality suppliers in order to enhance their own quality reputations (Delmas and Montiel, 2009).Similarly, it is argued that firms often seek partners to provide complementary assets when such assets are important but difficult to acquire (Teece, 1986).
As a consequence, the relationships between firms and suppliers will determine the category of the quality supply chain and the strength of the signal (regarding quality improvement) that is generated through the relationship between firms and suppliers.
The fact that both actors in the relationship (firms and suppliers) of Direct Complete Quality Supply Chain5 category are ISO 9000 certified creates a very strong relationship in terms of two-way diffusion of quality improvement information. Moreover, even if the suppliers are not certified in the Direct Non Complete Quality Supply Chain category, the firm‟s certification permits this group to still produce a strong quality signal. Although the actors of this group lost benefits because of they have one-way diffusion of quality information, they are still on the second position. Furthermore, in the case of the Indirect Quality Supply Chain, although the principal beneficiary of ISO 9000 advantages (firm) is not directly certified, firms in this group indirectly benefit from ISO 9000 advantages through its suppliers which are certified (indirect membership). We define this relationship as a fairly weak in terms of the diffusion of quality improvement information. Finally, firms which belong to the Non Quality Supply Chain category are not ISO 9000 certified, so the quality signal is therefore very weak.
According to the quality signal strength that firms produce, we can classify them in four categories: the Direct Complete Quality Supply Chain is at the top of the classification, followed by the Direct Non Complete Quality Supply Chain, then the Indirect Quality Supply Chain and finally the Non Quality Supply Chain, respectively.
5
Direct Complete Quality Supply Chain include companies that have ISO 9000 certification and their suppliers are also ISO 9000 certified; Direct Non Complete Quality Supply Chain contain firms that are certified with ISO 9000 certification but their suppliers are not; Indirect Quality Supply Chain include firms which are not ISO 9000 certified but their suppliers have ISO 9000 certification; and Non Quality Supply Chain include firms that are not ISO certified and their suppliers do not have ISO 9000 certification.
3. Hierarchical Positioning by Cost-Benefit Analysis
Does the hierarchical position of the four quality supply chain categories (in terms of the quality signal strength) imply the same hierarchy in terms of monetary gains?
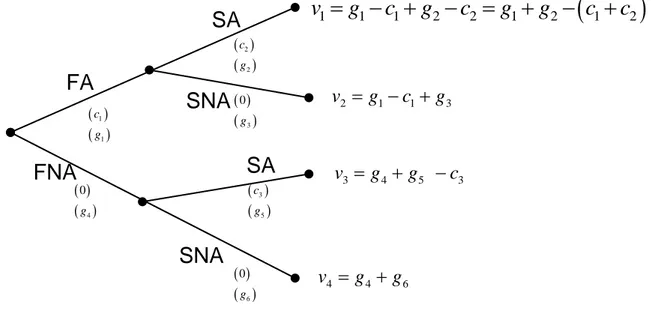
The answer is not straightforward. Indeed let v v v v1, 2, ,3 4be respectively the values of the firms (see Figure 1) belonging to the Direct Complete Quality Supply Chain, the Direct Non Complete Quality Supply Chain, the Indirect Quality Supply Chain and the Non Quality Supply Chain6. Figure 1 shows that firms in Indirect Quality Supply Chain category do not act as “free riders” because they pay additional costs of having certified suppliers. Thus, it seems that, for a firm it is a rational decision to become a part of a Direct Complete Quality Supply Chain category, a Direct Non Complete Quality Supply Chain category, an Indirect Quality Supply Chain category or a Non Quality Supply Chain category, because the other alternatives lead to a weaker net monetary gain. In other words, from the firm‟s standpoint its decision to become a part of the Direct Complete Quality Supply Chain, the Direct Non Complete Quality Supply Chain, the Indirect Quality Supply Chain or the Non Quality Supply Chain is always optimal. As a consequence, if we take four different firms which belong respectively to the Direct Complete Quality Supply Chain, the Direct Non Complete Quality Supply Chain, the Indirect Quality Supply Chain and the Non Quality Supply Chain, it is a priori impossible to say whether the net monetary gains for the firms belonging to the Direct Complete Quality Supply Chain (v1) are higher than the net monetary gains for the firms belonging to the Direct Non Complete Quality Supply Chain (v2) which are higher than the net monetary gains for the firms belonging to the Indirect Quality Supply Chain (v3) which are higher than the net monetary gains for the firms belonging to the Non Quality Supply Chain (v4).
6
The notation could be confusing, indeed roughly speaking, we have to put an index tovj. For instance vk j where
j {1, 2, 3, 4}, and k {Direct Complete Quality Supply Chain, Direct Non Complete Quality Supply Chain,
Figure 1: Net monetary gains in the supply chain from the adoption or non-adoption of ISO 9000
where:
- FA, FNA, SA and SNA respectively mean “ISO 9000 Adopter Firms”, “non ISO 9000 Adopter Firms”, “ISO 9000 Adopter Suppliers” and “non ISO 9000 Adopter Supplier”. - c1, c2, and c3 are respectively the cost of ISO 9000 certification, the additional cost of having
suppliers that are certified with ISO 9000 when the firm is certified with ISO 9000 and the additional cost of having suppliers that are certified with ISO 9000 when the firm is not ISO 9000 certified.
- g1 +g2 is the gain of a firm that is certified with ISO 9000 when its suppliers are also
certified with ISO 9000.
- g1 +g3 is the gain of a firm that is certified with ISO 9000 when its suppliers are not certified
with ISO 9000.
- g4+g5 is the gain of a firm that is not certified with ISO 9000 when its suppliers are certified
with ISO 9000.
- g4 +g6 is the gain of a firm that is not certified with ISO 9000 when its suppliers are not
certified with ISO 90007.
- vj,, j {1, 2, 3, 4}, is the net monetary gain that a firm could receive or not from the
implementation/non-implementation of the ISO 9000 certification.
7 Of course, it seems reasonable to state that g
1 > g4 , g2 > g3 >g5 > g6 and c1 >c3 > c2. 22 c g 1 1 c g 3 5 c g 6 0 g 3 0 g 4 0 g
1 1 1 2 2 1 2 1 2v
g
c
g
c
g
g
c
c
2 1 1 3 v g c gv3 g4 g5 c3 4 4 6 v g g
SA
FA
SNA
FNA
SA
SNA
4. Method
The database
The research presented here is based on French microeconomic survey called the Organizational Changes and Computerization (COI, 2006). The COI survey was created by researchers and statisticians within the economic administration. This collaboration gathered a great deal of knowledge, which made it possible to put together the surveys of different firms and the surveys concerning employees section (labor force). The original dataset included a representative sample of 13 790 private firms located in France from all industries except agriculture, forestry and fishing. Each firm fills in a self-administered questionnaire concerning the utilization of information technologies and work organizational practices in 2006 and changes that have occurred since 2003. Firms were also interviewed on the economic goals of organizational change and the economic context in which those decisions were made.
Because two variables, namely the value added and capital, were not available in the COI database, we merged it with another French database, that is, the Annual Enterprise Survey (EAE). The final dataset includes 10 268 usable observations8.
Dependent Variable
Following previous research (e.g. Black and Lynch, 2001; Greenan and Mairesse, 2000), the productivity effects of different quality supply chain categories (production factors) are determined by estimating Cobb–Douglas production functions. Actually, our dependent variable is the logarithm of value added per employee: log(y/L). The standard Cobb-Douglas production function permits productivity (measured here by the value added per employee) to depend upon different firm‟s characteristics. The choice of these characteristics, in this paper, will be presented further in this section.
8 The previous edition of COI survey (1997) has been used by several researchers, for instance, the special issue by Greenan and Mairesse (2006), Acemoglu et al. (2007) or Aubert et al. (2006).
Independent Variable
We use four categories of quality supply chains, the Direct Complete Quality Supply Chain, the Direct Non Complete Quality Supply Chain, the Indirect Quality Supply Chain and the Non Quality Supply Chain, in order to create six dummies of quality supply chain categories that will permit us to evaluate their impact on firm‟s value added per employee (productivity). To resume, we consider six models:
In Model 1, the dummy variable is 1 if the firm belongs to a Direct Complete Quality Supply Chain and is 0 if the firm belongs to a Direct Non Complete Quality Supply Chain.
In Model 2, the dummy variable is 1 if the firm belongs to a Direct Complete Quality Supply Chain and is 0 if the firm belongs to an Indirect Quality Supply Chain.
In Model 3, the dummy variable is 1 if the firm belongs to a Direct Complete Quality Supply Chain and is 0 if the firm belongs to a Non Quality Supply Chain.
In Model 4, the dummy variable is 1 if the firm belongs to a Direct Non Complete Quality Supply Chain and is 0 if the firm to an Indirect Quality Supply Chain.
In Model 5, the dummy variable is 1 if the firm belongs to a Direct Non Complete Quality Supply Chain and is 0 if the firm belongs to a Non Quality Supply Chain. In Model 6, the dummy variable is 1 if the firm belongs to an Indirect Quality Supply
Chain and is 0 if the firm belongs to a Non Quality Supply Chain.
For instance, when we compare firms in the Direct Complete Quality Supply Chain category to firms in the Direct Non Complete Quality Supply Chain category, y will be the logarithm 1 of the value added per employee of firms (productivity) in the Direct Complete Quality Supply Chain category and y will be the logarithm of the value added per employee per 0 employee of firms in the Direct Non Complete Quality Supply Chain category.
Controls
Our analysis includes several firm characteristics to control for sources of firm-level heterogeneity. The choice of variables is based on previous studies relating quality standards and productivity (e.g. Pekovic, 2010; Terlaak and King, 2006; Zwick, 2004; Black and Lynch, 2001; Greenan and Mairesse, 2000).
Features of the firm’s strategy. It is argued that quality standards adoption is positively associated with features of the firm‟s strategy such as quality improvement, cost reduction, technological improvement, standardization, improvement and/or maintenance of skills, delay reduction and competitive price since adoption of quality practices contributes to the improvement of these strategies by work method continuity, by reducing non-value added activities, by improving operations, by supporting innovation (e.g. Pekovic, 2010). In order to introduce specific strategy firm has to change significantly way the business is organized. Therefore, following Black and Lynch (2001), we argue that changes in organization have been a significant determinant of the firm‟s productivity. We create seven binary variables representing quality improvement, cost reduction, technological improvement, standardization, improvement and/or maintenance of skills, delay reduction and competitive price that equal 1 if the firm considers quality improvement, cost reduction, technological improvement, standardization, improvement and/or maintenance of skills, delay reduction and competitive price as important or very important strategy, respectively.
External market’s constraints. The literature review confirms that firm implements quality practices driven by external pressure (e.g. Terlaak and King, 2006). The belief that external pressure enhances firm‟s productivity is widespread and it is based on the fact that external pressure plays a role in motivating organizational efficiency and growth (e.g. Bottasso and Sembenelli, 2001; Aghion et al., 1999). We include four measures to control for the external market‟s constraints. More precisely, we introduce variables competitive pressure and uncertainty on the market that have value 1 if they influences strong or very strong the choice of firm‟s organization and computerization strategy and variables suppliers and clients conditioned that takes value 1 if three main suppliers or clients make up 50% of the firm‟s turnover, respectively.
Previous experience. We also control for the experience with related management standards, such as the environmental standards. Actually, previous adoption of similar standards can aid the successful implementation of the ISO 9000 certification through the utilization of related information, resources and skills (Pekovic, 2010). Moreover, firms that have previous experience with similar standards are expected to incur lower additional costs (e.g. through the overlap of documentation) because of “learning-by-doing” and scale economies (Grolleau et al., 2007). Furthermore, previous empirical analysis provides evidence that environmental practices improve productivity through waste elimination (e.g. Galdeano-Gómez and Céspedes-Lorente, 2008). We therefore include a variable representing the adoption of
environmental standards which is a binary variable with value 1 indicating the adoption of those standards.
Relation with Clients. The concept of quality practices is based on the fact that it is essential to maintain very close links with customers in order to both identify their needs and receive the feedback necessary for the firm to understand to what extent it has succeeded in satisfying those requirements and whether to initiate the relevant improvement activities (Pekovic, 2010). Moreover, if the quality level of firms is unobservable, from a signalling perspective, quality standards can provide information on the general capability of a firm to meet the quality expectations of customers and thus make unobservable characteristics more public (Spence 1973). It is expected that good relation with clients impacts positively firm‟s productivity since improvements in customer satisfaction can decrease the time and effort devoted to handling returns, rework, warranties and complaint management while at the same time lowering the costs of making future transactions (Anderson et al., 1997). We use three binary variables as indicators for relation with clients: using labelling for goods and services, deliver or supply goods or services in a fixed deadline and contact or call centre for clients. They take value 1 if under customer policy firm uses labelling for goods and services, deliver or supply goods or services in a fixed deadline and have contact or call centre for clients. Capital.Firms with more capital are expected to invest in quality standards (Pekovic, 2010). Furthermore, capital is considered as an important determinant of productivity (e.g. Zwick, 2004; Black and Lynch, 2001; Greenan and Mairesse, 2000). Therefore, we introduce the capital that is a continuous variable.
Labor. The majority of empirical studies (e.g. Pekovic, 2010; Terlaak and King, 2006) found that the the probability of the adoption of quality standards increases with a firm‟s size. Furthermore, size has also been considered as significant determinant of productivity (e.g. Zwick, 2004; Black and Lynch, 2001; Greenan and Mairesse, 2000). The impact of firm‟s labor size on different types of supply chain categories and productivity is measured by continuous variable representing number of employees inside the firm.
Sector of Activity.Finally, it is argued that sector characteristics influence the likelihood that a firm decide to implement quality practices (Pekovic, 2010). Furthermore, the productivity effects of one sector cannot easily be transferred to other sectors (Godard and Delaney, 2000). In order to control for sectoral differences, we include sectoral dummy variables based on the N36 sector classification created by the French National Institute for Statistics and Economic Studies. More precisely, we introduce 11 dummy variables that equals to 1 if the firm‟ activity is agrifood, consumption goods, cars and equipments, intermediate goods, energy,
construction, commercial, transport, financial and real-estate activities, services for firms and services for individuals, respectively.
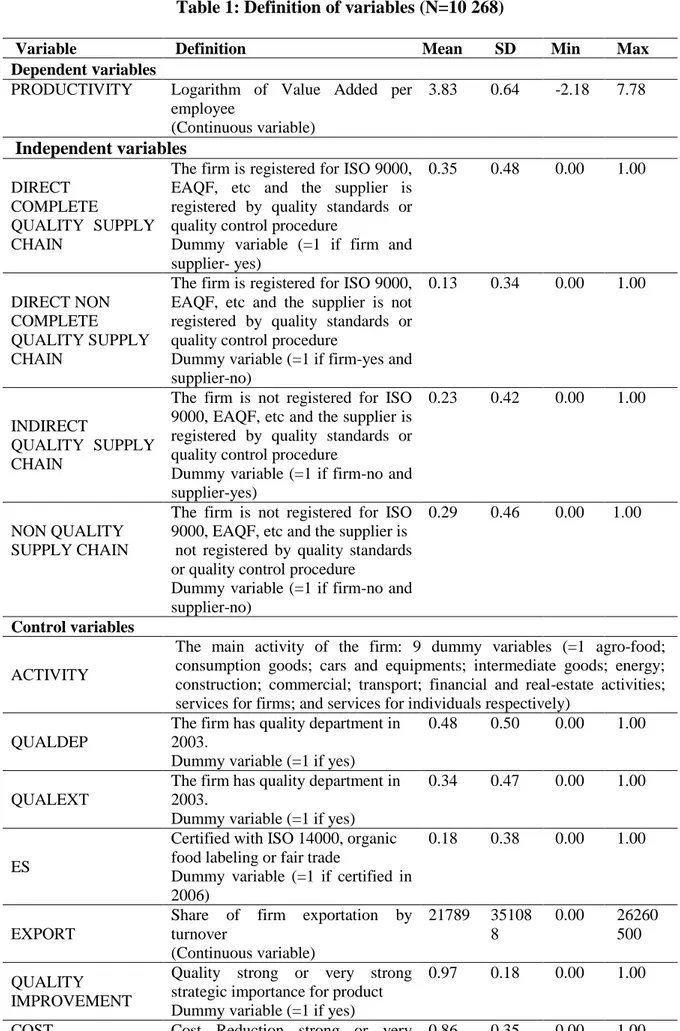
The variables used in estimation and their definitions are presented in Table 1. No problem of strong colinearity has been detected (Appendix 1).
***
[Insert Table1 around here] ***
Econometric Strategy
We aim to show that from an empirical standpoint the net monetary gain of a firm ( )vj varies according to the quality supply chain category (j) that a firm belongs to. More specifically, we will look at the orderingv1v2 v3 v4 (where v represents firm‟s monetary gain).
Let y be the economic performance variable, in our case defined as firm‟s productivity. yiis therefore the productivity variable of firm i. yi can be written as: yiZ1iZ2i (1), where Z1i
is the productivity due to all other factors but the quality supply chain category, and Z2i is the productivity due to the quality supply chain category.
Let:Z1i 0 1X1i .. pXpi u1i
1 , where the X1,., Xp are variables which explained Z1;and Z2i v1 1i v2 2i v3 3i v4 4i u2i
2 if we look at the ordering v1v2v3v4. Of course, the 1i, 2i, 3i, 4iare the characteristic functions which equal to 1 if the firm ibelongs to the corresponding category and 0 if otherwise and u1i, u2i are error terms. Testing v1v2 v3 v4in the model
0 .. .
i 1 1i p pi 1 1i 2 2i 3 3i 4 4i i
y X X v v v v 3 , is equivalent to testing 0 v‟2 v‟3 v‟4 in the model
0 .. ‟ ‟ ‟
i 1 1i p pi 2 2i 3 3i 4 4i i
y g X X v v v 4 .
However, this model considers quality supply chain categories as exogenous. More precisely, firms choose to become a part of particular quality supply chain category and their decision may not be random as it may depend on firms‟ individual characteristics. In spite of the fact
that we are able to control for firm‟s characteristics, some unobserved characteristics that influence the firm‟s choice of a specific quality supply chain category could also influence firm‟s productivity. For instance, costs and benefits effects are correlated with firm‟s productivity; hence, the decision to choose among different supply chains categories is endogenous, leading to biased estimates. Moreover, several empirical researches have demonstrated that ignoring the potential bias endogeneity of measures of management practices leads to downward biased estimates of these practices on firm performance (e.g. Ichniowski and Shaw, 1995). In order to avoid this problem, we use the switching regression model which permits us to control for the endogenous effect by estimating simultaneously the selection equation and the productivity equations, for two regimes: superior or inferior quality supply chain category.
The switching model structure is defined by two states: state 1 and state 0, corresponding respectively to a specific type of quality supply chain categories (for instance state 1 may correspond to the Direct Complete Quality Supply Chain and state 0 to the Indirect Quality Supply Chain).
Hence, the model is composed of the following system of three equations that are estimated simultaneously:
1 log y1i ‟1Xi i (5)
0i ‟0 i oi log y X (6) * ‟ 0 i i i i ISO M Z (7)Equations (5) and (6) are the structural equations that describe the productivity of firms in the alternative regimes. More precisely, as we define previously, y1i and y0i represent respectively the productivity of firm i in state 1 and state 0. Furthermore, Xi is a vector of explanatory variables (features of the firm‟s strategy, external market‟s constraints, previous experience with related management practices, relations with clients, logarithm of the capital per employee, logarithm of the labor, sector of activity), ‟1and ‟0are vectors of slope coefficients to be estimated. Finally 1 and 0are the disturbance terms for the two equations respectively, with null means and variances equal to 2
1
and 2 0
.
Equation (7) is the selection equation that determines a firm‟s “propensity” of belonging in one of quality supply chain categories that depends on the differences between monetary
gains associated with each category (being Direct Complete Quality Supply Chain, Direct Non Complete Quality Supply Chain, Indirect Quality Supply Chain or Non Quality Supply Chain). More precisely, ISO*i is the monetary gain for the firm i for belonging to one of the quality supply chain categories and a firm i will choose one of the categories if its monetary gain of belonging to this category is strictly positive. In equation (7), Mi is a vector of explanatory factors of being in one of the quality supply chain categories and is an error term which follows a normal law with mean and variance respectively equal to zero and one. Here ISO is a latent variable measuring the tendency or the firm‟s likelihood of being in the i* first or the second regime and it has following form:
* 1 0 0 . i i i ISO if ISO ISO otherwise (8)
Noteworthy, it is well known that this type of models are sensitive to the distributional assumption and the specification of the both the first step switching equation and the productivity equations. Hence, in order to reduce this sensitivity, we need to have an additional variable that influences firm‟s choice to become a part of a specific quality supply chain category but does not to influence productivity (i.e. at least one variable in M which is not in X). To achieve this identification, we include the vector Zi containing: whether a firm has a full time quality manager or outsource manager for quality. The inclusion of those variables may be justified by argument that an administrational unit (such as the internal and external quality unit) indicates a closer proximity to institutionalized norms, thus increasing the perceived need to comply with those norms (Pekovic, 2010; Beck and Walgenbach, 2003). Additionally, administrative departments (in our case internal and external quality departments) serve as direct channels through which new practices enter the firm from its institutional environment (Pekovic, 2010). Moreover, Beck and Walgenbach (2003) find that having a larger proportion of administrative staff, i.e. concerning quality issue, improves and promotes better possibility of implementing ISO 9000. Similarly, Pekovic (2010) finds that internal and external quality departments impact positively adoption of ISO 9000 standard. Even if this is not a proper test for instrumental variable validity, it is worth noting that none of our proposed instrumental variables appear to be a significant determinant when included directly in a single equation logit model. Furthermore, to our knowledge, there is no empirical
or theoretical evidence regarding the direct relationship between those variables and firm‟s productivity.
Finally, we observe log y
1i if ISOi 1 and log y
0i ifISOi 0, with the variance-covariance matrix which can be written:2 1 10 1 2 10 0 0 1 0 1
Besides, the variance-covariance matrix can be estimated in one step. In order to test for the endogeneity of the switching model, the parameters of interest are the covariances of the error term of each productivity equation with the error terms of the selection equation. If these covariances are different from zero, then the selection process is not exogenous, and the estimation of the productivity equations by Ordinary Least Squares (OLS) would produce inconsistent estimators of the parameters of the model. The covariance between the error terms of the selection equation and firm‟s productivity equations informs us about the adequacy of using the switching model to describe the selection process. Actually, we have endogeneity if 1 or 0 are significantly different from zero, i.e. if the errors of the productivity equations and the error of the choice equation are correlated. 10 is not defined since the two regimes are never observed simultaneously.
Switching models are then based on the analysis of three variables but each of them is partly observed (Maddala, 1983). The selection variable, ISO*i, is not directly observed but only through a dummy ISO . i
Moreover, the probability of observingy1i or y depends on the outcome of the selection 0i variableISO . The expected productivity, conditionally on being state 1 can be calculated as i follows, 1 1 1 1 ( ' ) log( ) 1 ' 1 ( ' ) i i i i i M E y ISO X M (9)
0 0 0 0 ( ' ) log( ) 0 ' 1 ( ' ) i i i i i M E y ISO X M (10)
The model is estimated by the method of Maximum Likelihood. Although we do not observe the tendency of a firm being in one or the other productivity regime, we know that if ISOi 1 the firm‟s productivity is determined by equation (5), and if ISOi 0, the firm‟s productivity is determined by equation (6). The likelihood function for each observation is thus given by:
1 1 0 log ( 1) log( ) 1 ( 0) log( ) 0 , (11) n i i i i i i i
L prob ISO f y ISO
prob ISO f y ISO
with
1 1 1 ' 1 1 1 1 ) 1 1 1/ 2 2 1 1 ' 1 1 1 2 2 1 1 ( 1) ( ' ) ( 0) 1 ( ' ) log( ) 1 ( ' ) log( x 1 ' log i i i i i i i i i i i i prob ISO M prob ISO M f y ISO M y X M y X (12)
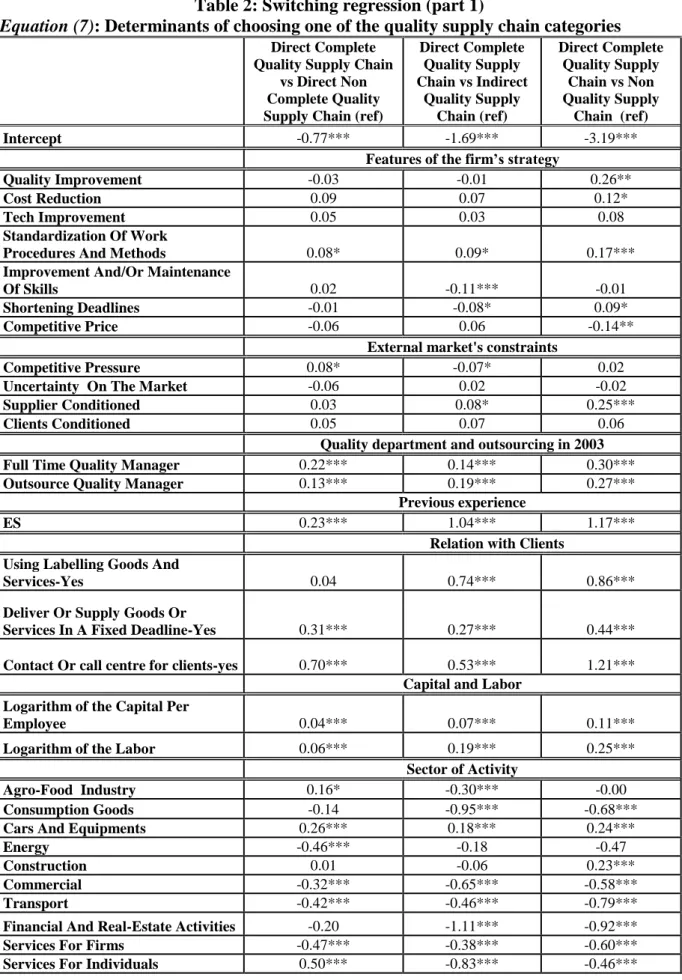
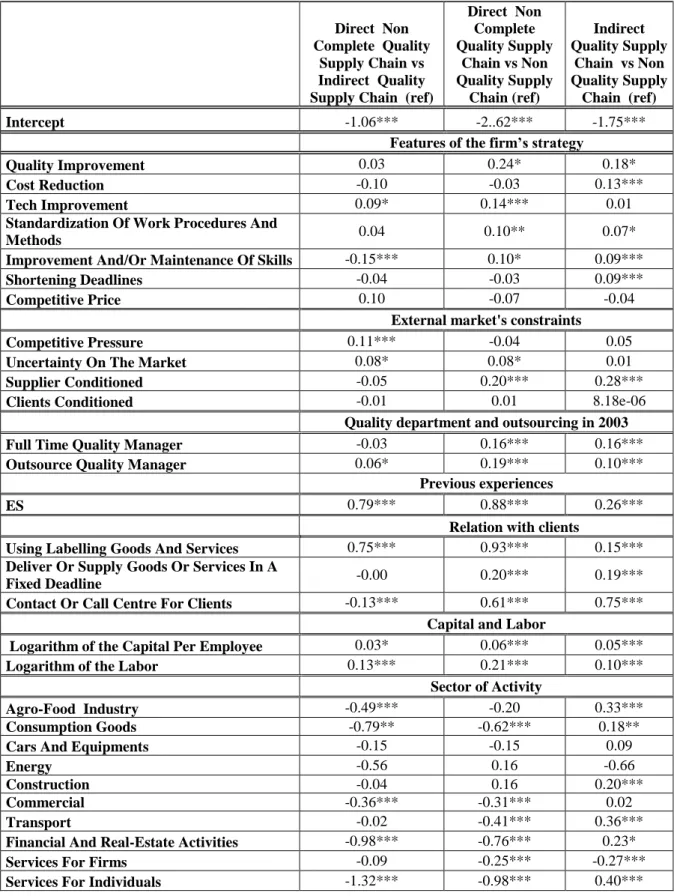
1 1 1 ' 1 1 0 0 ) 0 0 1/ 2 2 0 0 ' 0 0 0 2 2 0 0 log( ) 0 ( ' ) log( x 1 ' log (13) i i i i i i i i f y ISO M y X M y X 5. ResultsThe results of the switching model estimation are presented in Tables 2 to 9. Tables 2 and 6 present the determinants of quality supply chain categories, Tables 3 and 7 present the determinants of productivity for the superior category of quality supply chain and Tables 4 and 8 provide the determinants of productivity for the inferior category of quality supply
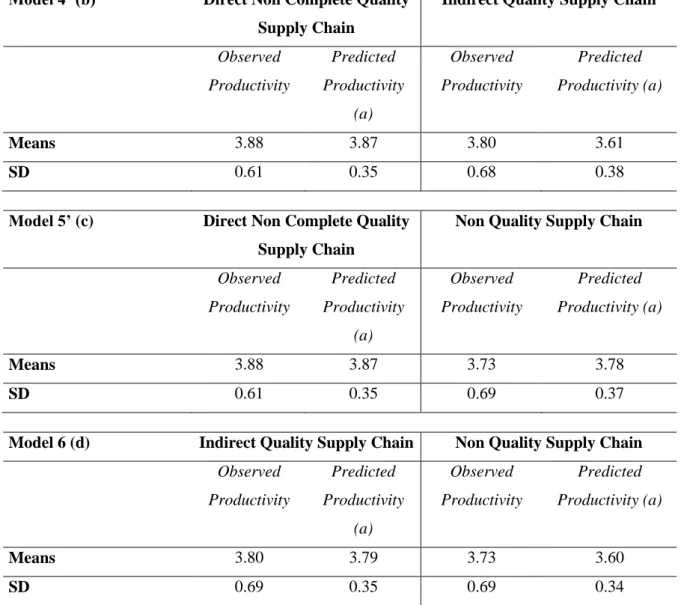
chain. Tables 5 and 9 provide comparison of the observed and predicted productivity for four types of quality supply chain categories.
***
[Insert Tables 2 to 9 around here] ***
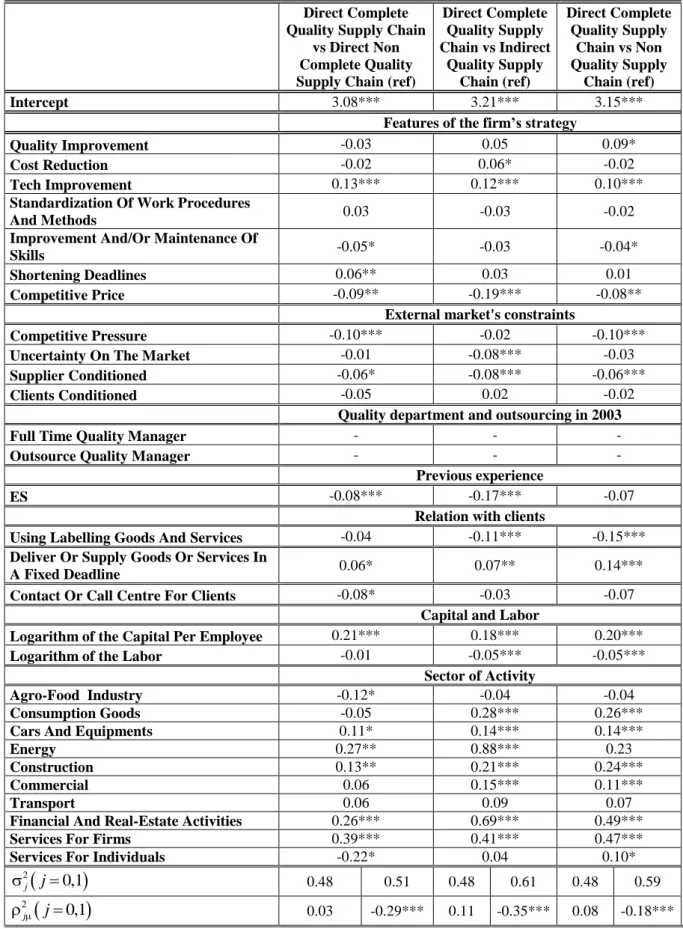
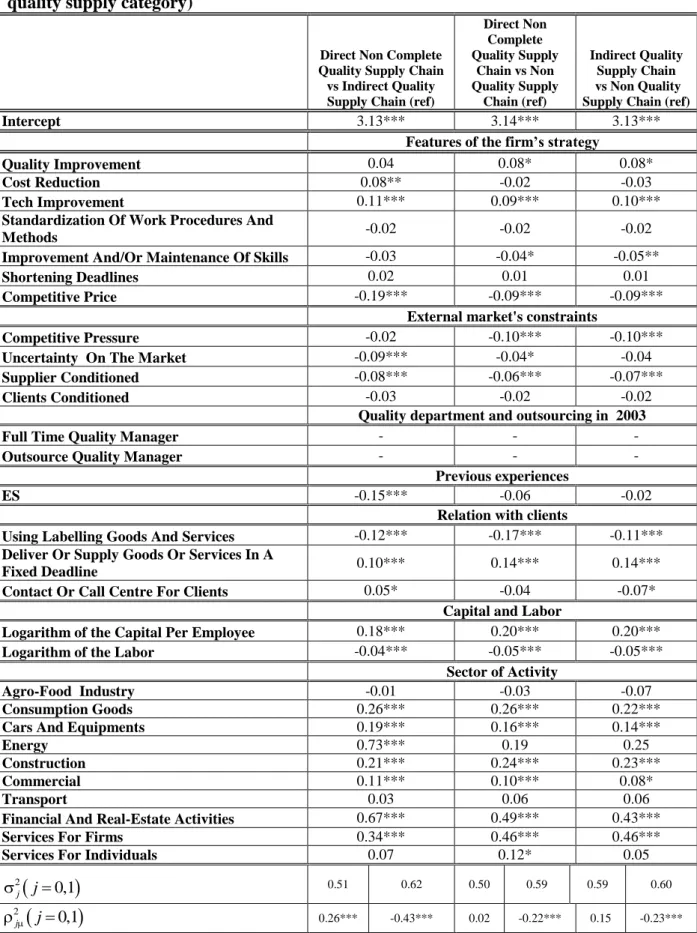
Table 4 and Table 8 present the correlation coefficients between selection equations (the choice of a specific quality supply chain) and productivity equations (0and 1). The figures obtained tell us that there is evidence of endogeneity and hence, if we omit the effect of unobservables, predicted productivity for superior and inferior quality supply chains categories would be inconsistently estimated. Thus, we may conclude that our econometric model is appropriate.
Firstly, we present the estimation results regarding the factors that may influence firms to choose one of the quality supply chain categories (Tables 2 and 6). Generally, standardization, previous experience, relation with clients, capital and labor are significant and confirm previous studies (e.g. Pekovic, 2010; Terlaak and King, 2006). Unexpectedly, other variables representing features of the firm‟s strategy and external market‟s constraints were found to have no impact on firm‟s choice to become member of superior quality supply chain category. A possible explanation for this finding could be that if all “win-win” or “free-lunch” opportunities have already been exploited (Pekovic, 2010; Palmer et al., 1995), those firms may then be focused on the improvement of other areas. Furthermore, the results indicate that firms in sectors such as agro-food, cars and equipments and service for individuals are mostly willing to become a member of superior quality supply chain category. Finally, as expected our instrumental variables are positive and significant determinants of the firm‟s choice to become a member of superior quality supply chain category.
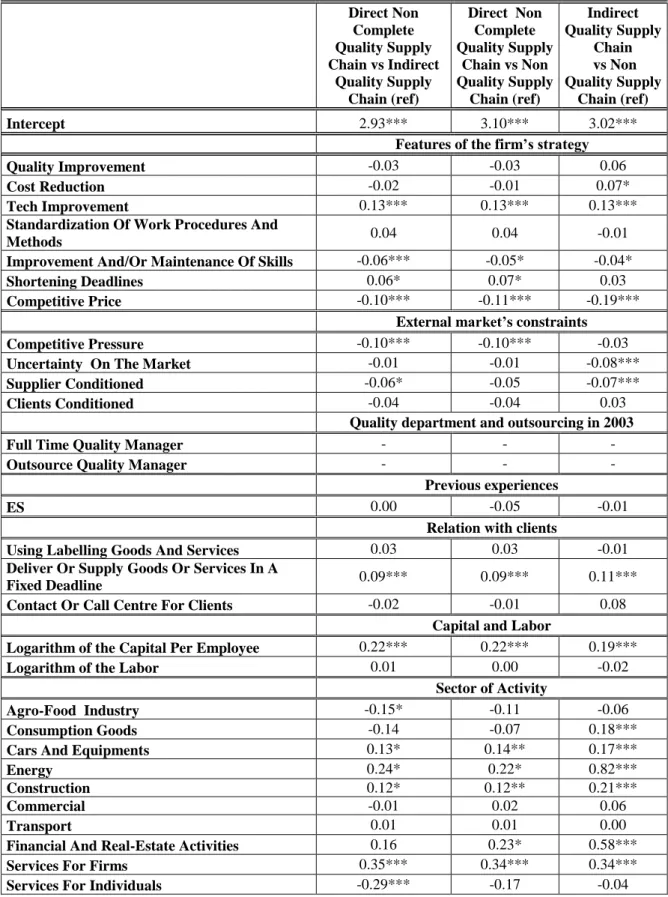
The second stage results define factors that may impact the logarithm of the value added per employee for superior quality supply chains categories (Tables 3 and 7) while the third stage results define factors that influence logarithm of the value added per employee for inferior quality supply chain categories (Tables 4 and 8). Generally, the factors that influence the firm‟s productivity are similar for both stages and they are consistent with previous researches concerning the positive impact of features of the firm‟s strategy, environmental standards, relation with clients, capital and labor on firm‟s productivity (e.g. Galdeano-Gómez and
Céspedes-Lorente, 2008; Zwick, 2004; Black and Lynch, 2001; Greenan and Mairesse, 2000; Anderson et al., 1997). Surprisingly, external market‟s constraints mainly influence negatively firm‟s productivity. This could be explained by the fact that higher external pressure does not allow firms to better allocate different resources what results in productivity decrease. Additionally, firms could be under greater pressure to perform well when there is a major stakeholder (such as supplier or customer), since major stakeholder could employ a significant degree of control over the operations of the firm. Concerning sector of activity, we may conclude that being a part of a specific sector increase firm‟s probability to improve its productivity (e.g. commercial, energy, financial and real-estate activities and services for firms).
The results obtained from the comparison between firms in the Direct Complete Quality Supply Chain and the Direct Non Complete Quality Supply Chain categories (Table 5) are significant and positive. Being quality certified and dealing with a quality certified firm amplifies the positive signal while, dealing with a non-certified firm when certified decrease the positive signal. The results are going into the same direction when we compare the firms that belong to the Direct Complete Quality Supply Chain and the Indirect Quality Supply Chain categories and the firms that belong to the Direct Complete Quality Supply Chain and the Non Quality Supply Chain categories. Actually, we may conclude that firms belonging to the Direct Complete Quality Supply Chain category have superior productivity of 9% comparing to the firms that belong to the Direct Non Complete Quality Supply Chain category, 18% comparing to the firms that belong to the Indirect Quality Supply Chain category and 21% comparing to the firms that belong to the Non Quality Supply Chain category. Hence being a certified firm while having certified suppliers permits to have the strongest impact on productivity. Therefore, this confirms that firms that belong to the category of the Direct Complete Quality Supply Chain are leaders in the quality supply chain hierarchy concerning firm‟s productivity improvement.
Furthermore, concerning the firms in the Direct Non Complete Quality Supply Chain category (Table 9), we may conclude that those firms are in a more profitable position comparing to the firms in the Indirect Quality Supply Chain or Non Quality Supply Chain categories. More precisely, the results suggest that firms that belong to the category of Direct Non Complete Quality Supply Chain also have superior productivity of 26% and 9% than firms that belong to the categories of the Indirect Quality Supply Chain and Non Quality Supply Chain, respectively.Hence, even that the suppliers of the Direct Non Complete Quality Supply Chain category are not certified, the firms‟ direct certification is enough “strong” to have a superior
impact on productivity comparing to the firms in the Indirect and the Non Quality Supply Chain categories. However, the negative effect (having none certified supplier) of a partnership dominates the positive effect (being certified) on firm‟s productivity (Costa and Vasconcelos, 2010). Hence, the Direct Non Complete Quality Supply Chain is situated on the second position inside the quality supply chain hierarchy after the Direct Complete Quality Supply Chain (the category which generates only positive effects).
The findings associated to the Indirect Quality Supply Chain category (Table 9) prove again that firms can indirectly profit from the ISO certification (via suppliers), what makes them different from the firms belonging to the Non Quality Supply Chain category. In fact, being a part of the Indirect Quality Supply Chain category is positively associated to superior productivity of 19% comparing to the firms in the Non Quality Supply Chain category. Consequently, firms in the Indirect Quality Supply Chain category are placed on the third position inside the quality supply chain hierarchy.
Finally, as firms in the Non Quality Supply Chain category do not receive a quality signal, directly or indirectly, this influences that they are situated on the last position in the quality supply chain hierarchy.
Based on obtained results, we may conclude that there is a positive relationship between the position of the quality supply chain categories inside the quality hierarchy and the impact on productivity. Hence, the productivity of the firms belonging to the Direct Complete Quality Supply Chain is higher than those of the firms belonging to the Direct Non Complete Quality Supply Chain which is higher than those of the firms belonging to the Indirect Quality Supply Chain which is higher than those of the firms belonging to the Non Quality Supply Chain. These findings suggest that being a certified firm amplifies a positive effect on the productivity of firms. In addition, owing to the Club effect, a non-certified firm dealing with certified suppliers (Indirect Quality Supply Chain) can also improve its productivity. Finally, the results of this supply chain analysis confirm empirically that the ISO standard could be conceptualized as a Club Good9.
6. Discussion and Conclusion
The existing empirical literature dealing with ISO 9000 standards mainly evaluates the effect of these standards on firm performance (e.g. Terlaak and King, 2006; Corbett et al., 2005).
9
The results are empirically confirmed using COI database from 1997. The results are available upon request from the authors.
Rather than simply investigating whether the ISO standard impacts positively or negatively on the productivity of firms, this paper tries to extend previous research by providing an empirical answer to the question of whether there is a positive correlation between hierarchical position of the quality supply chain categories and the impact on firm‟s productivity. Actually, our analysis highlights the subtle effects of quality standards on firm‟s performance that arise from the quality relationship between firm and its suppliers. Additionally, the contribution of this paper is the provision, through supply chain analysis, of empirical evidence demonstrating that ISO standards can be seen as a Club Good.
Since our focus is analysis in terms of quality supply chain, where members of supply chains are integrated based on best strategic solution, we have assembled datasets that aggregate different characteristics and strategies of firms and indicators of performance. We controlled for the potential endogeneity of quality supply chain categories variables using an endogenous switching model. Our findings demonstrate that there is a positive and significant relationship between the hierarchical position of the quality supply chain categories and the impact on productivity. Hence we may argue that, all other things being equal, the productivity of the firms belonging to the Direct Complete Quality Supply Chain is higher than that of the firms belonging to the Direct Non Complete Quality Supply Chain which are higher than those of the firms belonging to the Indirect Quality Supply Chain firms which are higher than those of the firms belonging to the Non Quality Supply Chain.
The evidence we accumulated indicates that adopting the ISO 9000 standard per se does not raise productivity to the same degree as when firms also deal with suppliers that are quality certified. It is this combination that seems to matter most for productivity. Policymakers can emphasize this benefit in order to encourage firms to choose quality certified suppliers. Moreover, we show that firms which are not ISO certified will, if they have ISO certified firms as suppliers, profit from this partnership, generating a positive signal on the market through their certified suppliers. Hence, cooperation among firms and suppliers permits firms in Indirect Quality Supply Chain category to benefit from supplier knowledge and experience about quality and therefore improve their performance as compared to firms in Non Quality Supply Chain category. This shows that a key objective for these firms is to establish a good relationship with suppliers in order to assure continuous improvement of their performance. A quality production and distribution strategy for supply chain networks plays a key factor in enhancing firm‟s performance. Actually, we may conclude that strong relationships with supplier will lead to faster development and performance improvement.
The evidence of this paper suggests that having multiple quality affiliations improves productivity more significantly than having only one affiliation (Eriksson and Jacoby, 2003). From a theoretical perspective, our findings underline the importance of supply chain in the process of performance improvement. Participating in quality supply chain offers opportunities and creates skills necessary for better productivity. Having multiple ties generates large amounts of information, including new information that competitors may not possess (Podolny and Baron, 1997).
In point of fact, our empirical analysis shows that the productivity of a firm depends on the performance of other firms upstream in its supply chain.
Even though the objective of this paper is not to evaluate the impact of ISO certification on firms‟ economic performance, given that we have identified a statistically and economically significant effect of certification for firms in Direct Complete Quality Supply Chain and Direct Non Complete Quality Supply Chain categories on productivity (all other things being equal), we may also conclude that the ISO 9000 standard is positively associated with productivity improvement (all other things being equal).
Moreover, this paper poses an important theoretical question as to whether the number of firms which are ISO certified is equal to the Pareto optimal number of ISO certified firms. This question is not trivial. At first glance, due to the existence of external factors, the answer could be a negative one (i.e. the number of firms which are ISO certified is lower than the Pareto optimal number of ISO certified firms). However, since there is no „poaching effect‟ (i.e. the firms which are not ISO certified also have to pay an additional cost in order to have ISO certified suppliers), the firms which are not ISO certified directly have in some sense internalized the external effects in their behaviour. Hence, it may be the case that the number of firms which are ISO certified is equal to the Pareto optimal number of ISO certified firms. Another research avenue is to understand why firms in the Direct Non Complete Quality Supply Chain category choose to have suppliers that are not certified when such a partnership is doing significant damage to their performance. Additionally, research on this issue should be extended in an international setting since the implementation of management practices depends also on a country‟s institutional framework (Pekovic, 2010). Some countries may implement those practices following “involvement way” rather than “intensification way” which may explain different findings across countries. Finally, in order to generalize better our conclusion supporting a positive correlation between hierarchical position of the quality supply chain categories and the impact on firm performance, it will also be interesting to examine additional indicators of firm performance other than productivity. The choice of
performance measures matters since they mediate the relation between the firm‟s probability of choosing to become one of the categories of quality supply chain and firm performance.
References
Acemoglu, D., Aghion, P., Lelarge, C., Van Reenan, J. and Zilibotti, F. 2007. Technology, Information and the Decentralization of the Firm. Quarterly Journal of Economics 122(4): 1759-1800.
Aghion, P., Dewatripont, M. and Rey, P. 1999. Competition, financial discipline and growth. Review of Economic Studies 66: 825-52.
Anderson, E.W. and Rust, R.T. 1997. Customer Satisfaction, Productivity, and Profitability: Differences Between Goods and Services. Marketing Science 16(2): 129-145.
Anderson, S.W., Daly, J.D. and Johnson, M.F. 1999. Why firms seek ISO 9000 certification: Regulatory compliance or competitive advantage? Production and Operations Management 8 (1):28-43.
Aubert, P., Caroli, E. and Roger, M. 2006. New Technologies, Organisation and Age: firm-Level Evidence. Economic Journal 116:73-93.
Baiman, S., Fischer, P.E. and Rajan, M.V. 2000. Information, contracting and quality costs. Management Science 46(6):776-789.
Beck, N. and Walgenbach, P. 2005. Technical Efficiency or Adaptation to Institutionalized Expectations? The Adoption of ISO 9000 Standards in the German Mechanical Engineering Industry. Organization Studies 26(6):841-866.
Black, S.E. and Lynch, L.M. 2001. How to Compete: The Impact of Workplace Practices and Information Technology on Productivity. The Review of Economics and Statistics 83(3):434-445.
Bottasso, A. and Sembenelli, A. 2001. Market power, productivity and the EU single market program: evidence from a panel of Italian firms. European Economic Review 45(1):167-86. Bramoullé, Y. and Kranton, R. 2007. Public Goods in Networks. Journal of Economic Theory 135:478-494.
Corbett, C.J., Montes-Sancho M.J. and Kirsch D.A. 2005. The Financial Impact of ISO 9000 Certification in the US: An Empirical Analysis. Management Science 51:1046-1059.
Costa, L.A. and Vasconcelos, L. 2010. Share the Fame or Share the Blame? The reputational implications of partnerships. Journal of Economics and Management Strategy 19(2): 259-301. Creane, A. 2008. Input Suppliers, Differential Pricing and Information Sharing Agreements.
Cusumano, M.A. and Takeishi, A. 1991. Supplier relations and management: A survey of Japanese, Japanese-transplant, and U.S. auto plants. Strategic Management Journal 12(8): 563-589.
Delmas, M. 2000. Barriers and Incentives to the adoption of ISO 14001 in the United States. Duke Environmental Law and Policy Forum Fall, 1-38.
Delmas, M. and Montiel, I. 2009. Greening the Supply Chain: When is Customer Pressure Effective? Journal of Economics and Management Strategy 18(1):171-201.
Dyer, J.H. and Nobeoka, K. 2000. Creating and managing a high performance knowledge-sharing networks: The Toyota case. Strategic Management Journal Special Issue 21:345-367. Erickson, C. and Jacoby, S. 2003. The effects of employer networks on workplace innovation and training. Industrial and Labor Relations Review 56(2):203-223.
Galdeano-Gomez, E. and Cespedes-Lorente, J. 2008. Environmental spillover effects on firm productivity and efficiency: an analysis of agri-food business in Southeast Spain. Ecological Economics 67:131-139.
Godard, J. and Delaney, J. 2000. Reflections on the “High Performance” Paradigm‟s Implications for Industrial Relations as a Field. Industrial and Labor Relations Review 53:482 -502.
Greenan, N. and Mairesse, J. 2000. Computers and productivity in France: Some evidence. Economics of Innovation and New Technology 9: 275-315
Greenan, N. and Mairesse, J. 2006. Réorganisation, changements du travail et renouvellement des compétences. Revue Economique Special Issue 57.
Grolleau, G., Mzoughi, N. and Pekovic, S. 2007. Chemical Firms‟ Registration for the Responsible Care Program and the ISO 14001 Standard: A Comparative Approach. Economics Bulletin 12:1-13.
Hackman, J.R. and Wageman, R. 1995. Total quality management: empirical, conceptual and practical implications. Administrative Science Quarterly 40(2): 309-342.
Hult, G.T.M., Ketchen, D.J. and Slater, S.F. 2004. Information processing, knowledge development, and strategic supply chain performance. Academy of Management Journal 47 (2):241-253.
Hult, G.T.M., Ketchen, D.J. and Arflet, M. 2007. Strategic supply chain management: Improving performance through a culture of competitiveness and knowledge development.
Ichniowski, C. and Shaw, K. 1995. Old dogs and new tricks: determinants of the adoption of productivity-enhancing work practices. Brookings Papers on Economic Activity, Special Number 1-65.
Kollman, K. and Prakash, A. 2002. EMS-Based Environmental Regimes as Club Goods: Examining Variation in Firm-level Adoption of ISO 14001 and EMAS in UK, US, and Germany. Policy Sciences 35:43-67.
Levine, D.I. 1995. Reinventing the Workplace: How Business and Employees Can Both Win. Brookings Institution, Washington, DC.
Lin, N. 1999. Social Networks and Status Attainment. Annual Review of Sociology 23:121-145.
Lo, C.K.Y., Yeung, A.C.L. and Cheng, T.C.E. 2008. ISO 9000 and Supply Chain Efficiency: Empirical Evidence on Inventory and Account Receivable Days. International Journal of Production Economics DOI:10.1016/j.ijpe.2008.11.010.
Maddala, G.S. 1983. Limited-Dependent and Qualitative Variables in Econometrics. Cambridge University Press.
Olhager, J. and Selldin, E. 2002. Enterprise resource planning survey of Swedish manufacturing firms. European Journal of Operational Research 146(2):365-373.
Palmer, K., Oates, W.E. and Portney, P. 1995. Tightening Environmental Standards: The Benefit-Cost or No-Cost Paradigm. Journal of Economic Perspectives 9(4):119-132.
Pekovic, S. 2010. The Determinants of ISO 9000 Certification: A Comparison of the Manufacturing and Service Sectors. Journal of Economic Issues DOI:10.2753/JEI0021-3624440403.
Podolny, J.M. and Baron, J. 1997. Resources and Relationships: Social Networks and Mobility in the Workplace. American Sociological Review 62:673-693.
Potoski, M. and Prakash, A. 2005. Green Clubs and Voluntary Governance: ISO 14001 and Firms‟ Regulatory Compliance. American Journal of Political Science 49(2):235-248.
Prakash, A. 1999. A New-Institutionalist Perspective on ISO 14000 and Responsible Care. Business Strategy and the Environment 8:322-335.
Reyniers, D.J. and Tapiero, C.S. 1995. The delivery and control of quality in supplier-producer contracts. Management Science 41(10):1581-1589.
Spence, M. 1973. Job market signalling. Quarterly Journal of Economics 87(3):355-374. Teece, D.J. 1986. Profiting from technological innovation: Implications for integration, collaboration, licensing and public policy. Research Policy 15(6):285-305.
Terlaak, A. 2001. The effect of ISO 9000 on operational and environmental performance: is there one? University of California-Santa Barbara, Working Paper.
Terlaak, A. and King, A. 2006. The effect of certification with ISO 9000 Quality Management Standard: A signalling Approach. Journal of Economic Behaviour and Organization 4:579-602.
Table 1: Definition of variables (N=10 268)
Variable Definition Mean SD Min Max
Dependent variables
PRODUCTIVITY Logarithm of Value Added per employee (Continuous variable) 3.83 0.64 -2.18 7.78 Independent variables DIRECT COMPLETE QUALITY SUPPLY CHAIN
The firm is registered for ISO 9000, EAQF, etc and the supplier is registered by quality standards or quality control procedure
Dummy variable (=1 if firm and supplier- yes) 0.35 0.48 0.00 1.00 DIRECT NON COMPLETE QUALITY SUPPLY CHAIN
The firm is registered for ISO 9000, EAQF, etc and the supplier is not registered by quality standards or quality control procedure
Dummy variable (=1 if firm-yes and supplier-no)
0.13 0.34 0.00 1.00
INDIRECT
QUALITY SUPPLY CHAIN
The firm is not registered for ISO 9000, EAQF, etc and the supplier is registered by quality standards or quality control procedure
Dummy variable (=1 if firm-no and supplier-yes)
0.23 0.42 0.00 1.00
NON QUALITY SUPPLY CHAIN
The firm is not registered for ISO 9000, EAQF, etc and the supplier is not registered by quality standards or quality control procedure
Dummy variable (=1 if firm-no and supplier-no)
0.29 0.46 0.00 1.00
Control variables
ACTIVITY
The main activity of the firm: 9 dummy variables (=1 agro-food; consumption goods; cars and equipments; intermediate goods; energy; construction; commercial; transport; financial and real-estate activities; services for firms; and services for individuals respectively)
QUALDEP
The firm has quality department in 2003.
Dummy variable (=1 if yes)
0.48 0.50 0.00 1.00
QUALEXT
The firm has quality department in 2003.
Dummy variable (=1 if yes)
0.34 0.47 0.00 1.00
ES
Certified with ISO 14000, organic food labeling or fair trade
Dummy variable (=1 if certified in 2006)
0.18 0.38 0.00 1.00
EXPORT
Share of firm exportation by turnover (Continuous variable) 21789 35108 8 0.00 26260 500 QUALITY IMPROVEMENT
Quality strong or very strong strategic importance for product Dummy variable (=1 if yes)
0.97 0.18 0.00 1.00
strong strategic importance
Dummy variable (=1 if yes)Dummy variable (=1 if yes)
TECH
IMPROVEMENT
Technological improvement strong or very strong strategic importance Dummy variable (=1 if yes)
0.78 0.42 0.00 1.00
STANDARDIZATI ON
Standardization strong or very strong strategic importance
Dummy variable (=1 if yes)
0.70 0.46 0.00 1.00
SHORTENING DEADLINES
Shortening deadlines strong or very strong strategic importance
Dummy variable (=1 if yes)
0.71 0.45 0.00 1.00
COMPETITIVE PRICE
Competitive price strong or very strong strategic importance
Dummy variable (=1 if yes)
0.85 0.35 0.00 1.00
COMPETITIVE PRESSURE
Competitive pressure influences strong or very strong the choice of firm‟s organization and computerization
Dummy variable (=1 if yes)
0.42 0.49 0.00 1.00
UNCERTAINTY ON THE MARKET
Uncertainty on the market influences strong or very strong the choice of firm‟s organization and computerization
Dummy variable (=1 if yes)
0.64 0.48 0.00 1.00
CLIENTS CONDITIONED
Three main clients make up 50% of the firm‟s turnover
Dummy variable (=1 if yes)
0.26 0.44 0.00 1.00
SUPPLIERS CONDITIONED
Three main suppliers make up 50% of the firm‟s purchase
Dummy variable (=1 if yes)
0.31 0.46 0.00 1.00
LABOR Logarithm of labor (firm‟s size) (Continuous variable)
4.72 1.31 3.00 11.62
CAPITAL Logarithm of capital per employee (Continuous variable)
3.22 1.57 -2.53 10.14
LABELLING
Under customer policy firm uses labeling goods and services with certain clients
Dummy variable (=1 if yes)
0.33 0.47 0.00 1.00
FIXED DEADLINES
Under customer policy firm uses contract to assure delivery timeless Dummy variable (=1 if yes)
0.66 0.47 0.00 1.00
CONTACT-CALL CENTERS
Under customer policy firm uses contact or call centers
Dummy variable (=1 if yes)
0.50 0.50 0.00 1.00
The sectors are considered according to the French nomenclature. Source: Survey COI-TIC 2006-INSEE-CEE/Treatments CEE.