1
Enhancing Knowledge for Renewed Policies against Poverty
Working Paper n° 42
Assessing citizens’ experiences and
perceptions of health service delivery in
Ghana. A patient exit poll
Franklin Oduro
CDD
This project is funded by the European Union under the 7th Research Framework Programme (theme SSH) Grant agreement nr 290752. The views expressed in this press release do not necessarily reflect the views of the European Commission.
CDD - GHANA
Assessing citizens’ experiences and perceptions of health service delivery in
Ghana. A patient exit poll
10/11/2014
Abstract: This paper analyses the perception of the corruption and of the quality of services by the poor
based on a survey on health service delivery in Ghana. It evaluates the performance and easiness of access to medical care. We find that while the majority of users are generally satisfied with the quality of health delivery, improvements can be made to raise awareness as well as in the operation of the health programs.
Introduction
Background
Higher priority has been given to delivering health services effectively, efficiently and equitably globally in the last several decades. A common and compelling argument has been to increase the allocation of public resources to the health sector. However, a considerable amount of evidence has been amassed that demonstrates it cannot be taken for granted that allocating more budgetary resources to the health sector is sufficient to ensure enhancement or improvement in actual service delivery (Filmer and Pritchett, 1999; Filmer et al, 2000; Rajkumar and Swaroop, 2002; Gauthier and Wane, 2008). In
particular, much attention has been paid to looking at how corruption affects health care access and outcomes, and what can be done to combat such issues in the health sector.
In Ghana, various health sector reforms aimed at strengthening institutions, improving the overall health system and increasing access to healthcare services by all groups of people have been initiated over the last several decades. Whilst some progress has been made in health outcomes, the rate of change has been slow1 and several key health outcomes remain problematic. There are also serious challenges in the equity, efficiency, and overall performance of health service delivery systems (National Development Planning Commission, 2009). In addition to the above challenges, most health indicators in Ghana tend to be worse in rural than in urban regions and locations (World Bank, 2012b), indicating issues with equity when it comes to access. According to CSR-Health Ghana (2011), this unequal access to health is largely a reflection of remaining weaknesses in the health system, including those relating to pharmaceutical supply chain systems, health financing and insurance options, and remaining limitations linked to governance and infrastructure.
Osei-Akoto et al. (2013) also finds that much of the problem with inadequate access to health and poor health service delivery in Ghana has been linked to inadequate institutions and lack of accountability within the health service delivery system. In particular, corruption has been identified within the literature as a major contributor to the extremely deficient quality and delivery of health services. Ghana’s public health care system has been faced with issues of corruption. A study conducted by Agbenorku (2012) showed that corruption exists in all units of the healthcare sector in Ghana and is costly to human life. The study further revealed that 25.9% of respondents felt that the healthcare sector was extremely corrupt while 74.1% said the sector is quite corrupt. A study released by the World
Bank 2010 also indicated that leakage of resources in the provision of health care in Ghana is huge. Similarly, Transparency International in its 2006 Global Corruption report identified the health sector of Ghana as a corruption prone area with evidence of bribery and fraud across the breadth of medical services.
There has therefore been an increasing interest in good governance in health systems to promote effective delivery of health services, and how empowering citizens and civil society actors is necessary to put pressure on governments to improve performance. This study therefore assesses the extent to which demand-side failures often interact with the supply-side failures to generate a low level of public services and human development outcomes among the poor in their quest to access health serve delivery in Ghana.
Objectives of study
The main objective of the study is to assess quality of care provided by public health facilities in Ghana as mirrored by patients’ in their quest for satisfaction.
Specifically, this research seeks to:
Assess care and attention from doctors, nurses and assistant personnel
Assess the effectiveness of medical care (hygiene, feeding, and wards’ condition).
Assess the level of satisfaction of patients with care givers at public health facilities in terms of courtesy of physicians and nurses towards patients, willingness of health workers to patiently listen to patients, and waiting time in accessing health care.
Find out patients knowledge of their rights
Offer the opportunity for health sector to measure or assess performance of health institution in areas of consumer/patients protection.
Assess the relationships that exist between patients’ satisfaction of services and the awareness of their rights and how they influence each other.
Provide lessons, which all stakeholders such as government, health institutions and the patients will use to improve health services in the country for the benefit of all.
Research questions
In view of this revelation, the study seeks to find answers to the following fundamental questions.
What level of quality care and treatment are out- patients receiving now that health care is very accessible?
Are patients satisfied with the services they receive from their health providers?
To what extent are customers or consumers satisfied or dissatisfied with the services they receive at public health facilities?
What are consumers’ perspectives about quality health care delivery?
What is the level of awareness of Ghanaian patients of the Patients Charter promulgated to protect their rights?
Health care services: a global perspective
Health care provision depends on efficiently combining financial resources, human resources, and supplies, and delivering services in a timely fashion distributed spatially throughout a country (Lewis, 2006). However, to ensure the health-related Millennium Development Goals are achieved, substantial improvements in the delivery and provision of health services will be necessary. While the importance
of health for development provides a strong case for allocating public resources to the health sector, a growing body of research demonstrates that it cannot be taken for granted that allocating more budgetary resources to the sector will necessarily deliver better outcomes or improve actual service delivery (Filmer and Pritchett, 1999; Filmer et al, 2000; Rajkumar and Swaroop, 2002; World Bank, 2004). Filmer et al (2000), for instance, find that health spending has no significant impact on the population’s health status in most of the studies they reviewed; whilst Ablo and Reinikka (1998) note that health spending may have little impact on health status because health expenditures may not translate into improved services.
Although significant gains have been made in expanding access to health services in the past decade, the quality of those services remains a serious concern (Amin et al., 2008). Within the literature, thinking undoubtedly has been that very serious barriers to health service deliveryexist and these have been the main causes of inequitable access, impoverishing costs, and erosion of trust in health care systems. According to Osei-Akoto et al. (2013), barriers that have often been discussed include: unavailability of health services (in terms of distance and travel time), financial (cost of services), perceived quality of service, and socio-cultural factors. They note that in developing countries, too often services fail to reach the people, as they are either inaccessible or prohibitively expensive, and even where they are accessible, they are often dysfunctional, extremely low in quality, and unresponsive to the needs of the diverse user.
Brinkerhoff (2004) further acknowledges that discontent has focused on costs, quality assurance, and service availability/access, equitable distribution of services, abuses of power, financial mismanagement and corruption, and lack of responsiveness. Lewis and Petterson (2009) state that in health care systems, poor governance accounts for much of the inefficiency in service provision, and in some cases results in no service at all. According to them, weak governance structures are characterized by low capacity to plan, allocate and execute budgets; weak internal controls; poor management and supervision of funds; absence of external accountability (including audits); and distorted incentives that increase the opportunity for mismanagement and fraud, all of which affect the funding received by health service providers, and therefore the delivery of health services. What this highlights is the vulnerability of the health sector to various forms of corruption.
Theoretical literature identifies corruption as a complex problem which threatens health care access, equity and outcomes. In the public health system, corruption reduces the resources effectively available for health, lowers the quality, equity and effectiveness of health care services; decreases the volume and increases the cost of provided services (Nordberg and Vian, 2008). This in effect discourages people to use and pay for health services and ultimately has a corrosive impact on the population’s level of health. Gupta et al. (2000) identifies three channels through which corruption can adversely affect the provision of health services. First, corruption can drive up the price and lower the level of government output and services, including the provision and financing of health care. Second, corruption can reduce investment in human capital. Finally, corruption can reduce government revenue, which in turn can lower the quality of publicly provided services. The latter further discourages some individuals from using these services and reduces their willingness to pay for them (through tax evasion), which shrinks the tax base and diminishes the government’s ability to provide quality public services.
Risks of corruption in the health sector are uniquely influenced by several organizational factors (Vian, 2007). As Savedoff (2006) explains, the health sector is particularly vulnerable to corruption due to: uncertainty surrounding the demand for services (who will fall ill, when, and what will they need); many dispersed actors including regulators, payers, providers, consumers and suppliers interacting in complex ways; and asymmetric information among the different actors, making it difficult to identify and control for diverging interests. In addition, the health care sector is unusual in the extent to which private providers are entrusted with important public roles, and the large amount of public money allocated to health spending in many countries (Savedoff, 2006). According to the UNDP (2011), among the key reasons for corruption in the health sector are weak or non-existent rules and regulations, over-regulation, lack of accountability, low salaries and limited offer of services (i.e., more demand than supply). Amongst the most common corrupt practices in the health sector identified include absenteeism and leakage of public resources.
worker productivity and undermines health service quality (WHO, 2006). Extensive absenteeism can result in lower volume of health care, poor quality of care, and increased costs to the health system (Lewis and Petterson, 2009). According to the World Bank (2003), high levels of provider absence are an indicator of general shortcomings in accountability within the health system. Vujicic et al. (2009) suggest that unexcused absences within the health workforce perpetuate in part because there are insufficient governance mechanisms to address the underlying issues. Lewis and Petterson (2009) further state that pervasive physician and nurse absenteeism in developing countries is symptomatic of governance failure due to little or no accountability to the healthcare facilities that employ them, or to patients. In 2002-2003, the World Bank carried out a major multi-country research project on measuring absence in the health sector and understanding its foundations. The findings were eye-opening to many people: absence rates averaged 35 percent among medical workers in the six countries, and were far higher still in some Indian states (Chaudhury et al., 2006). Higher absence was closely correlated with poor incentives and weak accountability. In the clinics, doctors, including medical officers in charge, were more likely to be absent than other health workers. They also were more likely to be involved in other moneymaking enterprises such as a private practice, suggesting that they had an incentive to be absent and little fear of being held accountable. By contrast, higher salaries were not associated with better attendance. For Chaudhury et al. (2006), this not surprising, as salaries of teachers and medical providers are typically based on education and seniority, not on performance, and hence provide little incentive for attendance.
According to the UNDP (2011), the reasons for absenteeism are complex and may include a lack of motivation, poor quality of health worker education, lack of qualifications or understanding of one’s own role/responsibilities as a health worker, parallel accountability structures, and a lack of merit-based hiring practices. Building on Lewis and Pettersson’s (2009) definition of governance, Deussom et al. (2012) further suggest that the reasons for absenteeism can be attributed to a breakdown in one or more of these fundamental elements: standards, incentives, information, and accountability. These refer to the failure of the system to meet health worker and facility standards, ineffective health worker incentives, insufficient information and lack of accountability.
The leakage of public resources is another form of corruption that severely hampers the provision of health services in many ways. Gauthier and Wane (2008:58) define leakages as “how much the intended beneficiaries received versus how much they should have received as given by resources earmarked for them”. As emphasized by Reinikka and Svensson (2004), there could be significant differences between official spending in a sector and actual spending at the provider level due to capture and leakage of funds by the various layers of the political and administrative apparatus. Lewis and Petterson (2009) also find that weaknesses in budget management can result in funds never arriving at their intended destination due to mismanagement or theft. And, where allocated health funding is not disbursed, or is diverted en route from the point of disbursement to health facilities, health service delivery tends to suffer. High leakage also means inadequate funding for non-salary spending, which makes the job of service delivery exceedingly difficult and necessarily imposes on patients to finance “free” health care through financial or in-kind contributions (Lewis, 2006).
An expenditure track carried out in 2004 showed that health centres in Chad received less than 1% of non-wage funds specifically set aside for them by the Ministry of Health (Gauthier and Wane, 2008). So while the government officially allocated 680 CFAF (US$1.17) in health expenditures for the average Chadian, that person actually received less than 10 CFAF (US$0.02). The study further found that the poor suffered the most due to higher out-of-pocket expenses incurred while purchasing expensive medication. Lewis and Petterson (2009) thus suggest budget leakages are another indicator of governance failure due to some combination of lack of incentives to track funds, weak information systems that thwart the ability to ensure that funds reach providers, and absence of mechanisms to hold officials to account. They suggest that improving governance and thereby discouraging corruption in health systems should thus aim to increase the efficiency of health services so as to raise performance, and ultimately, improve the health status of the population.
Strategies to strengthen health services are aimed at improving the provision, quality, utilization, coverage, efficiency, and equity of health services, usually with an implicit intent to improve effectiveness in terms of achieving the intended health outcomes (World Bank, 2009). According to
Lewis (2006), good governance is a critical factor in making such a health system function.
Governance in the health sector is increasingly regarded as a salient theme on the development agenda. The increased interest in governance has been driven by the need for greater accountability, arising from both increased funding and a growing demand to demonstrate results (WHO, 2008a). Amin et al. (2008) states that strengthening accountability and supporting governance reforms in service delivery is a major priority area that needs to be addressed. Accountability has taken on a high degree of importance because the size and scope of health care bureaucracies in both the public and private sectors accord health system actors significant power to affect people’s lives and well-being (ibid). Further, health care
Health service delivery in Ghana
Over the last several decades, health sector reforms in Ghana have been shaping and changing the health service delivery systems. Ghana has initiated various health sector reforms aimed at strengthening institutions, improving the overall health system and increasing access to healthcare services by all groups of people. Healthcare financing, one of the key barriers to access to health care in developing countries, has gone through many stages in Ghana; from free healthcare at the eve of independence, to the introduction of nominal fee in the 1970s and the introduction of cost recovery mechanisms through user fees (traditionally known in Ghana as “cash and carry”) in 1985 (Osei-Akoto et al., 2013). In 1993, Ghana undertook another round of health sector reform aimed to increase equitable access to services, improve health service quality and efficiency, foster partnerships between providers and communities, and expand health-care resources (Nyonator et al., 2006). Embedded in these is an acknowledgement of the role of institutions in facilitating efficiency, effectiveness, improving linkages, and closing inequities by improving equality and quality of access (Osei-Akoto et al., 2013). A key institutional innovation in these reforms was the decentralisation of the financing, planning and management arrangements of the health sector to the district level.
1.1 Institutional and Policy Framework
The institutional responsibilities and relationships in the health sector are guided by the Civil Service Act 327; the Ghana Health Service and Teaching Hospitals Act 525, 1996; the National Health Insurance Act 650, 2003; and the Ministry of Health Organisational Manual 1998. The Ministry of Health (MoH) is the central government institution in charge of sector-wide policy development, financing, regulation, monitoring and evaluation using its agencies including Ghana Health Service (GHS), which is an executing agency responsible for health service delivery. Regional and district medical matters fall under the jurisdiction of Regional and District Health Management Teams. The MoH is organized on the basis of four distinct levels of administration: national, regional, district, and sub-district.
The health sector in 1996 adopted a Sector Wide Approach in its sector reforms; with government, partners, civil societies and the private sector all playing a part. As a result of this reform, the Ministry of Health (MoH) retained responsibility for policy formulation, monitoring and evaluation, resource mobilization and regulation of the health services delivery. The Ghana Health Service (GHS) was created to assume responsibility for service delivery and implementation of the health policies and programmes designed by the MoH.
The national level is made up of the MoH, which holds responsibility for policy formulation, monitoring and evaluation, resource mobilization and regulation of the health services delivery. The second entity within the national level is the GHS, which assumes responsibility for service delivery and implementation of the health policies and programmes designed by the MoH. The GHS is also responsible for the resources allocation and the implementation of government’s health policy and regulation of state run health institutions - Government Hospitals (GHSP), Poly Clinics (PC), and Health Centres (HC). At the regional level, Regional Health Management Teams, headed by the Regional Director of Health Services coordinate planning, budgeting and service delivery for the entire region. They also monitor and provide guidance to districts. The District level is concerned with operational planning and implementation of service within the district, and is responsible for managing budgets for
service delivery for delivering primary health care services. At the sub-district level, there are: community-level health centres; health centres, health posts and rural clinics; and community-based health planning and services (CHPS). Community-level health centres provide outpatient services to relieve the district and regional hospitals of all but their most specialized functions. Health centres, health posts and rural clinics are run by community clinic attendants and function as first-aid stations and health observational posts. The CHPS is a new system of health-care delivery introduced in the country that aims to reduce barriers to geographical access to health care. With an initial focus on deprived and remote areas of rural districts, CHPS endeavors to transform the primary health care system to a program of mobile doorstep community-based and outreach services.
There is also a strong recognition of the important role of the private sector (private religious and private non-religious health institutions) in the health service delivery configuration in Ghana. The private sector is regulated by a Private Hospitals and Maternity Homes Board (PHMHB), established by Act 1958 (No. 9). Under the PHMHB come Mission-Based Providers (MBP) and Private Medical and Dental Practitioners (PMDP). Essentially, supervision of mission-based health facilities comes under a separate agency referred to as the Christian Health Association of Ghana (CHAG) and the relationship with the GHS stands as purely collaborative (Osei-Akoto et al. 2013).
1.2 Health service delivery
Even though some improvements have been gained as a result of these institutional reforms, as a higher share of health resources are allocated directly to the district level, key difficulties however remained in linking the improved management environment to service delivery and better health outcomes (Osei-Akoto et al., 2013). This thinking led to the introduction of the National Health Insurance Scheme (NHIS), a key health institution that is intended to improve access to quality health care and to reduce inequalities in health care utilisation. According to Osei-Akoto et al. (2013), this is seen as the most dynamic stage in Ghana’s health sector reforms endeavour. The overriding aim of this institutional reform is to remove financial barriers to utilization of healthcare, facilitate citizen participation and ownership of health service delivery and close the inequalities engendered by the cash and carry system.
The National Health Insurance Act, 2003 (Act 650) established the National Health Insurance Scheme (NHIS) with the aim of increasing financial accessibility to healthcare and improving the quality of basic healthcare services for all citizens, especially the poor and vulnerable. The National Health Insurance Levy was introduced in 2004, to provide ‘seed money’ for the NHIS. The levy is disguised as value-added tax charge (2.5%) on some goods and services. The law underpinning the NHIS makes membership of an insurance scheme compulsory, with households expected to make premium payments in line with their “ability to pay” (Drechsler and Juttung, 2005). It is mandatory for all residents to be members of a district mutual health scheme, a private commercial insurance scheme, or a private mutual health scheme. The benefit package under the scheme covers most services offered at the district hospital level, including inpatient hospital care, outpatient care at primary and secondary levels, and emergency and transfer services. In 2008 free maternal care was included in the range of service covered by the NHIS.
Despite a number of constraints, it has registered over 50% of Ghana’s population (WHO, 2013) and beneficial effects on health have been evident. For example, the number of infant deaths from malaria has dropped by almost a third since the scheme’s inception (KPMG, 2012). However, access to, utilization of and quality of primary health services are still very low, and there is considerable room for improving efficiency of the overall health system.
1.3 Challenges
Although Ghana has made advances in increasing service coverage, it has been recognised that the country has not yielded the anticipated improvements in health status (Whittaker et al., 1998). Whilst the health status of Ghanaians has been improving since independence, the rate of change is slow and current health service indicators are still far from desirable (Apoya, 2012). For instance, Ghana is going through an epidemiologic transition where the prevalence of non-communicable diseases is in fact increasing (WHO, 2013). Much of the problem has been linked to inadequate institutions and lack of accountability within Ghana’s health service delivery system (Osei-Akoto et al., 2013). In particular, corruption has been identified within the literature as a major contributor to the extremely deficient quality of health services.
Ghana’s public health care system has been faced with issues of corruption. A study conducted by Agbenorku (2012) showed that corruption exists in all units of the healthcare sector in Ghana and is costly to human life. The study further revealed that 25.9% of respondents felt that the healthcare sector was extremely corrupt while 74.1% said the sector is quite corrupt. In its 2006 Global Corruption report, Transparency International identified the health sector of Ghana as a corruption prone area with evidence of bribery and fraud across the breadth of medical services. This is said to have emanated from petty thievery and extortion, to massive distortions of health policy and funding, fed by payoffs to officials in the sector. Apoya (2012) also found that Ghanaian society is also saddled with “quiet corruption”, which takes the form of absenteeism, habitual lateness for work, leakage of funds, imposition of informal user fees, petty thievery (stealing of monies and office supplies) and diversion of supplies by public officers. The report of a study released by the World Bank 2010 also indicated that leakage of resources in the provision of health care in Ghana is huge. For example, it was uncovered that only 20% of funds were found to reach the non-salary budget of health facilities (Lewis, 2006). Enormous gaps remain between the potential of health systems and their actual performance. Considerable effort has been made to identify barriers to effective and efficient health service delivery with the aim of increasing access and reducing health inequalities. In particular, attention has been paid to the corrosive effect corruption has on the health sector and its ability to produce positive health outcomes. Thus, improving health outcomes requires not just boosting investment in health, but improving good governance within the sector and strengthening the capacity of health care delivery systems. Whilst adequate financing, infrastructure, human resources and equipment need to be made available, the institutions and governance structure of the health system need to be made more accountable to ensure service provision is upheld at all levels. In addition, governments will need to focus on eliminating disparities in access to, and affordability of, healthcare. This will require broader vision about how the public and private sector can work together; a greater emphasis on providing and funding primary-care services; and strategies to ensure that all citizens, including the most impoverished, have reliable and affordable methods of paying for them.
Methodology
CDD-Ghana developed an exit interview instrument to collect data on citizens’ experiences with health service delivery in public health facilities in Ghana. As noted above, the survey gathered relevant primary qualitative and quantitative information from patients and patrons of public health facilities in Ghana. This approach provided for adequate engagement of a cross-section of stakeholders on their experiences, perceptions and assessments of health service delivery in various public health facilities in Ghana.
Development of health facilities' sampling frame: In Ghana, public healthcare facilities are classified as Teaching Hospitals, Regional Hospitals, District Hospitals or Health Centers and all the ten administrative regions of the country have one type of these facilities or another. However, these facilities are not evenly distributed. The distribution of these public health facilities across the ten regions per information obtained from the Ghana Health Service (GHS) health information directorate is depicted in
Table 1 below. This constituted the sampling frame for the selection of survey facilities and regions. Table 2: Sampling frame of public healthcare facilities across the country
Region Teaching Hospital Regional Hospital District Hospital Poly Clinics Health Center Maternity Homes CHIPS Compound clinics Western 1 17 2 48 75 124 Central 1 11 26 60 9 98 Greater Accra 1 1 9 8 33 17 5 Volta 1 12 1 10 213 49 Eastern 1 15 22 135 4 91 Ashanti 1 1 22 27 131 3 14 Brong-Ahafo 1 14 108 54 11 33 Northern 1 1 12 1 7 94 1 80 Upper East 1 4 31 29 94 Upper west 1 3 5 55 60 Total 3 10 119 12 317 863 28 648
Selection of survey regions and facilities for the healthcare service client surveys: The project focused on healthcare service delivery in 8 out of the 10 administrative regions (i.e. 80% of the regions in the country). However, the regions to be included in the survey were determined by the type of health facility selected through the application of a sampling procedure which targets 2 Teaching Hospitals, 2 Regional Hospitals, 4 District Hospitals and 4 Health Centers in the final sample. Each type of facility was selected independently of the others.
As shown in the Table 1 above, three regions, namely Greater Accra, Ashanti and Northern have Teaching Hospitals. The first stage in the selection was the random selection of two of these hospitals. From Table 2 below, the selected Komfo Anokye Teaching Hospital and Korle-Bu Teaching Hospital. Since these two hospitals are located in Ashanti and Greater Accra Regions, the two regions automatically assumed the status of survey regions.
Excluding the two regions where the Teaching Hospitals to be surveyed are located, five other regions have Regional Hospitals (see Table 1 above). Two of these hospitals were selected randomly from the list. As shown in Table 2, Brong Ahafo Regional Hospital and Upper East Regional Hospital located in the Brong Ahafo and Upper East Regions as their names depict were randomly selected for the survey making these regions survey sites.
Similarly, excluding the four regions already identified as survey regions, and altering the sampling procedure a bit allowed for the random selection of four District Hospitals from two regions (i.e. two per region). In Table 2, Adidome District Government Hospital and Worawora District Hospital in the Volta Region and Nadowli District Hospital and Lawra District Hospital in the Upper West Region were randomly selected, bringing the total survey facilities and regions to eight and six, respectively. In a like manner, four Health Centers, were selected from two regions to complete the target number of survey regions (i.e. 8 regions) and facilities (i.e. 12 facilities). In Table 2, Achimfo Health Centre and Tikobo No 2 Community Clinic in Western Region and Apoli CHPS and Densuano Clinic in the Eastern Region were the four health centers sampled for survey.
Table 2: Selected facilities (including regions where they are sited) and allocation of interviews Name of Facility Region Interviews per facility Number of FRAs
Komfo Anokye Teaching hospital Ashanti 150 2
Korle-Bu Teaching hospital Greater Accra 150 2
Brong Ahafo Regional Hospital Brong Ahafo 150 2
Upper East Regional Hospital Upper East 150 2
Adidome District Government Hospital Volta 75 1
Worawora District Hospital Volta 75 1
Nadowli District Hospital Upper West 75 1
Lawra District Hospital Upper West 75 1
Achimfo Health Centre Western 75 1
Tikobo No 2 Community Clinic Western 75 1
Apoli CHPS Eastern 75 1
Densuano Clinic Eastern 75 1
Total 1200 16
Allocation of Interviews to survey facilities: The target sample size for the survey was 1,200 interviews (or respondents) distributed across the 12 survey facilities located in the 8 survey regions. This figure was allocated to the four types of facilities in a way to reflect the disparities in number of clients who seek healthcare services from these facilities. For instance, Teaching and Regional Hospitals tend to receive much more clients than the others because of the availability of specialist services and the referral system. Thus, each Teaching and Regional Hospital was allocated 150 interviews whilst each District Hospital and Health Center will have 75 interviews as its allocation.
Data collection: A total of 16 Field Research Assistants (FRAs) were recruited, trained and deployed to gather data needed for the survey over a period of Eight days. Thus, on average, each FRA conducted 75 interviews over the fieldwork period.
Data management: Leveraging on its capacity and experience in the use of EDC, CDD-Ghana’s research team customized the open source data collection and management software ODK by building in consistence checks and prompts that helped to prevent FRAs from skipping questions. In addition, to prevent manipulation and providing inconsistent data, the system was built to demand GPS points at where each interview was conducted to enable verification. To cater for any open-ended question, the platform was built to allow for a close to 50 to100 words and introduce number categories with specific labels such that as FRAs enter a particular label for a particular question the system records it as such. On daily basis, the Data Manager (DM) of CDD-Ghana checked on the number of data entered by the various teams to determine if daily tasks were being met. In addition, the DM scrutinized daily data received into the system during his routine daily data cleaning. Where errors such as wrong codes, missing codes etc. were found, the DM alerted the FRSs of FRAs whose work fall short of the expected quality to send them back to rectify problems identified in their work.
Finally, CDD research officers served as roving Quality Controllers who visited Field Teams in the field. The CDD team undertook routine checks early on during deployment to ensure that FRSs were applying high and consistent standards. Following this trip, and in addition to FRSs role, CDD required Field Supervisors to make a daily telephone call to CDD to report progress, discuss problems, and receive instructions. The FRS and CDD supervisor spot-checked households to make sure the data was complete and validated. The FRS and CDD supervisors planned their coordination in a manner that enabled them to visit field teams responsible for household and local government/service providers’ surveys as well as observe the discussions as passive participants.
Key findings
Demographic characteristics of health facilities
All respondents had received health care from the medical facility they were interviewed during the survey. The health facilities surveyed were distributed as follows: teaching hospital (25%), regional hospital (25%), district hospital (25%) and health center (25%). at the health facilities, 78% of respondents were female while 22% were males. At the district facilities, 64% of respondents were female while more than a third (36%) were males. more than half (58%) of respondents in the regional hospitals were females and 42% being males. At the teaching hospitals, majority of respondents (66%) were females while a third (34%) of respondents was male.
The facilities were located in 6 out of the 10 regions in Ghana. in western region, respondents were surveyed in health facilities in the Jomoro(6%) and Aowin Suaman (6%) districts. in Eastern region, New Juaben Municipal (6%) and Birim South (6%) districts were included in the survey. in Volta region, the facilities were located at Central Tongu (6%) and Jasikan districts (6%). in Greater Accra Region, 13% were surveyed at the Accra metropolitan assembly area. in Brong Ahafo, the health facility was located at the Sunyani Municipal (13%). in Upper West, Nadoli (6%) and Lawra (6%)districts were featured in the survey while in the Upper East region, Bolgatanga Municipal (12%) was surveyed.
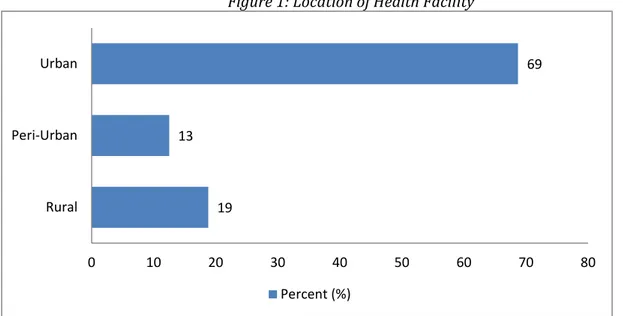
Close to 7 in 10 (69%) of the community where the healthcare facility is located was urban. Nineteen percent of the communities were rural while 13% were peri-urban. Close to 4 in 10 respondents (39%) in urban areas were males while 61% were females. in the rural areas, more than 70% of respondents were females while 28% were males.
Figure 1: Location of Health Facility
Demographic characteristics of users/respondents
Analysis of the demographic characteristics of respondents showed that 67% were female while 33% were males. Majority of respondents were within the age range of 26 to 30 years (19%) while the least age of respondents was less than 5 years (3%). Close to three-thirds of respondents (72%) within the ages of 31-40 were females while 28% were female. the gender breakdown of the ages of respondents between 21 to30 were similar to the 31- 40 ranges.
More than half (56%) of respondents (Male, 33%; females, 67%) were married and a third (33%) were single (Male, 41%; females, 59%). Another 6% (Male, 10%; females, 90%) were widowed while 3%
19 13 69 0 10 20 30 40 50 60 70 80 Rural Peri-Urban Urban Percent (%)
(Male, 27%; females, 73%) were divorced.
Education levels of respondents varied from no education to graduate levels. Close to a third of respondents (28%) (Male, 40%; females, 60%) had completed secondary education while 18% (Male, 27%; females, 73%) had never attended school. at graduate level however, more than half (59%) were males while 39% were females.
In terms of occupation of respondents, 2 in 10 (21%) (Male, 8%; females, 92%) were traders while 1 in 10 respondents were agricultural workers (14%) (Male, 34%; females, 66%), students (16%) (Male, 40%; females, 60%), and artisans (11%) (Male, 54%; females, 46%). Another 10% (Male, 21%; females, 79%) of respondents were unemployed. Some other occupations of respondents were driving, small scale mining among others.
Knowledge and awareness of NHIS
An overwhelming majority (97%) of respondents (male, 38%; female, 62%) indicated awareness of the NHIS in Ghana. About 3 %( male, 33%; female, 67%) of patients were not aware of the NHIS. Eighty-two percent of patients interviewed are members of the NHIS or actually have a membership card and 18% are neither member nor have NHIS card. Of those who are members or have the NHIS card, about 69 % are female and 31 % are male. Likewise, about 56 % of those who are not members or have card are female while 44 % represent male.
Figure 2: knowledge and awareness of NHIS
1.1 Services received by NHIS members
Seventy-three percent of respondents used their NHIS cards to access out-patient services. Six percent accessed in-patient health services, 1% had emergency healthcare services, 2 % accessed maternity care, and about 1% accessed oral health services. Six-eight percent of the out-patients are female and 32 % are male. For the in-patient, about 71 % of them are female and 29 % are male. On emergency services, 88 % of those who accessed emergency healthcare services are male as against 12 % female. As expected, all the patients who accessed maternity services were females. A fewer number of patients accessed oral health services per the survey. Females represented 60% of those who accessed oral health services while the male represent 40 %.
Figure 3: Types of services used under the NHIS
In order to be able to assess the services received using the NHIS patients were asked to assess the services they received. The results indicate that patients feel good about the services they received. Overall, 80% of patients said the services they received under the NHIS were very good or good. About 1 in ten respondents reported that the services they received under NHIS were very bad or fairly bad. About 76% of patients were very confident or somewhat confident that the NHIS is able to meet their healthcare needs. About 4% of respondents were not at all confident or somewhat confident that the NHIS is able to meet their healthcare needs.
Figure 4: Assessment of the services received using the NHIS
Figure 5: Confidence in NHIS meeting health care needs 1 73 6 1 2 1 18 0 20 40 60 80 100
None Out-patient In-patient Emergency Maternity care Oral health Not applicable
More than half of respondents indicated that they used NHIS to pay for the approved fees for the services received. About a quarter of respondents (26%) reported that they paid part in cash and part by NHIS for approved services received while close to 2 in every 10 users (17%) paid fully in cash (i.e. never have or used NHIS) for to cover approved fees for the services received.
Figure 6: Payment of approved fees for the services received using NHIS
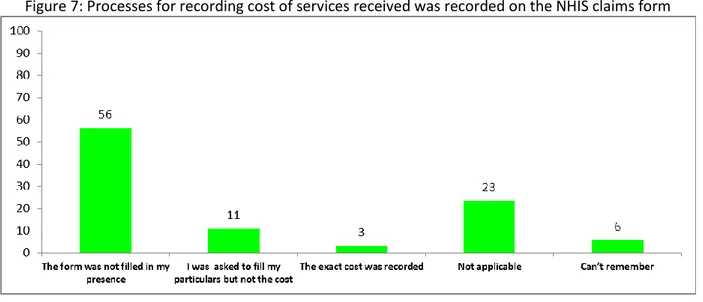
Of the respondents who indicated that they had used their NHIS cards to pay for approved fees for services received, more than half (56%) indicated that the NHIS form indicating the cost of service was not filled in their presence. One in 10 (11%) however indicated that they were asked to fill their particulars but not the cost. Only 3% of respondents indicated that the exact cost of approved serviced they received that the health facilities was recorded on the NHIS form in their presence.
Availability and access to health service
1.1 Perception of health services
Availability of medical staff (both nurses and doctors) is the one most important aspect of health services to patients in Ghana. About 64% of the patients saw the availability of nurses and doctors as important in health service delivery. Ten percent saw access to medical assistants within the facility as an important aspect of health service delivery. Another one in 10 patients identified the quality of service rendered by the medical personnel (11%) as critical to patients. Less than 1 in 10 identified availability of medication at the facility (7%) and quality of medication available at the facility (5%) as important.
For those who say availability of medical staff was important, 33% were male and 67% were female. For those who said access to medical assistants within the community was an important aspect of health delivery, 28% and 72% respectively were males and females. On quality of service rendered by the medical personnel, 41% male and 59% female of those who thought it was an important aspects of health services delivery were male and female respectively. In terms of availability of medication at the facility, 21% and 79% of those who saw it as important were males and females respectively. Thirty-three males and 67% of female said the quality of medication available at the facility was the most important issue.
1.2 Access to health services and facilities
In terms of distance patients had to travel to the nearest health facilities, 2 in 10 (20%) covered a distance of between 1 to 3 km while one in 10 (11% and 15%) covered a distance of less than 1 km and 4 to 6 km respectively before getting to the health facility. For those who travelled for less than 1 km, 28% were males and 72% were females and for 1 to 3 km, 32% were males and 68% were females.
Figure 9: Distance of health facility from the health facility in their community
Walking was the main mode of transport for patients of the health facilities surveyed. Patients who walked to the health facility were 21% while One in 10 patients used public transport [trotro/bus (17%) and (11%)] respectively. Those who used bicycle and motorcycle were 2% and 8% respectively. More than three-quarters (77%) of patients who trekked were females while the remaining quarter (23%) were males. however for those who used bicycles, more than half (55%) were males while 45% of females used bicycles. in the case of motorcycles, majority (60%) were females while 4 in 10 males used motorcycles. Majority of patients who used public buses and taxis were females (74% and 71% respectively) while about a third of users of public transport were males (26%, and 29% respectively). Aside the mode of transport of patients, researchers also sought to investigate the time patients spent to get to the health facility by their chosen means of transport. One in 10 patients used spent up to 15 minutes (18%), and 16 to 30 minutes (19%) respectively. some 10% of patients spent 31 to 45 minutes from their homes to the health facility. Less than one in 10 patients spent 46 minutes to 1 hour (8%) and over 1 hour (6%) respectively.
Figure 10: Patients’ main means of transport to health facility Figure 11: Time patients take to get to health facility
1.3 Availability of healthcare workers in healthcare facility in the past year
Two in 10 patients (22%) indicated that there were medical assistants, nurses, and doctors available at the health facility they visited in the past year. One in 10 patients however indicated that there were both doctors and nurses but no medical assistants (17%) and there were both medical assistants and nurses but no doctors (14%) respectively available at the health facility they visited in the past year. Again, less than one in 10 patients reported meeting only medical assistants but no nurses and doctors (2%) available at the health facility they visited while 4% of patients met no health worker upon arrival at the health facility they visited in the past year. Again, for those met no health worker, 19% were males and 81% were females. Among those who met only medical assistants but no nurses and doctors, 26% were males and 74% are females. Similarly, 27% and 73% of those who met both medical assistants and nurses but no doctors were male and females respectively. Yet 28% and 72% of males and females respectively arrived in the past year and there were medical assistants, nurses, and doctors. Those who said there were doctors and nurses when they arrived were made up of 20% males and 80% females in the past year.
Figure 12: Availability of healthcare workers in healthcare facility in the past year
1.4 Availability of healthcare workers in current healthcare facility
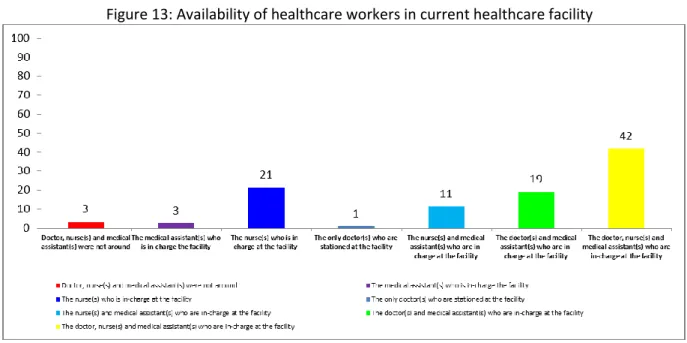
In order to find assess the availability of health workers in the current facility that patient visited, patients were asked to report on the availability of health worker(s) upon arrival at the current health facility. Like the responses on availability at the time visit in the past year, 2 in 10 patients indicated there were nurses(s) who is/are in-charge of the facility when they arrived (21%). One in 10 patients indicated that there were only nurses and medical assistants who were in-charge at the facility (11%) and doctors and medical assistants only who were in-charge at the facility (19%) respectively when they arrived. Four in 10 patients (42%) indicated that the doctors, nurses and medical assistants were in-charge at the facility when they arrived. only 3% said there were no doctors, nurses, and medical assistants in-charge of the facility when they arrived.
Figure 13: Availability of healthcare workers in current healthcare facility
Quality of health services delivery
1.1 Length of time patients takes to be diagnosed and given prescription
In terms of the time patients spent from arrival until their ailment was diagnosed, 42% reported that they spent over 1 hour from the time they arrived. One in 10 spent up to 15 minutes (10%) and 16 to 30 minutes (18%) respectively from the arrival until their ailment was diagnosed by the health workers. Another one in 10 patients spent 31 to 45 minutes (16%) and 46 minutes to 1 hour (14%) respectively from the arrival until their ailment was diagnosed by the health workers.
Figure 14: Length of time patients takes to be diagnosed and given prescription
Apart from the time that patients have to spend from arrival to the time their health issues are diagnosed, researchers sought to investigate the time patients spend with the health worker that made diagnoses and gave them prescriptions. Six in 10 patients indicated that they spent 0 to 15 minutes with the health worker that diagnosed and gave prescription. Close to a quarter (22%) however spent between 16 minutes to 30 with the health worker that diagnosed and gave prescription. Only less than one in 10 patients spent 31 to 45 minutes (5%), 46 minutes to 1 hour(4%), and over 1 hour (4%) respectively with the health worker who diagnosed and prescribed medicine.
Figure 15: Length of time patients spent with health worker that made diagnoses and gave them prescriptions
1.2 Type of health services received
An overwhelming constitute majority (87%) of respondents used Out-patients services while 13% of all patients were in-patients. The gender disaggregation showed that 34% of the out-patients were males and 66% were females. Also of the in-patients, 28% were males while 72% were females.
Figure 16: Type of health services received
1.3 Implementation of relevant aspects of patients’ charter
Six in 10 patients (65%) reported that were made to feel welcomed by the doctor, 4 % did not know whether they were welcomed or not. 10% of patients said the doctor did not make them feel welcomed. Among those who said the doctor did not make them feel welcomed, 27% were males and 73% were females whiles among those who felt welcomed, 36% were males and 64% were females. An absolute majority of patients (91%) felt welcomed by the nurses and only 7% of patients felt unwelcomed by the nurses. In the case of medical assistants, 62% reported that they felt welcomed by medical assistants while 9% did not feel welcomed by medical assistants.
Figure 17: perceptions of relevant aspects of patients’ charter
In order to investigate whether the patient right to information as enshrine in the patients charter is adhere to, researchers asked patients if the doctor, medical assistant, or nurse provided them with information about their ailment or diagnoses. An overwhelming 79% of patients reported that they were provided with information about their ailment and diagnoses while 20% indicated otherwise. The gender disaggregation showed that for those who received fully all treatment prescribed to them, 36% were males and the females made up the remaining 64%. Of those who partially received services relevant to the treatment prescribed to them, 24% were males and 76% were females. With respect to information about treatment, 86% of patients indicated that they were provided information about their treatment by doctors, nurses and medical assistants. One in 10 (13%) of patients indicated that they were not provided with relevant information on their treatment by doctors, nurses and medical assistants. On the gender perspective, those who said they were not provided with information, the male were 28% and the females were 72% whereas those who said they were given the relevant information, the males constituted 35% and the females 65%. About 89% of patients reported that they had sufficient amount of privacy during their consultation. However, about 1 in 10 (9%) of the patients said they were not provided with a sufficient amount of privacy during consultation.
Figure 18: Provision of information on medical diagnosis, treatment and privacy of care
Indeed, 81% of patients had no problems in receiving all of the healthcare services they needed while 19% had problems receiving all the healthcare services they needed. A third (33%) of the males and 67% of the females summed up to those who had no problems in receiving all the healthcare services they needed but for those who had problems in receiving all the healthcare services they needed, 35% were males and 65% were females.
Figure 19: problems in receiving all the healthcare services
Perception and experience with corruption within public healthcare service
delivery
An overwhelming majority (84%) of users indicated that they were not informed of the amount they had to pay for medical services they received before they paid for such services. One in 10 (13%) however said that they indeed were informed of the amount payable for health services before they made payments. Of those who reported that they know how much they had to pay for health services, about 8% indicated that they were informed by the health worker on duty. Another 4% said that they knew because of their previous visit to the health facility. Only 1% reported that they knew of the amount payable because it was displayed.
Figure 20: Experiences with corruption in health service delivery
84 13 3 90 5 5 0 10 20 30 40 50 60 70 80 90 100 No Yes Don't know Percent (%) Percent (%)
An overwhelming majority of respondents (90%) indicated that they had not paid any unapproved or authorized fee to receive services. less than 1 in 10 (5%) admitted to paying unapproved or authorized fee to receive health services. Of the respondents who admitted to paying unapproved fees, 3% indicated that the unproved monies were demanded from them while 2% said they paid voluntarily.
Figure 21: Process for payment of unapproved fees and levies for health services
The respondents who said they had made the unapproved payments said they did so to receive faster service (1%), to get medicine (0.3%), to get a bed (0.5%) and to get better treatment (0.3%). Of the proportion of respondents who made unapproved payments, 5% said that they paid in cash and the amounts paid ranged from 1-10 Ghana cedis (2%), and 11-20GhC (1%) . the highest amount paid ranged from more than 50GhC and a percentage (1%) reportedly made that payment.
Of the proportion of respondents who made as unapproved or unauthorized payment charges or fees, 3% reported that they received receipts which covered only authorized payments. Another 2% said that they never receive any receipt for any payment made while 0.4% indicated that they received receipts which covered both authorized and extra payments.
Introduction Access and availability of medication
For those who sought medication indication to medical care, 1 in 10 reported that they received all medication prescribed for them from the facility they visited. Five percent indicated that they did get some medication but not all medication from the medical facility they visited. Some 2% of respondents said there was not medication available at all in the pharmacy in the medical facility they visited. Less than a percentage of respondents also indicated that they got all medication from a private pharmacy because the facility they visited lacked a pharmacy.
Figure 22: Availability of medication in health facility 2 3 95 0 10 20 30 40 50 60 70 80 90 100 Voluntary Demanded of me Not applicable Percent (%) 1 2 5 10 83 0 10 20 30 40 50 60 70 80 90 100
No, got them from a private pharmacy… No, medication not available at pharmacy
Yes, but not all Yes, everything Not applicable
For those who received medication from a pharmacy within the health facility they visited, 4% reported that they waited for up to 15 minutes while another 4% waited for between 16 to 30 minutes. Another 4 % also indicated that they waited for 31 to 45 minutes before receiving your medication at the pharmacy while 2% waited for between 46 minutes to one hour.
Figure 23: Length of time spent to access medication
More than half (55%) of respondents indicated that they had not have to pay for their medication after visiting a health facility. A large minority of users (45%) however said that they had to pay for their medication after visiting a health facility. More than half (58%) of respondents said they used NHIS to make full payment for all medication. About a quarter (25%) said that they paid part in cash and part by NHIS for all medication. Some 18% or close to 2 in 10 users said that they paid fully in cash (i.e. never have or used NHIS) for all medication they got from the health facility they visited.
Figure 24: proportion of patients using NHIS to pay Figure 25: Mode of payment for health services
Interactions, grievances and redress in health service delivery
Only 19% of respondents indicated that they had encountered problems in receiving all of the healthcare services they needed. Eight in 10 (81%) reported that they had not encountered any problems in receiving all of the healthcare services they needed. The key problems users had encountered bordered on unavailability of medication (10%), shortage of staff (4%), absenteeism of staff (2%), high cost of service (2%) and rude staff (1%) (multiple response).
Overwhelming majority of respondents (84%) did not know of the existence of a complaint or redress mechanism within the facility they visited. Only 11% indicated in the affirmative that they know of the existence of a complaint or redress mechanism within the facility they visited. Only 6% of respondents had ever made a report or complaint about a problem with healthcare delivery in any health facility they had ever visited. The overwhelming 89% had not ever made a report or complaint about a problem
4 4 4 2 1 85 0 10 20 30 40 50 60 70 80 90 100 0 to 15 minutes 16 to 30 minutes 31 to 45 minutes 46 minutes to 1hour Over 1 hour Not applicable Percent (%)
with healthcare delivery in any health facility they had ever visited. Of those who had made complains, 3% had reported to the nurse on duty and 1% to the ward assistant on duty.
Figure 26: Perceptions on interactions, grievances and redress in health service delivery
Six percent of respondents who ever made complaints reported that made the compliant verbally. Only 0.4% made their complaint using a written note. Of those who ever made a complaint, 4% reported that their complaint was fully addressed. For less than a percentage, the complaint was only partially resolved (0.9%) and not resolved (0.9%) respectively. For 4% of respondents, the problem reported was addressed the very same day and for 0.1% it took up to about two weeks to resolve the problem. For those who ever made a complaint about a problem in the health facility they visited, about 5% were very satisfied or satisfied with the way the complaint was resolved. About a percentage of respondents were however not at all or not satisfied with the way the complaint was resolved.
It is worth noting that more than a third (36%) of respondents who did not make a complaint about the health facility they visited indicated that they never felt the need to make a complaint. More than 1 in 10 reported that they did not know where/who to complain to (17%) and they did not think anything would be done (12%) respectively.
Figure 27: Reasons patients failed to complain about problems with health service delivery
81 84 89 19 11 6 0 4 5 0 20 40 60 80 100
Percent (%) Percent (%) Percent (%)
No Yes Don't know
36 12 17 3.3 20.8 6.3 4.1 0 10 20 30 40 50 60 70 80 90 100
Never felt the need to make a complaint Did not think anything would be done Did not know where/who to complain to Was afraid to make a complaint Not applicable Other (specify) Don't know
Satisfaction with health facilities
1.1 Satisfaction with human resources in health facilities
Information on citizen’s satisfaction with available health services and facilities is critical to providing useful feedback to service providers.
More than 8 in 10 users (85%) (Males, 32%; Females, 68%) were very satisfied or satisfied with the availability of doctors and nurses at the various health facilities they had attended. One in 10 (12%) (Males, 45%; Females, 56%) of users were however not satisfied or not at all satisfied with the availability of doctors and nurses at the various health facilities they had attended.
A solid majority of respondents (78%) (Males, 32%; Females, 68%) were very satisfied or satisfied with the availability of other paramedic staff at the facility they had attended. One in 10 (14 percent) (Males, 36%; Females, 64%) of users were however not satisfied or not at all satisfied with the availability of availability of other paramedic staff at the facility they had attended.
More than 9 in 10 respondents (Males, 33%; Females, 67%) were very satisfied or satisfied with competence and knowledge of doctors and nurses in the health facility they had attended. Only 4 percent (Males, 45%; Females, 55%) of respondents were however not satisfied or not at all satisfied with competence and knowledge of doctors and nurses in the health facility they had attended.
Eight in 10 users (Males, 32%; Females, 68%) were very satisfied or satisfied with competence and knowledge of other paramedic staff in the health facility they had attended. Close to 1 in 10 (9%) (Males, 39%; Females, 61%) of respondents were not satisfied or not at all satisfied with competence and knowledge of other paramedic staff in the health facility they had attended.
In terms of politeness, 9 in 10 respondents (Males, 34%; Females, 67%) were very satisfied or satisfied with politeness and friendliness of doctors and nurses in the health facility they had attended. Close to 1 in 10 (9%) (Males, 34%; Females, 66%) of respondents were not satisfied or not at all satisfied with politeness and friendliness of doctors and nurses in the health facility they had attended.
Eight in 10 (81%) (Males, 33%; Females, 67%) of users were very satisfied or satisfied with politeness and friendliness of other paramedic staff in the health facility they had attended. One in 10 (10%) (Males, 33%; Females, 67%) of respondents were not satisfied or not at all satisfied with politeness and friendliness other paramedic staff in the health facility they had attended.
Nine in 10 users (Males, 33%; Females, 68%) were very satisfied or satisfied with politeness and friendliness of helpfulness of the general staff at the facility in the health facility they had attended. Less than 1 in 10 (6%) (Males, 46%; Females, 54%) of respondents were not satisfied or not at all satisfied with helpfulness of the general staff at the facility in the health facility they had attended.
1.2 Satisfaction with medication and medical facilities
A solid majority of respondents (77%) (Males, 32%; Females, 68%) were very satisfied or satisfied with availability of medication at the health facility they had attended. About a quarter (21%) (Males, 41%; Females, 60%) were however not satisfied or not at all satisfied with availability of medication at the health facility they had attended. Similarly, seventy-five percent (Males, 33%; Females, 67%) of respondents were very satisfied or satisfied with availability of equipment at the health facility they had attended. One in 10 (19%) (Males, 36%; Females, 64%) of users were however not satisfied or not at all satisfied with availability of equipment at the health facility they had attended.
With the availability of allied services such as laboratory and scan facilities, 67% of respondents (Males, 36%; Females, 64%) were very satisfied or satisfied with availability of allied services (laboratory, scan) at the health facility they had attended. Two in 10 (20%) (Males, 34%; Females, 66%) of users were not satisfied or not at all satisfied with availability of allied services (laboratory, scan) at the health facility they had attended.
Overwhelming majority of respondents (81%) (Males, 33%; Females, 67%) were very satisfied or satisfied with cost of medical treatment or care at the facility they had attended. Some 15% (Males,
37%; Females, 63%) of respondents were not satisfied or not at all satisfied with cost of medical treatment or care at the facility they had attended. Like the cost of health care, more than 9 in 10 (94%) (Males, 33%; Females, 67%) of users were very satisfied or satisfied with quality of treatment at the facility they attended. Only 6% (Males, 42%; Females, 58%) of users were not satisfied or not at all satisfied with quality of treatment at the facility they attended.
Nine in 10 (94%) respondents were equally very satisfied or satisfied with general cleanliness of health facility and its surroundings. Another 6% of users were not satisfied or not at all satisfied with the general cleanliness of health facility and its surroundings.
Nine in 10 (94%) of users were very satisfied or satisfied with overall health service delivery in their communities. Only 6% of respondents were not satisfied or not at all satisfied with overall health service delivery in their communities.
Conclusions
Knowledge, awareness and experience with NHIS
An overwhelming majority of patient (male, 38%; female, 62%) indicated awareness of the NHIS in Ghana.
Eighty-two percent of patients were members of the NHIS or actually had a membership card.
Seventy-three percent of patients used their NHIS cards to access out-patient services.
Patients rated quality of services received under the NHIS were very good or good and were very confident of NHIS being able to meet their healthcare needs.
More than half of respondents indicated that they used NHIS to pay for the approved fees for the services received. About a quarter of respondents reported that they paid part in cash and part by NHIS for approved services received while close to 2 in every 10 users paid fully in cash (i.e. never have or used NHIS) for to cover approved fees for the services received.
Availability and access to health service
Availability of medical staff (both nurses and doctors) is the one most important aspect of health services to patients in Ghana.
Walking was the main mode of transport for patients of the health facilities surveyed. Two in 10 patients walked to the health facility while One in 10 patients used public transport [trotro/bus and taxis respectively.
Doctors, nurses and medical assistants were all in-charge at the facility when patients arrived. There were only few cases where patients indicated that there were no doctors, nurses, and medical assistants’ in-charge of the facility when they arrived. In some other cases, only nurses and medical assistants were in-charge at the facility.
An overwhelming majority of respondents used Out-patients services while few were in-patients.
While majority of patients waited over an hour to see a medical staff at the health facility, only few spent more than thirty minutes with the health practitioner. Indeed, majority spent only up to 15 minutes with the health practitioner in charge of the facility.