HAL Id: hal-02163140
https://hal.archives-ouvertes.fr/hal-02163140v2
Submitted on 31 Jul 2019
HAL is a multi-disciplinary open access
archive for the deposit and dissemination of
sci-entific research documents, whether they are
pub-lished or not. The documents may come from
teaching and research institutions in France or
abroad, or from public or private research centers.
L’archive ouverte pluridisciplinaire HAL, est
destinée au dépôt et à la diffusion de documents
scientifiques de niveau recherche, publiés ou non,
émanant des établissements d’enseignement et de
recherche français ou étrangers, des laboratoires
publics ou privés.
Gram Matrices Formulation of Body Shape Motion: An
Application for Depression Severity Assessment
Mohamed Daoudi, Zakia Hammal, Anis Kacem, Jeffrey Cohn
To cite this version:
Mohamed Daoudi, Zakia Hammal, Anis Kacem, Jeffrey Cohn. Gram Matrices Formulation of Body
Shape Motion: An Application for Depression Severity Assessment. Machine Learning for the
Di-agnosis and Treatment of Affective Disorders Workshop, 8th International Conference on Affective
Computing & Intelligent Interaction (ACII 2019), Sep 2019, Cambridge, United Kingdom.
�hal-02163140v2�
Gram Matrices Formulation of Body Shape Motion:
An Application for Depression Severity Assessment
Mohamed Daoudi*
†, Zakia Hammal*
‡, Anis Kacem
†, Jeffrey F. Cohn
§†IMT Lille Douai, Univ. Lille, CNRS UMR 9189 CRIStAL, Lille, France ‡Robotics Institute, Carnegie Mellon University, Pittsburgh, PA, USA §Department of Psychology, University of Pittsburgh, Pittsburgh, PA, USA
Email: zakia [email protected]
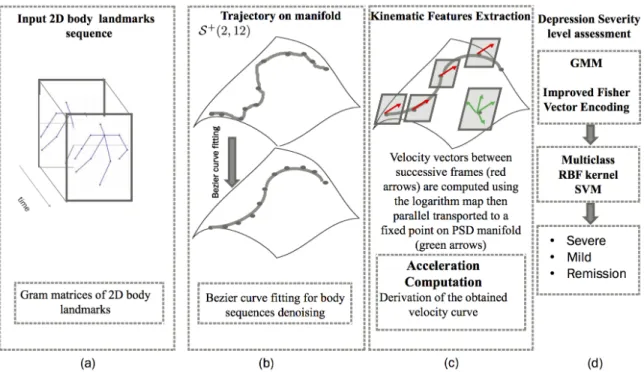
Abstract—We propose an automatic method to measure depression severity from body movement dynamics in participants undergoing treatment for depression. Participants in a clinical trial for treatment of depression were interviewed on up to four occasions at 7-week intervals with the clinician-administered Hamilton Rating Scale for Depression. Body movement was tracked using OpenPose from full-body video recordings of the interviews. Gram matrices formulation was used for body shape and trajectory representations from each video interview. Kinematic features were extracted and encoded for video based representation using Gaussian Mixture Models (GMM) and Fisher vector encoding. A multi-class SVM was used to classify the encoded body movement dynamics into three levels of depression severity: severe, mild, and remission. Accuracy was high for severe depression (68.57%) followed by mild depression (56%), and then remission (37.93%). The obtained results suggest that automatic detection of depression severity from body movement is feasible.
Index Terms—Gram matrices, body movement, dynamics, depression severity.
I. INTRODUCTION
Depression is one of the most common psychiatric disor-ders worldwide. According to the Diagnostic and Statistical Manual of Mental Disorders (DSM-5) behavioral indicators of depression include reduced facial expressiveness, decreased vocal intensity and speech, inability to sit still, pacing, hand-wringing, and slowed body movements [DSM-5]. Yet, often these indicators are not taken into account in depression severity assessment that relies almost entirely on patients’ verbally reported symptoms in clinical interviews. To improve depression severity assessment, automatic and objective as-sessment of depression from behavioral signals has emerged as a powerful option.
Most previous efforts in automatic assessment of depression severity have focused on facial expression [1], [2], voice quality and timing [3], and head pose [1], [2], [4]. For instance, Hdibeklioglu and colleagues [1] proposed a state of the art multimodal (face, head, and voice) deep learning based approach to detect depression severity in participants undergoing treatment for depression. The dynamics of facial, head, and vocal prosody was important for the measurement
* Co-first authorship: M. Daoudi and Z. Hammal contributed equally to this paper.
of depression severity, but one could not say whether the dynamics of those measures was increasing, decreasing, or varying in some non-linear way. To overcome that limitation, Kacem and colleagues [2] proposed a method to measure depression severity from facial and head movement dynamics using affine-invariant barycentric and Lie algebra representa-tion, respectively. Consistent with clinical data, the extracted kinematic features revealed that the velocity and acceleration of facial movement strongly mapped onto depression severity symptoms [2].
Although body movement also changes with depression severity (e.g., inability to sit still, slowed body movement [DSM-5]), the communicative functions of body movement dynamics in relation to depression severity have been fairly unexplored using automatic approaches. One notable excep-tion is [5]. In [5], the authors investigated body movement for the detection of depression. To do so, the authors extracted the relative orientation and radius of body parts as well as the holistic body motion measured using space-time interest points [6]. The two set of descriptors were then fused to train a support vector machine (SVM) classifier for the detection of presence from the absence of depression. From a clinical perspective, it is also critical to measure change over time in depression severity. In the continuity with the initial efforts listed above, we investigated the discriminating power of body movement dynamics for depression severity assessment.
Compared with previous efforts, including ours [1], [2], we focused on the unique contribution of body movement dynam-ics in clinically relevant participants in treatment of moderate to severe depression. The combination of body movement with other modalities (e.g., face and head [1], [2]) are subject to future work. To capture changes in the dynamics of body movement that would reflect the psychomotor retardation and agitation of depressed participants, Gram matrices formulation is used for body shape and trajectories representation. Rele-vant kinematic features are then extracted from body shape trajectories (i.e., velocities amics and accelerations). Gaussian Mixture Models (GMM) combined with an improved fisher vector encoding are then used to obtain a single vector repre-sentation for each sequence (i.e., clinical interview). Finally, a multi-class SVM with a Gaussian kernel is used to classify the encoded body movement dynamics into three depression severity levels: severe, mild, and remission. To the best of
our knowledge, this is the first time that depression severity rather than only presence from absence of depression has been measured automatically from body movement dynamics. The proposed approach is illustrated in Fig. 1.
II. PARTICIPANTS
Fifty-seven participants with moderate to severe depression (34 women, 23 men) were recruited from a clinical trial for treatment of depression [1]. At the time of the study, all met DSM-4 criteria [7] for Major Depressive Disorder (MDD). Data from 49 participants was available for analysis. Participant loss was due to change in original diagnosis (e.g., severe suicidal ideation) and methodological reasons (e.g., missing or corrupted video recordings). Symptom severity was evaluated on up to four occasions at 1, 7, 13, and 21 weeks post diagnosis and intake by four clinical interviewers (the number of interviews per interviewer varied) [1].
Interviews were conducted using the Hamilton Rating Scale for Depression (HRSD) [8]. HRSD is a clinician-rated multiple item questionnaire to measure depression severity and re-sponse to treatment. HRSD scores of 15 or higher are generally considered to indicate moderate to severe depression; scores between 8 and 14 indicate mild depression; and scores of 7 or lower indicate remission [9] [1].
Participant and interviewer were sitting face-to-face during the entire interview (see Fig. 2). Interviews were recorded using three hardware synchronized analogue cameras and two unidirectional microphones (see Fig. 2). Audio data was not used in the current paper. For video data, one camera recorded the interviewer’s shoulders and face from approximately 15 degrees to the participant’s right. Two additional cameras were positioned approximately 15 degrees to the interviewers left and right (see Fig. 2). One camera recorded the participants face and one camera recorded a full body view (see Fig. 2). In the current work, we used the data recorded from the full body view camera digitized at a frame rate of 29.97 fps (see Fig. 2). Using these data and the cut-off scores of depression severity described above, we defined three ordinal depression severity classes: moderate to severe depression, mild depres-sion, and remission (i.e., recovery from depression). The final sample from the body camera view was 89 available full body recorded sessions from 49 participants: 35 moderate to severely depressed, 25 mildly depressed, and 29 remitted.
III. AUTOMATICBODYTRACKING
We used a real-time fully-automatic multi-person 2D body tracker (OpenPose, [10]) to track body parts’ locations. Open-Pose uses a non-parametric representation (key-points asso-ciation that encodes both position and orientation of human limbs) to learn the association between body parts’ locations (i.e., Head, Shoulders, Elbows, Wrists, Hips, Knees, and Ankles, see Fig. 3) and individuals present in a given image. The tracker encodes global context, allowing a greedy bottom-up parsing step that maintains high accuracy of body parts tracking while achieving real time performance, irrespective of the number of people in the image [10]. OpenPose reliability
has been evaluated with state-of-the-art accuracy on multiple public benchmarks [10]. Table I reports the proportions of tracked video frames for each body point for all data. Valid tracking was lower for points 10 and 13 (left ad right ankles, respectively). Self-occlusion (occluded ankles) contributed to tracking failure of points 10 and 13.
Because we are interested in body points only, tracked points 14, 15, 16, 17 (i.e., eyes, nose, and ears, respectively) were not used for analyses. Because points 10 and 13 are usually not detected, they were not used for analyses. This resulted in skeletons of 12 body joints used for the analysis of body movement dynamics in participants in treatment for moderate to severe depression (for a more detailed description of the data please see section Participants).
IV. MODELINGBODYMOVEMENTDYNAMICS USING
GRAMMATRICESFORMULATION
Evolutionary theories of depression highlights symptoms of psychomotor retardation and agitation [11], [12]. We used dynamic measures of body movement to capture aspects of psychomotor retardation and agitation in participants in treatment for moderate to severe depression.
A. Frame Based Body Shape Representation
Body movement dynamics is represented using the time series of the coordinates of the 12 tracked body points (i.e., p1 = (x1, y1), . . . , p12 = (x12, y12)) during each video
sequence (see section Automatic Body Tracking). Each video sequence is thus characterized by a set of landmark configu-rations {Z0, . . . , Zτ}, where τ is the duration in frames of the
video sequence (interview). Each configuration Zi(1 ≤ i ≤ τ )
is an n × d, where d = 2 and n = 12, matrix of rank d encoding the positions of n distinct landmark points in d dimensions. We seek to measure the dynamic changes of the curves formed by the landmark configurations invariant to rotation and translation. To do so, we computed the matrix of pairwise distances between the landmarks of the same body shape (at a given frame). The measured distances are then centered by subtracting the landmarks center of mass referred to as p0. We then compute the Gram matrices as the squares
of all measured centered distances such as:
G = ZZT = hpi, pji, 1 ≤ i, j ≤ n , (1)
The Gram matrices of the form ZZT, where Z is an n × d matrix of rank d, are characterized as n × n positive semi-definite matrices of rank d. Conveniently, the Riemannian geometry of the space of these matrices, called the positive semidefinite cone S+(d, n), was well studied in [13]–[17].
B. Video Based Body Shape Trajectories
The dynamic changes of body joints movement are charac-terized by parametric trajectories on the Riemannian manifold of positive semi-definite matrices of fixed-rank (see Fig.1.a). More specifically, let βG : I → S+(d, n) defines a curve
(I denotes the time domain, e.g., [0, 1]) to model the spatio-temporal evolution of elements on S+(d, n). Given a sequence
Fig. 1. Overview of the proposed approach, (a) Automatic landmark detection for each frame of the video and Gram matrix computation, (b) Building trajectories on S+(2, n) and Bezier curve smoothing, (c) Kinematic features extraction, (d) Depression severity classification.
Points 0 1 2 3 4 5 6 7 8 9 10 11 12 13 14 15 16 17 % of tracked data 99 99 99 99 99 99 99 99 99 86 46 99 82 39 99 99 81 99
TABLE I
PROPORTION OFSUCCESSFULLYTRACKEDFRAMES FOREACHBODYPOINT(USINGOPENPOSE)
Fig. 2. Face-to-face clinical interview setup.
of landmark configurations {Z0, . . . , Zτ} represented by their
corresponding Gram matrices {G0, . . . , Gτ} in S+(d, n), the
corresponding curve is the trajectory of the point βG(t) on
S+
(d, n), when t ranges in [0, 1].
Body shape points trajectories are characterized by the curves obtained by connecting all successive Gramian repre-sentations of shapes Gi and Gi+1, 0 < i ≤ τ − 1, by
pseudo-geodesics in S+(d, n). Modeling a sequence of landmarks as a trajectory on S+(d, n) showed very promising results when
Fig. 3. Overview of OpenPose Targeted Body Points [10].
the data are well acquired (i.e., without tracking errors or missing data) [18], [19], [20]. To account for both missing data and tracking errors we apply a curve fitting algorithm (as ”smoothing” on Bezier curves [21]) on the trajectories of the Gram matrices in the manifold. More precisely, the trajectories in the manifold are considered as Bezier curves and can be generalized with the De Casteljau algorithm (see Fig.1.b).
rank matrices S+(d, n). Our goal is to approximate a Bezier
curve B to data points d0, ..., dt, with t the number of points
composing the trajectories. The control points estimated for the curve are chosen such that B is close the the data points and the mean squared acceleration is small. Therefore, the Bezier curves are composed of t Bezier functions. Let p0, ..., pt ∈
S+
(d, n) denotes the endpoints of each Bezier curve and let (b−i , b+i ) ∈ S+(d, n) × S+(d, n) denotes the right and left control points of pi. Fig.1.b illustrates Bezier curve estimation.
V. KINEMATICFEATURES ANDFISHERVECTOR
ENCODING
A. Kinematic Features
Because videos of interviews varied in length, the extracted body curves (of different videos) vary in length. This variation in the obtained curves’ lengths could introduce distortions in feature extraction. To overcome this problem, we apply a cubic spline interpolation to the obtained C(t) curves. This step results in smoother and shorter curves of fixed length. We set empirically the new length of the curve given by spline interpolation to 5000 samples for body curves. Then, we compute the velocities by computing the tangent vectors between successive frames. These can be obtained using the logarithm map with respect to the Riemannian metric of S+(d, n) introduced in [17]. More specifically, given
two successive Gram matrices C(t) = Gt = ZtZtT and
C(t+1) = Gt+1= Zt+1Zt+1T at time t and t+1, respectively,
the velocity is a vector at the tangent space of C(t) and is given by,
VC(t) = logC(t)(C(t + 1)) = Zt+1Q∗− Zt, (2)
where Q∗ is the optimal 2 × 2 rotation aligning Zt+1 and Zt
which can be efficiently computed using SVD. By doing so, the velocities will lie on different tangent spaces, i.e., each of them belongs to the tangent space of the current frame. As a solution, we use the parallel transport provided in the Manopt Toolbox [22] in order to transport all the velocities to the tangent space of a common reference frame. After that, we compute the acceleration AC(t) = ∂
2C(t)
∂t2 from the transported velocities after reducing their dimensions (see Fig.1.c). Finally, body shapes, velocities, and accelerations are concatenated as: KC(t) = [C(t); VC(t); AC(t)] , (3)
B. Fisher Vector Encoding
Our goal is to obtain a single vector representation from the kinematic curves KC(t) for depression severity assessment.
Following [23], we used the Fisher Vector representation using a Gaussian mixture model (GMM) distributions [24] (see Fig.1.d). Assuming that the observations of a single kinematic curve are statistically independent, a GMM with c components is computed for each kinematic curve by optimizing the maximum likelihood (ML) criterion of the observations to the c Gaussian distributions. To encode the estimated Gaussian distributions in a single vector representation, we use the
TABLE II
OVERALL DEPRESSION SEVERITY ASSESSMENT WITH AND WITHOUT CURVE FITTING
Method Accuracy Gram without curve fitting (89 sequences) 42.89
Gram with curve fitting (89 sequences) 54.17 TABLE III
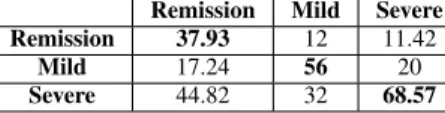
DEPRESSION SEVERITY ASSESSMENT RESULTS
Remission Mild Severe Remission 37.93 12 11.42
Mild 17.24 56 20 Severe 44.82 32 68.57
improved fisher vector encoding, which is suitable for large-scale classification problems [25]. This step is performed for kinematic curves KC(t) separately. The number of Gaussian
distributions c are chosen by a a leave-one-subject-out cross-validation and are set to 9 and the fisher vectors dimension is 12 × 2 × 2 × 2 × 9 = 864.
The set of encoded dynamic features are then fed to a multi-class SVM with a Gaussian kernel to multi-classify the extracted body movement dynamics into different depression severity levels (see Fig.1.d).
VI. RESULTS
We seek to discriminate three levels of depression severity (moderate to severe, mild, and remission) from body move-ment dynamics. To do so, we used leave-One-Subject-Out cross validation scheme. Performance was quantified using the mean accuracy over the three levels of depression severity. A multi-class SVM was used to classify the encoded body movement dynamics into three levels of depression severity.
To evaluate the reliability and effectiveness of curve fitting, we first compared the overall classification results with and without curve fitting. As shown in Table II, Gram with curve fitting performed better than without curve fitting. The obtained results can be explained by the fact that curve fitting smooths the curves without modifying the velocity and the acceleration of body movement.
Table. III shows the confusion matrix for depression severity assessment using body movement dynamics. Misclassification was more common between adjacent categories (e.g., Mild and Severe) than between distant categories (e.g., Remission and Severe). Consistent with previous findings, using the dynamics of facial and head movements [1], [2], highest accuracy was found for Severe depression (68.57%) compared to Mild (56%) and Remission (37.93%). The assessment of the unique contribution of different body joints movement for depression severity assessment is work in progress.
We evaluated the possible interpretability of the proposed kinematic features (i.e., KC(t) in Eq. 2) for depression severity
assessment. To do so, we compute the l2-norm of velocity and acceleration intensities for body (i.e., VC(t) and AC(t)) curves
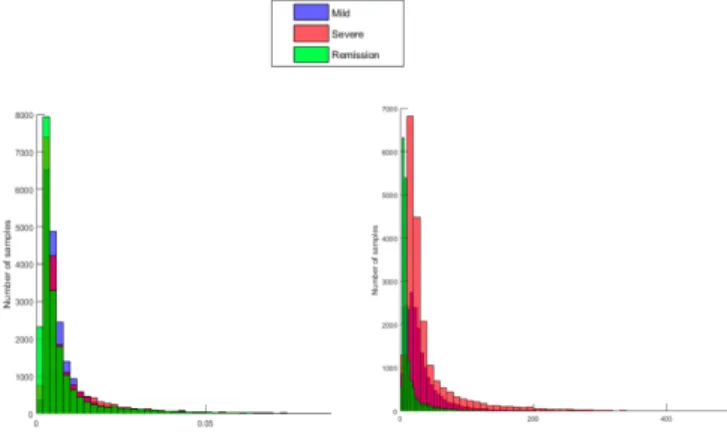
we compute the histograms of the velocity and acceleration intensities over 10 samples (videos) from each level of de-pression severity. This results in histograms of 50000 velocity and acceleration intensities for each depression level.
Fig. 4. Histograms of velocity and acceleration intensities for body move-ments.
Fig. 4 shows the histograms of body velocity and accelera-tion intensities. The level of depression severity is proporaccelera-tional to the acceleration intensity of body movement. Acceleration decreases as participants improve from severe to mild and remission. Velocity on the other hand failed to vary systemat-ically with change in depression severity. Previous automatic based studies have found that depression severity is marked by reductions in general facial expressiveness [2]. Velocity and acceleration of facial expressiveness both increased as partici-pants improved from severe to mild and then to remission [2]. On the other hand, our findings suggest that body movement is highest during severe depression and decrease during mild to remission. These results highlights symptoms of psychomotor agitation (e.g., fast or repetitive body movements) and are con-sistent with the observation that psychomotor agitation in body movements (e.g., unable to sit still, fidgeting, hand-wringing) in depression lessens as severity decreases (i.e., participants become less agitated when remitted). While encouraging, our results should be interpreted with caution given the unbalanced distribution of depression severity scores. Future research, with a larger sample, is needed to replicate our findings on the relation between depression severity and the dynamics of body movement. Finally, the next step will be to compare the relative contribution of each body joint for depression severity assessment and related dynamics changes during the course of treatment.
Overall the obtained results show that depression severity can be assessed from body movement dynamics. Because other behavioral markers (e.g., face and head movement dynamics) also showed discriminating power for depression severity assessment [1], [2], the combination of different modalities (i.e., face and head) with body movement dynamics is work under progress.
VII. CONCLUSION
We proposed a space-time geometric representation of body movement dynamics to measure depression severity. The pro-posed approach model the temporal evolution of joint points configurations as parameterized trajectories on the positive semidefinite matrices of fixed-rank. The results of proposed approach obtained in adults participants with history of chronic depression show promising results.
VIII. ACKNOWLEDGEMENTS
Research reported in this publication was supported in part by the National Institute of Nursing Research of the National Institutes of Health under Award Number R21NR016510, and the National Institutes of Health under awards MH096951 and MH51435. The content is solely the responsibility of the authors and does not necessarily represent the official views of the sponsors.
REFERENCES
[1] H. Dibeklioglu, Z. Hammal, and J. F. Cohn, “Dynamic multimodal measurement of depression severity using deep autoencoding,” IEEE J. Biomedical and Health Informatics, vol. 22, no. 2, pp. 525–536, 2018. [2] A. Kacem, Z. Hammal, M. Daoudi, and J. F. Cohn, “Detecting de-pression severity by interpretable representations of motion dynamics,” in 13th IEEE International Conference on Automatic Face & Gesture Recognition, FG 2018, Xi’an, China, May 15-19, 2018, 2018, pp. 739– 745.
[3] S. Scherer, Z. Hammal, Y. Yang, L.-P. Morency, and J. F. Cohn, “Dyadic behavior analysis in depression severity assessment interviews,” in Proceedings of the 16th International Conference on Multimodal Interaction, ser. ICMI ’14. New York, NY, USA: ACM, 2014, pp. 112– 119. [Online]. Available: http://doi.acm.org/10.1145/2663204.2663238 [4] S. Alghowinem, R. Goecke, M. Wagner, G. Parkerx, and M. Breakspear,
“Head pose and movement analysis as an indicator of depression,” in Affective Computing and Intelligent Interaction (ACII), 2013 Humaine Association Conference on, 2013, pp. 283–288.
[5] J. Joshi, R. Goecke, G. Parker, and M. Breakspear, “Can body expres-sions contribute to automatic depression analysis?” in 2013 10th IEEE International Conference and Workshops on Automatic Face and Gesture Recognition (FG), April 2013, pp. 1–7.
[6] I. Laptev, “On space-time interest points,” Int. J. Comput. Vision, vol. 64, no. 2-3, pp. 107–123, Sep. 2005. [Online]. Available: http://dx.doi.org/10.1007/s11263-005-1838-7
[7] M. B. First, R. L. Spitzer, M. Gibbon, and J. B. Williams, Structured clinical interview for DSM-IV axis I disorders - Patient edition (SCID-I/P, Version 2.0). New York, NY: Biometrics Research Department, New York State Psychiatric Institute, 1995.
[8] M. Hamilton, “A rating scale for depression,” Journal of neurology, neurosurgery, and psychiatry, vol. 23, no. 1, pp. 56–61, 1960. [9] J. C. Fournier, R. J. DeRubeis, S. D. Hollon, S. Dimidjian, J. D.
Amsterdam, R. C. Shelton, and J. Fawcett, “Antidepressant drug effects and depression severity: A patient-level meta-analysis,” Journal of the American Medial Association, vol. 303, no. 1, pp. 47–53, 2010. [10] Z. Cao, T. Simon, S. Wei, and Y. Sheikh, “Realtime multi-person 2d pose
estimation using part affinity fields,” in IEEE Conference on Computer Vision and Pattern Recognition, pages = 1302–1310, year = 2017. [11] D. C. Fowles, “A motivational theory of psychopathology,” W. D.
Spaulding (Ed.), Nebraska symposium on motivation, vol. 181-238, pp. 1–1, 1994.
[12] M. Nesse, “Is depression an adaptation?” Arch.Gen. Psychiatry, vol. 14-20, no. 1, pp. 14–20, 2000.
[13] S. Bonnabel and R. Sepulchre, “Riemannian metric and geometric mean for positive semidefinite matrices of fixed rank,” SIAM Journal on Matrix Analysis and Applications, vol. 31, no. 3, pp. 1055–1070, 2009. [14] M. Faraki, M. T. Harandi, and F. Porikli, “Image set classification by
symmetric positive semi-definite matrices,” in Applications of Computer Vision (WACV), 2016 IEEE Winter Conference on. IEEE, 2016, pp. 1–8.
[15] G. Meyer, S. Bonnabel, and R. Sepulchre, “Regression on fixed-rank positive semidefinite matrices: a Riemannian approach,” Journal of Machine Learning Research, vol. 12, no. Feb, pp. 593–625, 2011. [16] B. Vandereycken, P.-A. Absil, and S. Vandewalle, “Embedded geometry
of the set of symmetric positive semidefinite matrices of fixed rank,” in Statistical Signal Processing, 2009. SSP’09. IEEE/SP 15th Workshop on. IEEE, 2009, pp. 389–392.
[17] E. Massart and P.-A. Absil. Quotient geometry with simple geodesics for the manifold of fixed-rank positive-semidefinite matrices. Preprint. [18] A. Kacem, M. Daoudi, B. Ben Amor, S. Berretti, and J. C.
Alvarez-Paiva, “A novel geometric framework on gram matrix trajectories for human behavior understanding,” IEEE Transactions on Pattern Analysis and Machine Intelligence, pp. 1–1, 2018.
[19] A. Kacem, M. Daoudi, B. B. Amor, and J. C. ´A. Paiva, “A novel space-time representation on the positive semidefinite cone for facial expression recognition,” in IEEE International Conference on Computer Vision, ICCV 2017, Venice, Italy, October 22-29, 2017, 2017, pp. 3199– 3208.
[20] N. Otberdout, A. Kacem, M. Daoudi, L. Ballihi, and S. Berretti, “Deep covariance descriptors for facial expression recognition,” in British Machine Vision Conference 2018, BMVC 2018, Northumbria
University, Newcastle, UK, September 3-6, 2018, 2018, p. 159. [Online]. Available: http://bmvc2018.org/contents/papers/0804.pdf
[21] P.-Y. Gousenbourger, E. M. Massart, A. Musolas, P.-A. Absil, J. M. Hendrickx, L. Jacques, and Y. M. Marzouk, “Piecewise-b´ezier c1 smoothing on manifolds with application to wind field estimation,” in ESANN, 2017.
[22] N. Boumal, B. Mishra, P.-A. Absil, and R. Sepulchre, “Manopt, a matlab toolbox for optimization on manifolds,” The Journal of Machine Learning Research, vol. 15, no. 1, pp. 1455–1459, 2014.
[23] H. Dibeklioglu, Z. Hammal, and J. F. Cohn, “Dynamic multimodal measurement of depression severity using deep autoencoding,” IEEE journal of biomedical and health informatics, 2017.
[24] Z. Zivkovic, “Improved adaptive Gaussian mixture model for background subtraction,” in 17th International Confer-ence on Pattern Recognition, ICPR 2004, Cambridge, UK, August 23-26, 2004., 2004, pp. 28–31. [Online]. Available: https://doi.org/10.1109/ICPR.2004.1333992
[25] F. Perronnin, J. S´anchez, and T. Mensink, “Improving the fisher kernel for large-scale image classification,” in European Conference on Com-puter Vision. Springer, 2010, pp. 143–156.