HAL Id: hal-01073492
https://hal-imt.archives-ouvertes.fr/hal-01073492
Submitted on 10 Oct 2014
HAL is a multi-disciplinary open access
archive for the deposit and dissemination of
sci-entific research documents, whether they are
pub-lished or not. The documents may come from
teaching and research institutions in France or
abroad, or from public or private research centers.
L’archive ouverte pluridisciplinaire HAL, est
destinée au dépôt et à la diffusion de documents
scientifiques de niveau recherche, publiés ou non,
émanant des établissements d’enseignement et de
recherche français ou étrangers, des laboratoires
publics ou privés.
Video Sharing Websites Study: Content Characteristic
Analysis
Nan Zhao, Loïc Baud, Patrick Bellot
To cite this version:
Nan Zhao, Loïc Baud, Patrick Bellot. Video Sharing Websites Study: Content Characteristic
Analy-sis. The 10th IEEE RIVF International Conference on Computing and Communication Technologies
(RIVF), Nov 2013, Hanoi, Vietnam. pp.1-6. �hal-01073492�
Video Sharing Websites Study
Content Characteristic Analysis
Nan ZHAO
Télécom ParisTech Paris, France [email protected]Loïc BAUD
DREV, Hadopi Paris, France [email protected]Patrick BELLOT
Télécom ParisTech Paris, France [email protected]Abstract— In this paper we present a recent study on video
sharing websites. This study aims to understand their content characteristics. This could be useful to understand Internet users’ behaviour and manage web resources in order to provide a better video sharing service. In our work, we improved an existing graph-sampling algorithm so that it could be more adapted to sample over the video sharing websites. We crawled over 13 millions videos on YouTube and DailyMotion. We re-classified YouTube and DailyMotion content with our new category system and analysed the content category distribution and popularity of these two websites. We find that content in the “Media” category takes a large proportion in both websites, and also that the content category popularity does not depend on its proportion. Besides we then analyse the video duration and figure out that most videos on the video sharing websites are short, within several minutes. We study video count of views as well and find that the distribution of video count of views can be approximated by a negative exponential distribution that is long-tailed. That is to say, most of videos have a small or medium count of views; only a few videos can have a count of views of a bigger order of magnitude.
Keywords—video sharing service; graph sampling; website mining; information retrieving and analysis
I. INTRODUCTION
Video sharing is a type of web services which allows people to upload, share, distribute or store video content on the Internet. The type for video content can vary from a short clip to a full film. The service normally generates an embedded code for the uploaded video content, which provides user to share their video content in many ways as mail, blog or the social network. In the last decade, the video sharing service turns to one of most active web services, which brings a great raise of the traffic volume over Internet according to the study result of ipoque [1]. As the increase of the bandwidth by the ISPs grows, the Internet users can have a better on-line video performance. Thence, comparing to download video content, the Internet users prefer to enjoy the content on video sharing websites immediately. Meanwhile, the video sharing service can also provide a large space for storing the video clips free of charge or with a fee very low.
Therefore in the recent years, the video sharing service has drawn a lot of interest to Internet researchers. There are several studies with certain video sharing websites as traffic characteristics analysis [2] and some properties researches [3-6]. Those first studies of the video sharing services are very
important because they give the first opinions for exchanges of Internet traffic and consummation of video sharing service by the Internet users. However, the sampling algorithm in those prior studies can cause bias to popular videos, and as a consequence their results may be also biased. What is more, there are not many deeper studies on the content types and the distribution of video content shared on those websites. Therefore, in this paper, we present our recent study on the video sharing websites. Our study mainly concerns about video content characteristics based on a different video-sampling algorithm from those used in the existing studies. We try to figure out what kinds of videos are uploaded on the video sharing websites, how are those uploaded videos consumed by Internet users and the distribution of video duration and video count of views. The study results could be helpful for content resource management over the video sharing websites and making better video sharing service. Our work focuses on two video sharing websites, YouTube and DailyMotion, on which we studied the video characteristics. The highlights of our work could be summarized as below:
• We use a graph-sampling algorithm based on Random Walk and suggested videos supplied by the video sharing websites, which to some extent, can reduce certain effect caused by popular videos and correlations between videos.
• We then define a new category system, which is sufficiently uncorrelated and independent, and it can replace the defaulted category system given by the video sharing websites. This new system can easily be adopted by video sharing websites. With this category system, it becomes easier to compare content category distribution and popularity among different video sharing websites, which is helpful to understand users’ behaviour on video sharing.
• Finally, we find that most of videos on the video sharing websites are short videos with duration of less than 5 minutes. The distribution of videos count of views is approximated to a negative exponential distribution and it is long-tailed.
The rest of the paper is organized as follows: Section II shows prior studies of the video sharing service and the graph-sampling algorithms that could be applied for graph-sampling over the video sharing websites. We then present our experiment scenario and the adapted graph-sampling algorithm of our
study in Section III. Then we analyse our sampled video sets from YouTube and DailyMotion in Section IV. In Section V, we give our statements of our study and indicate the direction of our future work.
II. RELATED WORK
In this section, we present some prior researches. The first part concerns the studies on YouTube and DailyMotion. The second part discusses the existing graph-sampling algorithms that may be adopted for the video sampling on YouTube and DailyMotion.
A. On-line Video Sharing Study
P. Gill et al. [2] monitored YouTube traffic over a campus network. They pointed out that YouTube workload is similar to traditional Web and media streaming workloads but with caching, YouTube workload has a better performance. Cha et al. [3] used Breadth-First Sampling (BFS) [7] method to crawl YouTube to gather videos of Entertainment and Science categories. They stated that the Pareto Principle [3] could be used to analyse the distribution of the popularity of videos. Halvey and Keane [4] also used BFS to crawl videos of all categories on YouTube. They focused on interaction between the Internet users and a video search engine, and pointed that the video view distribution does not follow a Zipf-type function, yet the click of the page by the extern links is similar to a Zipf-type function [4]. Cheng et al. [5] also applied BFS algorithm to crawl the videos of YouTube: they analysed video category, video uploaded date, video rating and uploader behaviour. They found that the most videos have a moderate bitrate around 330 kbps, which is a good trade-off between quality and streaming rate. Mitra et al.’s study in [6] crawled videos from DailyMotion, Yahoo!, Veoh and Metacafe. For DailyMotion, they only crawled the “most recent” and the “most viewed” videos of the “Music” category. They analysed some issues with those crawled video sharing websites as video rate, comments, duration and popularity. They pointed that the video popularity distribution is heavy-tailed and the total videos views video is similar to Zipf-type with cut-off [6]. B. Graph Sampling
In recent years, as the researches over the online social networks increase, a few studies appeared about the graph-sampling algorithms. Some of the quite used graph-graph-sampling algorithms are as follows: Breadth-First Sampling (BFS) [7-8], Random Walk [9-10] and Metropolis-Hasting Random Walk (MHRW) [7, 11].
BFS is one of most used graph-sampling algorithms because it is easy to operate. It aims at gathering as many nodes as possible, which are close to the starting node. However, because of this, BFS is a biased algorithm and is skewed to the high-degree nodes. Random Walk is a Markov Chain algorithm, which the sampled vertex � in the graph is one of the former vertex �’s neighbours, with a transition probability of 1 �! ( �! is the degree of the vertex � ) [9]. However,
Random Walk is also skewed to high-degree nodes according to the studies in [9-11]. In order to remove the bias caused by high-degree nodes in Random Walk, MHRW proposes to add a judgement factor � between 0 and 1. If � < �! �!, where �!
and �! are the degrees of vertex � and � separately and � is a
neighbour of �, the vertex � can be sampled. On the contrary, the vertex is abandoned [11].
We find that those prior studies mostly applied BFS as the sampling algorithm, which means that their sampled video collections have a bias to high-degree nodes. This can lead to some potential biases in their analysis results for the video characteristics. In this work, the first goal is to find a suitable sampling algorithm. With this algorithm, we would like to gather a relatively random video collection, which means with a reduced or no bias caused by high-degree nodes. We will present the chosen sampling algorithm in the following section.
III. METHODOLOGY
In this section we first present the algorithm that we chose for sampling videos from YouTube and DailyMotion. Then we show the experiment environment of our work.
A. Applied Sampling Algorithm
On video sharing websites such as YouTube and DailyMotion, each video has a unique identifier. On YouTube, the identifier is a 11-character string with alphanumeric and the special symbols “-” and “_”. On DailyMotion, the identifier is a 6-character string with numbers and lowercase letters. At first, we wanted to randomly generate video identifiers to sample videos. However, on YouTube, the number of the possible video identifiers is 10!"
×16 , whereas the actual number of existing videos is about 502 million [12]. The
probability to find a video in YouTube is
502×10!
(10!"
×16) ≈ 10!!", which is why this method is
not feasible for YouTube.
We wanted to find an algorithm, which not only can reduce the bias but also can be adapted for most of video sharing websites. In that case, we thought about applying a graph-sampling method based on Random Walk on the suggested videos on the video sharing websites.
As we did not know the entire graph of YouTube nor DailyMotion, we could not use MHRW directly. However, could take the suggested videos of a video as its sub-group of neighbour nodes. So we applied Random Walk algorithm with this sub-group of neighbour nodes. In order to reduce the bias of high-degree nodes and the content correlation caused by suggested videos, we added a long walk before sampling a video. This long walk is a random 500-jump in the graph with Random Walk before taking a next sampled video. The following paragraph shows the steps of this sampling algorithm used in our work.
a) Randomly choose a node � on the graph as the staring node.
b) Crawl the page of the node � and collect all its suggested videos as its sub-group of neighbours, which we can get the sub-degree of the node � as �!′.
c) Randomly take one node from � ’s sub-group of neighbours with the probability of 1 �!′ as the next jump.
d) Each time after getting a new next jump, repeat the step b) and step c) until reaching the 500th jump .
e) Put the node of the last jump into the sampled video set and restart another sampling from the step a).
In this method, the long walk with 500 random jumps could lower the content correlation between the starting and sampled nodes to a relatively low level. Instead of taking one neighbour as a sampled video in Random Walk, with 500 random jumps, the probability to turn to a high-degree node is reduced. Thence with this algorithm, we can basically get a sampled video set, which is random and representative. However, this algorithm might cause a bias if the graph of video sharing websites is not well connected.
For the size of the sampled video set, we set 5000 for each sampled collection. Equation (1) is the relation between the size � of a collection and the desired level of precision �, which � is a coefficient related to the confidence interval, and � is the estimated proportion [13-14]. The confidence interval represents the percentage of the sampled result that can have a true population value [14]. Normally it takes the value of 95%, with the coefficient � equal to 1.96. The estimated proportion � is a value between 0 and 1, which takes 0.5 in order to get the largest sample size with a fixed desired level of precision. Thence, if we take the sampled size as 5000, the desired level of precision is 0.0139, which is small enough to prove that 95% of the sampled result has a true population value.
� =!!×!(!!!)!! (1)
B. Experiment Scenario
As shown above, a desired sampling size is 5000. That means that we have to crawl 500×5000 = 2.5×10!
videos over the graph for each samples collection. The sampling algorithm was implemented in Java. We also installed a server that connects to a SQL server to store the sampled videos. Instead of downloading each video, we retrieved the video metadata such as video ID, title, count of views, duration, category and uploaded date. We did not store the data concerning uploader’s name or video description, for privacy concerns.
In our work, we collected 4 video sets for YouTube, with one set of 3300 videos for the content category study; the others 3 sets of 5000 videos for the other video-sharing properties study. DailyMotion as a comparison study to YouTube, we took one set of 3000 videos for the content category study; and one set of 5000 videos for the other video-sharing properties study.
IV. SAMPLING RESULT ANALYSIS
In this section, we analyse the sampled videos from YouTube and DailyMotion. Firstly we focus on the content category distribution and popularity. Contrary to prior works, we do not use the default category system offered by the video-sharing websites; we rather implement a new category system. Secondly we analyse other content characteristic as video duration and video count of views.
A. Video Content Category
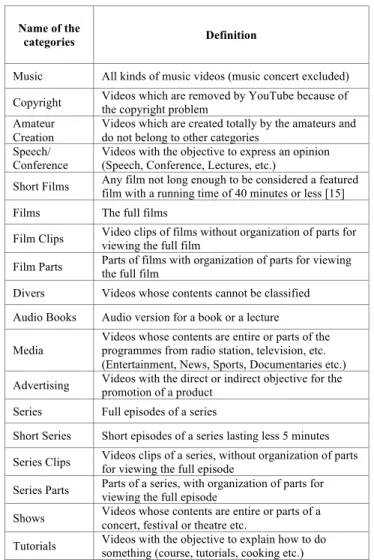
TABLE I Our New Category System
Name of the
categories Definition
Music All kinds of music videos (music concert excluded) Copyright Videos which are removed by YouTube because of
the copyright problem Amateur
Creation
Videos which are created totally by the amateurs and do not belong to other categories
Speech/ Conference
Videos with the objective to express an opinion (Speech, Conference, Lectures, etc.)
Short Films Any film not long enough to be considered a featured film with a running time of 40 minutes or less [15] Films The full films
Film Clips Video clips of films without organization of parts for viewing the full film
Film Parts Parts of films with organization of parts for viewing the full film
Divers Videos whose contents cannot be classified Audio Books Audio version for a book or a lecture
Media
Videos whose contents are entire or parts of the programmes from radio station, television, etc. (Entertainment, News, Sports, Documentaries etc.) Advertising Videos with the direct or indirect objective for the
promotion of a product Series Full episodes of a series
Short Series Short episodes of a series lasting less 5 minutes Series Clips Videos clips of a series, without organization of parts
for viewing the full episode
Series Parts Parts of a series, with organization of parts for viewing the full episode
Shows Videos whose contents are entire or parts of a concert, festival or theatre etc.
Tutorials Videos with the objective to explain how to do something (course, tutorials, cooking etc.)
a.
The content category is one of the properties of the video sharing service. It can be taken as an index on the video sharing website to find interesting content for users. Each video sharing website has its own category system. For example, the category system of YouTube is as follows: Cars & Vehicles, Comedy, Education, Entertainment, Film & Animation, Gaming, Howto & Style, Music, News & Politics, Non-profits & Activism, People & Blogs, Pets & Animals, Science & Technology, Sport, Travel & Events. However, since each video sharing website has its own categories, it is quite difficult to compare the category distribution and popularity among different video sharing websites. Besides, there exists a correlation between any of two default categories. As in the category system of YouTube, the category People & Blogs is an ambiguous category whose content can be either education, travel or style things. Additionally, we also find that most of the sampled videos have more than one category, and even some videos do not correspond to their categories. In that case, in order to avoid the inaccuracy and the overlap of categories, we propose a simple yet robust category system that could be adopted by most of video sharing websites. TABLE Ι shows our newly defined category system. This newly defined category system is comprehensive as it includes all types of content. This newly defined category system is also uncorrelated as each of the categories is independent from the others. Each video can be
re-classified with one of those categories, which avoids the category correlation for videos. Meanwhile, this new defined categories are compatible with most of video sharing websites, which means videos from different video sharing websites can be re-classified within the same category system. This allows the comparison of category distribution and category popularity of different video sharing websites, which is helpful to understand the users’ behaviour of different video sharing websites.
We reset the video content sampled from YouTube and DailyMotion manually and objectively with this new category system. In order to shorten resetting time, we use a collection of about 3000 videos from both of the two video sharing websites for this content category study.
b.
Fig. 1. Content category distribution of YouTube and DailyMotion
Fig. 1 shows the general content category distributions of YouTube and DailyMotion. From Fig. 1, we can see that although both YouTube and DailyMotion are video sharing websites, they do not have the same content category distribution. In YouTube we can see that the first three categories are Amateur Creation (22.60%), Media (22.18%) and Music (13%). While in DailyMotion, the first three categories are Media (37.52%), Speech/Conference (12.40%) and Amateur Creation (10.89%). The category Music with a big proportion in YouTube only takes 6.54% in DailyMotion. This implies that YouTube and DailyMotion have different content tendencies. On YouTube, the biggest category of sampled videos is Amateur Creation, while the same category in DailyMotion just takes 10.89%. This means that YouTube is more skewed to the self-made videos than other professional videos and shows that YouTube users tend to upload self-created content. Additionally, the larger number of YouTube users leads more amateur creation content to DailyMotion.
As the category Media has a large range, which includes content types of Documentary, News, Entertainment, Sport and Magazine, it explains why it takes a large part in both YouTube and DailyMotion. It is not surprising that the category Music takes a relatively large proportion in YouTube, because there are many musicians, singers, radio stations and Music companies like Warner Music and Sony BMG have their own YouTube accounts to upload their music videos for the advertisement of their productions.
We are interested in the video content with the categories about film (Short Films, Films, Film Clips and Film Parts) and series (Series, Short Series, Series Clips and Series Parts). We find that both in YouTube and DailyMotion, neither film nor series take a very large part. On YouTube the total proportions of film and series are 2.70% and 9.67% respectively. On DailyMotion these proportions are respectively 0.78% and 5.07%. This result shows that the two video sharing websites YouTube and DailyMotion do not mainly host content about film and series. However, [12] and [16] state that the estimated number of videos hosted by YouTube and DailyMotion is 502 million and 16 million. Thus the number of videos concerning about film or series is still considerable on both sites.
c.
Fig. 2. Content category popularity of YouTube and DailyMotion
Fig. 2 shows the content category popularities of YouTube and DailyMotion. The content category popularity in our work is defined as the average count of views per day for each category. The computed count of views of a video is the number shown on the page on the day that we collected the video. The total number of days of a video is between the day of uploading to the day of collection.
From Fig. 2 we see that the content category popularities of YouTube are much bigger than those of DailyMotion. That means in the same period of time, YouTube has much more visits than DailyMotion. Because YouTube is one of most known video sharing website, it has a large international user group, while DailyMotion as a French video sharing website has a relatively smaller user group. In YouTube, the highest popularity is the category Music, with 40137 views per day. It is almost 4 times more than the second highest category Film Part with 10485 views per day. However, the category Music just takes 13% among all the sampled videos on YouTube. The category Film Part is even smaller, only taking 0.42%.
On the contrary, for the largest category Amateur Creation, it has a popularity of 7581 views per day, which is fourth highest among all the categories. The category Media has even a worse popularity with 2307 views per day. It is same for DailyMotion. The most popular category in DailyMotion is Series Clips with 869.659 views per day, while it only represents 0.49% among all the categories. The biggest category Media in DailyMotion just has a popularity of 75.439 views per day.
We also find that the category Music, which has the highest popularity in YouTube, just gets a popularity of 30.393 views per day. From this result we can tell that there is no a strong relation between the content category and its popularity. The most popular category is not that with the biggest portion. Furthermore, the most popular category in one video sharing website cannot be guaranteed to have also a high popularity in another video sharing website.
B. Video Duration
We would like to figure out the general video length of the video sharing service. We use the three sets of 5000 videos collected from YouTube, which set 1 is collected at the beginning of January 2013, set 2 is collected at the end January 2013, the set 3 is collected in the middle of Mars 2013. DailyMotion as a comparison to YouTube is collected at April 2013 with 5000 sampled videos.
d.
Fig. 3. CDF of video duration of YouTube video sets and DailyMotion video set
Fig. 3 shows the Cumulative Distribution Function (CDF) of the video durations, which videos are from YouTube and DailyMotion. Firstly we take a look at the three YouTube video sets. The forms of the three curves are similar. We find that there are two obvious inflection points. The first is around 55%, which means that more than 50% videos are no longer than 300 seconds. The second inflection is around 80%, which shows that 80% videos are no longer than 600 seconds. After 1200 seconds, the increase of CDF turns slowly. This shows that videos on YouTube are short videos, which more than half of YouTube videos with duration no longer than 5 minutes, about 30% of videos with duration between 5 minutes and 10 minutes. We then take a look at DailyMotion. Comparing to YouTube, there are half of videos with duration no longer than 180 seconds, 10% videos with duration between 300 seconds and 600 seconds. That is to say, most videos on DailyMotion are no longer than 3 minutes, which are even shorter than those on YouTube.
C. Video Count of Views
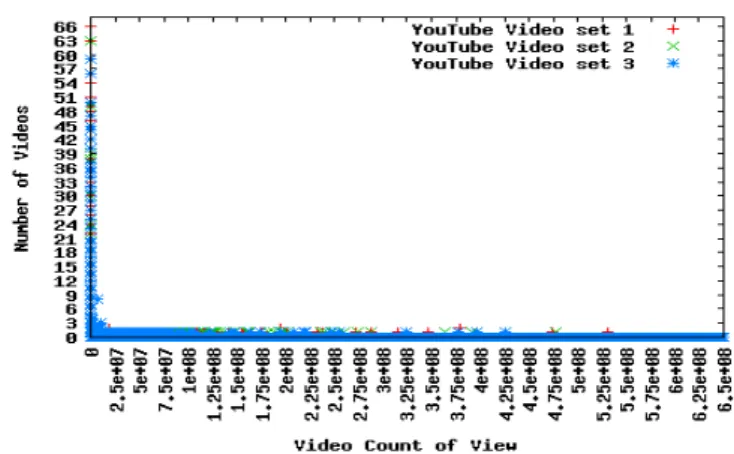
In this section we focus on analysing the distribution of video count of views. Fig. 4 gives the general distribution of the number of videos with different count of views on YouTube. At first glance, we can tell that a huge majority of videos only has a small amount of views. As the three video sets follow a similar distribution form, we just take one of them to do a further study to figure out the distribution form. Here we take the video set 3.
e.
Fig. 4. Distribution of the number of video with different count of views of 3 YouTube video sets
In order to figure out the distribution form, we approximate the distribution of the count of views of videos with a linear regression. We then find that their approximated distributions approach to a negative exponential distribution. Equation (2) shows the approximated distribution for the video count of views distribution in YouTube. We do the same approximated calculation for the sampled videos from DailyMotion. We find that the number of videos with different count of views also approximates to a negative exponential distribution, which (3) is its approximated function.
� = 102847.234�(!!.!"!) (2)
� = 12249552.945�(!!.!"!) (3)
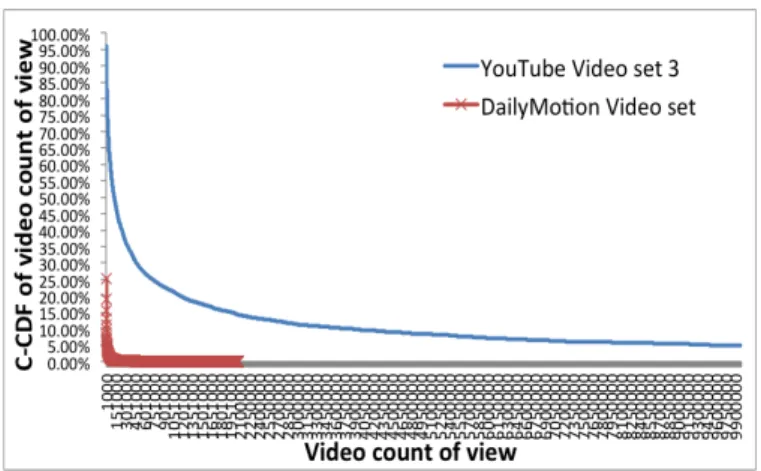
The two equations point that the number of videos with different count of views in YouTube and DailyMotion approximates to a negative exponential distribution. With (2) and (3), we can estimate the number of videos with a count of view 1000, which is about 315 in YouTube and 624 in DailyMotion. This shows that in DailyMotion there are much more videos with small count of views than those in YouTube. From (2) and (3) we can see that in DailyMotion the number of videos decreases even fasters than that in YouTube. Therefore we can infer that there are more videos with medium count of views in YouTube than that in DailyMotion. Fig. 5 is the Complementary CDF (C-CDF) of video count of views of YouTube and DailyMotion. Fig. 5 also shows that DailyMotion decreases faster and has more videos with small count of views. Additionally, we find that the highest count of views in DailyMotion is an order of magnitude of 6, and the number of videos drops quickly. However, in YouTube the highest count of views can reach an order of magnitude of 8, and the number of videos drops slowly. Especially although from the value of 3.789×10!, there are not so many videos with a high count of views, the order of magnitude of count view can drag to 1×10!
. That is to say, in YouTube the distribution of number of videos with different count of views is long-tailed. If we take a deeper look in DailyMotion, we can see that the curve of C-CDF is to some extend long-tailed to 2×10!. However, compared to the big order of magnitude of YouTube, this is not so obvious. Therefore, it can be inferred that for most video sharing websites, the distribution of video
count of views is approximated to a negative exponential distribution. Most videos have a small or medium count of views; only a few videos can have a big count of views. We could conjecture that some of popular video sharing websites as YouTube, which are international with a lot of users could have count of views of 1×10!
; and most video sharing websites with a medium user scope as DailyMotion, could have count of views of 1×10!
. Furthermore, for most of video sharing websites the distribution of video count of views is long-tailed.
f.
Fig. 5. The C-CDF of the number of video with different count of views of YouTube video set 3 and DailyMotion
V. CONCLUSION AND FUTURE WORK
In our work, we aim at understanding the properties of content hosted on video sharing websites. We firstly improve a graph-sampling method based on Random Walk and suggested videos, which is used to mine video sharing websites in order to gather a relatively random and less biased video collection. Based on the sampled video collections from YouTube and DailyMotion, we analyse the video content, video duration and video count of views. We define a new category system, which is uncorrelated between different content types and can be adapted by most video sharing systems. This newly defined category system can be used to classify video content from different video sharing websites, which can help us to understand the content category distribution and popularity among different video sharing websites. We find that YouTube and DailyMotion have different category distribution, which on YouTube categories with high proportion are Amateur Creation, Media and Music while on DailyMotion, categories of high proportion are Media, Speech/Conference and Amateur Creation. This difference shows that each video sharing website has its own content preferences. Furthermore, for a video sharing website, there is no relation between the content category distribution and content popularity, which means there exist different preferences between the video uploaders and website visitors. Besides, we also find that most videos on the video sharing websites are short videos. On YouTube there are more than 50% videos no longer than 5 minutes, on DailyMotion there are more than 50% videos no longer than 3 minutes. Both in the two websites, there are more than 80% videos no longer than 10 minutes. We also find that the video
count of views of video sharing websites approximates to a negative exponential distribution. So there is a large part of videos with small or medium count of views. However, the video count of views is long-tailed, which for example on YouTube, it can reach to 1×10!
.
Our future work will focus on the dynamic evolution on the video sharing websites as the lifecycle of a video, the variance of the number of videos on a video sharing website or how the video properties changes with the time. Meanwhile, we will continue working on the sampling algorithm adapted in this work in order to reduce or remove the potential bias caused by this algorithm.
REFERENCES [1] Ipoque, “Internet study 2008/2009,”
http://www.ipoque.com/en/resource/internet-studies
[2] P. Gill, M. Arlitt, Z. Li, and A. Mahanti, “YouTube traffic characterization: a view from the edge,” In Proc. ACM IMC, San Deigo USA, 2007.
[3] Meeyoung Cha, Haewoon Kwak, Pablo Rodriguez, Yong-Yeol Ahn and Sue Moon, “I Tube, You Tube, Everybody Tubes: Analyzing the World's Largest User Generated Content Video System,” ACM Internet Measurement Conference, 2007, pp. 1-14.
[4] Martin J. Halvey and Mart T. Keane, “Analysis of online video search and sharing,” HT ’07 in Proceedings of the eighteenth conference on Hypertext and hypermedia, 2007, pp. 217-226.
[5] Xu Cheng, Cameron Dale and Jiangchuan Liu, “Statistics and Social Network of YouTube Videos.,” IWQoS'08, 2008, pp. 229-238. [6] Siddharth Mitra, Mayank Agrawal, Amit Yadav, Niklas Carlsson, Derek
L. Eager and Anirban Mahanti, “Characterizing Web-Based Video Sharing Workloads,” ACM Transsactions on the Web, 2011, pp. 8:1-8:27.
[7] Wang Tianyi, Chen Yang, Zhang Zengbin, Xu Tianyin, Jin Long, Hui Pan, Deng Beixing and Li Xing, “Understanding Graph Sampling Algorithms for Social Network Analysis,” in Proceedings of the 2011 31st International Conference on Distributed Computing Systems Workshops, 2011, pp. 123-128.
[8] Wilson Christo, Boe Bryce, Sala Alessandra, Puttaswamy Krishna P.N. and Zhao Ben Y., “User interactions in social networks and their implications,” in Proceedings of the 4th ACM European conference on Computer systems, 2009, pp. 205-218.
[9] Gjoka Minas, Kurant Maciej, Butts Carter T. and Markopoulou Athina, “Walking in facebook: a case study of unbiased sampling of OSNs,” in Proceedings of the 29th conference on Information communications, 2010, pp. 2498-2506.
[10] Ribeiro Bruno and Towsley Don, “Estimating and sampling graphs with multidimensional random walks,” in Proceedings of the 10th ACM SIGCOMM conference on Internet measurement, 2010, pp. 390-403. [11] Jin Long, Chen Yang, Hui Pan, Ding Cong, Wang Tianyi, Vasilakos
Athanasios V., Deng Beixing and Li Xing, “Albatross sampling: robust and effective hybrid vertex sampling for social graphs,” in Proceedings of the 3rd ACM international workshop on MobiArch, 2011, pp.11-16. [12] Zhou Jia, Li Yanhua, Adhikari Vajay Kumar, and Zhang Zhi-Li,
“Counting YouTube videos via random prefix sampling,” in IMC'11: ACM SIGCOMM conference on Internet measurement conference, 2011, pp. 371–380.
[13] http://en.wikipedia.org/wiki/Confidence_interval
[14] Glenn D.Israel, “determing Sample Size,” in Fact Sheet PEOD-6, 1992. [15] http://en.wikipedia.org/wiki/Short_film
[16] http://www.netcristal.com/referencement-site-web-seo/statistiques-videos-dailymotion.php