HAL Id: hal-01244331
https://hal.inria.fr/hal-01244331
Submitted on 15 Dec 2015
HAL is a multi-disciplinary open access
archive for the deposit and dissemination of
sci-entific research documents, whether they are
pub-lished or not. The documents may come from
teaching and research institutions in France or
abroad, or from public or private research centers.
L’archive ouverte pluridisciplinaire HAL, est
destinée au dépôt et à la diffusion de documents
scientifiques de niveau recherche, publiés ou non,
émanant des établissements d’enseignement et de
recherche français ou étrangers, des laboratoires
publics ou privés.
To cite this version:
Nihel Benzaoui, Yvan Pointurier, Thomas Bonald, Qing Wei, Matthias Lott. Optical Slot Switching
Latency in Mobile Backhaul Networks. ECOC, 2014, Cannes, France. �hal-01244331�
ECOC 2014, Cannes - France Th.2.2.1
Optical Slot Switching Latency in Mobile Backhaul Networks
N. Benzaoui(1), Y. Pointurier(1), T. Bonald(2), Q. Wei(3), M. Lott(3)(1)
Alcatel-Lucent Bell Labs, Nozay, France, [email protected]
(2)
Telecom ParisTech, Paris, France; and LINCS, Paris, France
(3)
DOCOMO Communications Laboratories Europe GmbH, Munich, Germany
Abstract We show that an optical slot switching network fulfills the strict latency constraints of a next
generation LTE advanced switching mobile backhaul network. The impact of class-of-service handling when aggregating client data into slots is also quantified.
Introduction
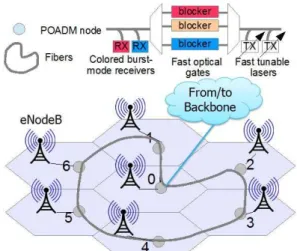
With the evolution of the optical transport technologies, energy-efficient solutions for the transport in the radio access part of cellular backhaul networks have become available. In this paper, we consider the use of fine granularity optical transport solutions – optical slot switching (OSS), an energy-efficient switching technology1, to interconnect the eNodeBs in an LTE mobile backhaul network. Here, optical slot switching is applied at the metro level for backhaul networks with a few (and up to a few dozens) of nodes (eNodeBs): Fig. 1 shows LTE base-stations (eNodeBs) interconnected by a mobile backhaul network.
We focus on Packet Optical Add/Drop Multiplexer (POADM3; see top of Fig. 1), an implementation of OSS for physical ring networks. POADM provides sub-wavelength switching granularity, and is designed to minimize the power consumption thanks to optical transparency for the transit traffic1. Direct node-to-node communication2 can be efficiently leveraged to transport Coordinated MultiPoint (CoMP) traffic, which is used in the LTE standards to improve coverage, cell-edge throughput, and system efficiency.
This paper quantifies for the first time the latency of an OSS-based LTE advanced backhaul network using real traffic demand. Specifically, we show that the overall latency is compatible with LTE advanced requirements. In addition, we investigate the impact of class of service (CoS) handling at the slot level to support additional real-time traffic, at the expense of a reduction of the maximum amount of non-real-time traffic that can be carried before losses occur.
Support of differentiated classes of service
Traffic in an LTE advanced mobile backhaul network is described in Tab. 1. In this work we consider 2 classes of service: real-time (RT) and non-real-time (NRT). RT traffic is latency sensitive and consists of (some) data traffic, Voice over IP (VoIP), and signaling for CoMP,
while NRT (or best effort) traffic consists of (some) data traffic, data for the CoMP mechanism, and handover (HO) signaling. The most strict latency requirement comes from CoMP signaling, which should experience less than 1 ms end-to-end latency. Given that such traffic may traverse one node in the backbone network to ensure communication between 2 eNodeBs in two different mobile backhaul networks (here, rings), the per-ring maximum latency for RT traffic is thus at most 500 μs. This paper quantifies the impact of CoS management during slot formation on traffic latency. We first describe how slots are formed in a non-CoS managed network.
Figure 1: POADM mobile backhaul ring.
Table 1: Traffic characteristics.7,8
Type Demand Pattern CoS
Data 1.5 Gb/s up, 3 Gb/s down Centralized RT, NRT Voice over IP 8.5 Mb/s up and down Centralized RT CoMP data 1 Gb/s Peer to peer NRT CoMP signaling 774 Kb/s Peer to peer RT Handover inter-ring 0.1 Gb/s up and down Centralized NRT Handover intra-ring 0.1Gb/s Peer to peer NRT Page 1/3 PDF.js viewer http://ieeexplore.ieee.org/ielx7/6949035/6963816/06963967.pdf?tp=&...
Figure 4: Traffic pattern: (a) centralized; (b) peer to peer. H 1 2 3 6 5 4 (a) H 1 2 3 5 4 6 (b)
Slot formation without CoS management
Without CoS management, client packets with any CoS are mixed in the same optical slot, as described in Fig. 2. At a POADM (eNodeB) node, packets arriving from clients (e.g. mobile terminals) are placed in a temporary packet queue identified by the destination (eNodeB) node. Once enough packets have arrived, the temporary queue is emptied and the optical slot is formed and placed in the optical slot queue, waiting for its insertion on the channel. To cap optical slot formation time, we use a timer, which is triggered by the arrival of the first client packet, and whose expiration causes the completion of the formation of the optical slot.
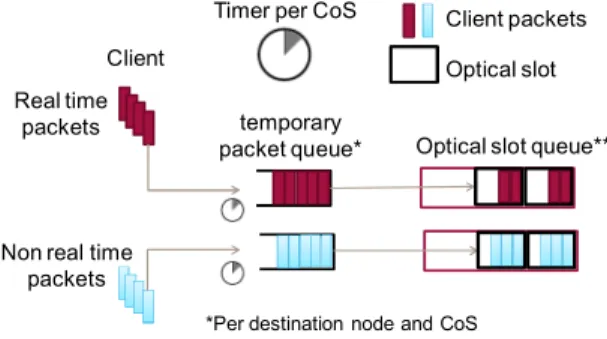
Slot formation with CoS management
As described in Fig. 3, temporary queues are now identified not only by destination node but also per CoS, such that each optical slot contains packets from the same CoS. The utilization of per-CoS queues enables sending RT traffic before NRT traffic. CoS differentiation is performed during slot assembly only; due to transparency, all slots are treated equivalently by the transport layer, irrelevant of their CoS.
Scenario description
We consider a POADM ring connecting 7 eNodeBs; each base-station is connected to a POADM node. As described in Fig. 4 the traffic sent between base-stations, belonging to the same ring, remains inside the ring. The traffic exchanged with base-stations on other rings or with the Internet (via the backbone) is transmitted via a selected OSS node, which we call “hub” and denote by H.
As mentioned earlier we consider 6 types of traffic. Each type of traffic has a specific pattern: centralized traffic is between any node
and the backbone (i.e., it transits via H) while peer-to-peer traffic is between any two eNodeBs. The pattern and per-flow demands for each type are summarized in Tab. 1.
The dimensioning of the POADM ring that ensures the support of such traffic demand is computed using algorithm4 and results in a 6-wavelength ring with 3 transponders on the hub and 1 transponder on every other node.
Performance evaluation
First we evaluate the performance of the POADM solution with no CoS management in the 7-node mobile backhaul network. The slot duration is set to 8 μs and client traffic is assumed to be Poisson. A load of 1 corresponds to the demand of Tab. 1 and other loads are generated by scaling this reference load. Propagation (a few μs in a 7-node mobile backhaul ring) and insertion/extraction on the medium (1 slot duration each) are small compared with the target real-time traffic latency (500 μs) such that queuing delays, which are reported here, are representative of the latency experienced by client data within the ring.
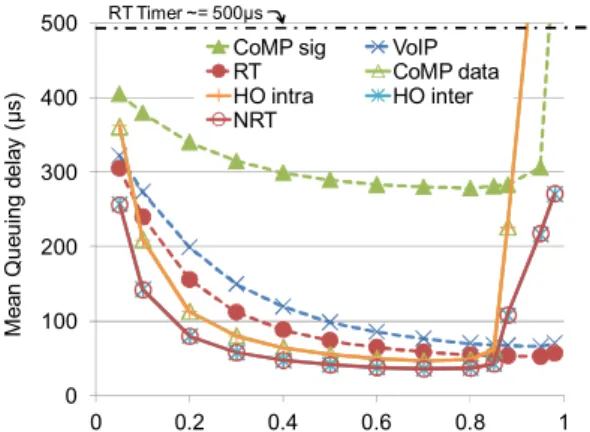
We first set the (global) timer to 500 μs; Fig. 5 shows the mean queuing delay for each traffic type. Seemingly counter-intuitively, the queuing delay decreases as load increases for low loads; this is because queuing delay is then dominated by the time to actually fill the optical slots5. At higher loads the queuing delay mainly depends on channel congestion and queuing delay increases, as expected. Fig. 5 shows that the mean queuing delay of all traffic classes is well below the timer limit for load up to 0.88. The ~10% wasted load is due to the impossibility to fully fill slots with client data. This problem can be solved by allowing segmentation of client packets in several slots; this is out of the scope of this work. Note that there is no loss up to load 0.85 and we measured a client frame loss below 1e-3 up to load 0.9.
In Fig. 6 we show the impact of CoS management. We consider that half of the data traffic is RT and the other half is NRT. We keep
Figure 3: Optical slot formation with CoS management.
Client
Optical slot queue** temporary
packet queue* Timer per CoS
Real time packets
Non real time packets
*Per destination node and CoS
** Per wavelength, destination node and CoS Client packets
Optical slot
Figure 2: Optical slot formation without CoS management.
Client
Optical slot queue** temporary
packet queue* Global Timer
*Per destination node
** per wavelength and destination node Client packets
Optical slot Real time
packets
Non real time packets
ECOC 2014, Cannes - France Th.2.2.1
a timer of 500 μs for RT traffic and set a timer of 1 ms for NRT traffic. Both RT and NRT queuing delays are higher than in the no-CoS management scenario. The queuing delays remain below the respective timer values. However, as we can see in Fig. 6, the CoS management policy gives an advantage to RT traffic, since we can achieve a load close to 1 for a packet loss probability below 1e-3. This is at the expense of a lower maximum amount of NRT traffic that can be carried in the network for a given client frame loss rate. Indeed in Fig. 6; NRT traffic can still achieve a load of 0.85 but beyond this value the queuing delay is higher with than without CoS management: RT traffic experiences almost no loss while NRT traffic experiences high losses. Figs. 5 and 6, show that, whichever CoS management policy is used, the proposed optical slot switching ring fulfills the strict latency constraints of LTE advanced mobile backhaul network.
Fig. 7 shows the impact of the timer (no CoS management: global timer; CoS management: RT timer) on the maximum achievable load for each traffic class. Without CoS management we can reach a load of 0.8 while ensuring a queuing delay for any traffic of 50 μs. Using CoS management we can still achieve a load close to 1 with a timer of 100 μs and load>0.8 using a timer of 50 μs. For very short timers (<200 μs) the maximum load achieved for NRT traffic is impacted by the prioritization of RT
traffic but remains >0.7 for a timer of 50 μs, and >0.8 for a timer of 100 μs.
Conclusions
We showed that an optical slot switching network fulfills the latency constraints of a next generation LTE advanced switching mobile backhaul network, which can reach as low as a few hundreds of microsecond in the considered segment. Even without differentiated CoS handling, real-time traffic can be supported with load up of to 88%. When CoS handling is used while forming slots it is possible to support even more real-time traffic, at the expense of a reduced non-real-time maximum carried load. Without CoS management, we showed that we can ensure a queuing delay of 50 μs while reaching a load of 80% for both RT and NRT traffic; with CoS management we can ensure a queuing delay of 100 μs while reaching a load of nearly 100% for RT and 80% for NRT traffic.
Acknowledgements
Work supported in part by CELTIC+ SASER project. References
[1] Y. Pointurier et al., "Dimensioning and energy efficiency of multi-rate metro networks," IEEE/OSA Journal of Lightwave Technology, vol. 30, no. 22, Nov. 2012. [2] Q. Wei et al., "Multicast in Mobile Backhaul with Optical
Packet Ring," in Proc. STWiMob, Oct. 2013.
[3] D. Chiaroni et al., "Packet OADMs for the next generation of ring networks," Bell Labs Technical Journal, vol. 14, no 4, pp. 263-285, Winter 2010. [4] B. Uš umli et al., "Optimal dimensioning of the WDM
unidirectional ECOFRAME optical packet ring," Springer Photonic Network Comm., vol. 22, no. 3, Jul. 2011 [5] N. Benzaoui et al., "Electronic architectures of optical
slot switching nodes," in Proc. ONDM, April 2013. [6] ] S, Brueck, "Backhaul Requirements for Centralized and
Distributed Cooperation Techniques", ITG Heildleberg, July 2010.
[7] NGMN alliance, "Guidelines for LTE Backhaul Traffic Estimation," White paper, 2011.
Figure 6: Mean queuing delay with CoS management.
0 100 200 300 400 500 0 0.2 0.4 0.6 0.8 1
CoMP sig VoIP
RT CoMP data HO intra HO inter NRT RT Timer ~= 500μs M e a n Q u e u in g d e la y (μ s ) Load
Figure 5: Mean queuing delay without CoS management.
Figure 7: Max. achievable load for packet loss rate < 1e-3.
0 100 200 300 400 500 0 0.2 0.4 0.6 0.8 1
CoMP sig CoMP data
HO intra ring VoIP
Data (RT and NRT) HO inter ring
M e a n Q u e u in g d e la y (μ s ) Load Global Timer = 500μs 0 0.1 0.2 0.3 0.4 0.5 0.6 0.7 0.8 0.9 1 0 100 200 300 400 500
with CoS mgmt :RT traffic with CoS mgmt : NRT traffic
without CoS mgmt : RT and NRT traffic Timer (μs) M a xi m u m a c h ie va b le l o a d Page 3/3 PDF.js viewer http://ieeexplore.ieee.org/ielx7/6949035/6963816/06963967.pdf?tp=&...