This is an author-deposited version published in:
http://oatao.univ-toulouse.fr/
Eprints ID: 9272
To link to this article: DOI: 10.1115/1.4000845
URL:
http://dx.doi.org/10.1115/1.4000845
To cite this version:
Duplaa, Sébastien and Coutier-Delgosha, Olivier and
Dazin, Antoine and Roussette, Olivier and Bois, Gérard and Caignaert,
Guy Experimental study of a cavitating centrifugal pump during fast
starts-up. (2010) Journal of Fluids Engineering, vol. 132 (n° 2). ISSN
0098-2202
Open Archive Toulouse Archive Ouverte (OATAO)
OATAO is an open access repository that collects the work of Toulouse researchers and
makes it freely available over the web where possible.
EXPERIMENTAL STUDY OF A CAVITATING CENTRIFUGAL PUMP DURING FAST
START-UPS
S. Duplaa1, O. Coutier-Delgosha2, A. Dazin2, O. Roussette2, G. Bois3, G. Caignaert4
(1) Ecole Navale IRENav, BCRM Brest CC 600, 29240 BREST Cedex 9, France
(2) (3) (4) Arts et Métiers ParisTech / LML Laboratory, 8 boulevard Louis XIV, 59046 Lille cedex, France
¹(0033)298233862, 2(0033)320622167, 3(0033)320622223, 4(0033) 320622221
[email protected], [email protected], [email protected],
[email protected], [email protected], [email protected]
ABSTRACT
The start-up of rocket engine turbopumps is generally performed only in a few seconds. It implies that these pumps reach their nominal operating conditions after only a few rotations. During these first rotations of the blades, the flow evolution in the pump is governed by transient phenomena, based mainly on the flow rate and rotation speed evolution. These phenomena progressively become negligible when the steady behavior is reached. The pump transient behavior induces significant pressure fluctuations which may result in partial flow vaporization, i.e. cavitation. An existing experimental test rig has been updated in the LML laboratory (Lille, France) for the start-ups of a centrifugal pump. The study focuses on cavitation induced during the pump start-up. Instantaneous measurement of torque, flow rate, inlet and outlet unsteady pressures, and pump rotation velocity enable to characterize the pump behavior during rapid starting periods. Three different types of fast start-up behaviors have been identified. According to the final operating point, the start-up is characterized either by a single drop of the delivery static pressure, by several low-frequency drops, or by a water hammer phenomenon that can be observed both a the inlet and outlet of the pump. A physical analysis is proposed to explain these three different types of transient flow behavior.
NOMENCLATURE
b height of the blade to blade channels (m) Cu tangential component of the velocity (m/s)
Cr = Q / (2rb) radial component of the velocity (m/s)
C torque (Nm)
H Total head (m)
Ifluid Fluid inertia moment (kgm2)
Ip Shaft inertia moment (kgm2)
K = f Tna / nf (-)
Ps static pressure in the pump suction pipe (Pa)
Pd static pressure in the pump delivery pipe (Pa)
Pvs vapor pressure (Pa)
Q Inlet volume flow rate (m3/s)
r impeller radius (m)
S limit of the fluid volume in the channels (m2)
t time (s)
Tna time to reach 63.2% of f (s)
u tip velocity = r2 (m/s)
v inlet pipe velocity (m/s)
relative flow angle (-)
P pump static pressure rise (Pa)
torque coefficient = C / 2r25 (-)
flow rate coefficient : = Q / u2r22 (-)
flow rate coefficient = Q / 2r2b2u2 (-)
pressure coefficient = P / u22 (-)
pump efficiency (-)
s specific speed = Q1/2 / (gH)3/4 (-)
= (Ps + ½v2 – Pvs)/(½ u22) (-)
density (kg/m3)
Subscripts :
f final (steady part of the fast start up) n nominal
1 impeller inlet 2 impeller outlet hyd hydraulic
nf non cavitating final condition st steady
tr transient max maximum value
INTRODUCTION
Space launcher turbopumps are characterized by fast start-ups: actually, the time delay between the inception of the shaft rotation and the nominal flow conditions is usually close to one second. It means that the rotation speed increases from zero up to several tens of thousands of rotations per minute during a single second. Such fast start-up results in severe transient effects that are mainly governed by the speed acceleration d / dt and the flow rate increase dQ / dt [1].
Transient effects in centrifugal pumps have been studied experimentally by several means for about 25 years: fast opening or closure of valves [2], fast start-up and shutdown sequences [3, 4, 6, 7, 8], and /or rotation speed fluctuations [5]. It has been found in these previous studies that fast transients result in pronounced unsteady effects involving large pressure and flow rate fluctuations, which may be preponderant in front of the quasi – steady flow evolution. So, the understanding and the prediction of these transient behaviors is of first importance for the design of the feed pumps of rocket engines.
For this purpose, an experimental setup has been developed in the LML laboratory. It is presently devoted to the study of a five blades centrifugal impeller. An original start-up sequence based on the use of a rapid coupling is applied in order to simulate rocket engine fast startings and the associated transient effects. Non-cavitating conditions have been previously
investigated [6, 7] and the evolution of global parameters of the flow during the start-up (flow rate, pump head, pump rotation speed) has been obtained for various flow conditions. Local investigations have also been performed by Picavet and Barrand [6] in order to characterize the flow at the pump suction. A strong tangential velocity has been detected by visualizations at the pump inlet. PIV measurements performed in the inlet pipe have confirmed the presence of this recirculation, whose length and intensity have been characterized according to the final rotation speed and flow rate [7].
These previous investigations have been mainly conducted in non-cavitating flow conditions. However, pressure fluctuations involved in pump fast start-ups may be responsible for the development of cavitation in the impeller and in the inlet pipe. Indeed, cavitation is a recurrent source of perturbation for pumps operating at low inlet pressure and/or high rotation speed. Such conditions may be encountered during fast start-ups. Tanaka and Tsukamoto [2] have studied the transient flow in a centrifugal pump during fast start-up or shut down sequence: they have found strong fluctuations of both the flow rates and the pressures at inlet and outlet. While some of these fluctuations, which occur simultaneously at pump suction and delivery, are attributed by the authors to water hammer phenomenon, other oscillations, only detected at pump outlet, are due to unsteady cavitation. According to the measurements reported in [2], such oscillations depend both on the value of the cavitation number and on the flow rate.
The objective of the present study is to analyze this transient cavitating behavior in order to characterize the influence of low inlet pressure on fast start-ups of pumps.
1. EXPERIMENTAL DEVICE
The test rig has been initially constructed in 1993 for the study of fast start-up of centrifugal pumps. It has been used since that time for the investigation of fast transients in various situations of non-cavitating flows.[ 9, 10, 11].
For the purpose of the present study, the set-up has been significantly modified in order to improve its capabilities of measurement and also to enable different types of initial conditions.
Two different configurations are available (figure 1):
- configuration #1: suction pipes and delivery pipes of the pump are connected to a single tank, so that the test rig is closed. In this situation, the flow velocity in the rig before the pump start-up is zero.
- configuration #2: delivery pipes are connected to a second tank, which means that the inlet and outlet initial pressures can be set independently. It enables to impose an initial flow circulation before the pump start up.
The switch between the two configurations is controlled with a valve located on the pump delivery pipe (figure 1). In the present study, configuration #1 is systematically used.
In order to achieve fast starting periods, a special conception of the line of shafts is required: the pump is driven by an asynchronous electric motor through an electromagnetic clutch. The fast start-ups are obtained by engaging the clutch, once the motor is running at its final rotation speed. Slower start-ups can also be obtained by engaging the clutch before the motor is started.
A single stage vaneless diffuser single volute type radial flow pump is used for the experiments. The main specifications of the impeller are summarized in Table 1 and figure 2.
Several high frequency measurements are available on the installation, in order to characterize the flow evolution during the pump fast start-up:
- A Meiri 0170MS torquemeter is included between the pump and the electromagnetic clutch in order to obtain the instantaneous rotation speed and torque.
- Four Kistler 701A piezoelectric pressure transducers are located on the inlet and delivery pipes. Their signals are used to obtain as well the high frequency inlet and outlet pressure evolutions as the inlet and outlet flow rates, according to the method initially proposed by Ghelici [9]. The transducer which is the nearest from the impeller on the suction pipe is located 50mm upstream from the pump, while the first one on the delivery pipe is at located 100 mm downstream from the pump. More details can be found in [1] regarding this method and its accuracy.
- The motor shaft rotation speed is measured by a photoelectric cell.
- An accelerometer located on the pump casing is used to obtain the radial vibrations.
Moreover, supplementary low frequency instrumentation is also available in order to control the final flow conditions after the transients or to characterize stabilized flow conditions.For this purpose, two Krohne Optiflux 4300 flow meters are used for the flow rate control at the pump suction and delivery, and two Rosemount pressure sensors are devoted to the measurements of the inlet staticpressure and pump static pressure rise, respectively. These sensors are not used for unsteady conditions measurements because their acquisition frequency is too small: 25 Hz for the flow meters and less than 1Hz for the Rosemount pressure sensors. Such values do not enable to catch the flow rate evolution and the pump static pressure rise evolution during a fast start-up.
The high frequency data from the pressure transducers and the torquemeter are acquired by a National Instrument PXI-PCI system equipped for the simultaneous acquisition of all signals. The sampling frequency is 10 kHz, and the acquisition
duration is 5s. In the case of fast start-ups, acquisition is triggered by a TTL signal emitted at the engagement of the electromagnetic clutch, so that all experiments have the same reference time.
For steady state flow conditions, the uncertainty on the measurements has been evaluated from both the precision of the sensors and repeatability tests. In non-cavitating conditions and a rotation speed equal to 3000 rpm, the overall relative uncertainty is 5% for the torque, 1% for the measurements of the fluctuating pressures, 0.5% for the inlet pressure and the pump head, and 4% for the flow rate, respectively. In cavitating conditions, uncertainties on torque and fluctuating pressures increase up to 6.5% and 2%, respectively.
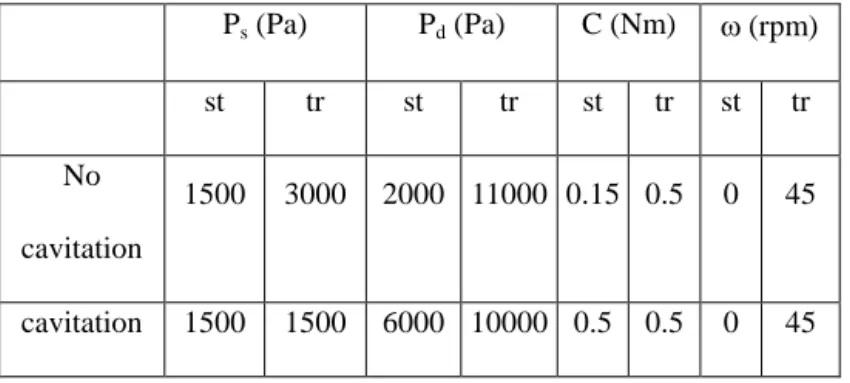
For transient flow conditions, absolute uncertainties are given in table 2. Indeed, relative uncertainties make no sense, since initial values of the flow rate, rotation speed are zero. In table 2, absolute uncertainties related to steady flow conditions are also reported, in order to enable the reader to compare transient and steady flow conditions. All values given in table 2 correspond to the maximum uncertainties obtained during the transient from analysis of repeatability tests, as well for cavitating as non cavitating conditions. The final rotation speed is always 3000 rpm. Note that absolute uncertainties are given for both steady (st) and transient (tr) situations. It can be seen that the precision of the measurements may decrease slightly during fast start-ups. The value 45 rpm reported for the rotation speed in transient flow conditions is mainly due to a random time delay in the rotation speed increase, which is related to the variable slipping of the electromagnetic clutch when it is engaged.
Visualizations of the flow within the impeller have been performed with a high speed camera and a pulsed stroboscope. As the other sensors, the camera and stroboscope are triggered with the electromagnetic clutch. For these measurements, an inlet pipe in Plexiglas was used. The acquisition frequency equals 500 Hz, so about 250 pictures are obtained during each fast start-up. The objective of these visualizations is to provide a rough estimation of the cavitation development within the impeller during the fast start-ups.
2. STEADY FLOW MEASUREMENTS
The behavior of the impeller has first been characterized in configurations of stabilized flow rates and rotation speeds in non-cavitating and cavitating conditions.
The evolution of the pump head according to the flow rate is given in figure 3 for three different rotation speeds. The nominal flow rate Qn is defined as the conditions leading to zero incidence at the blade leading edge. The corresponding
flow rate coefficient is 0.021. Flow rates have been investigated from 0.13 Qn up to 1.5 Qn. To obtain charts drawn in figure
3, non-cavitating conditions have been imposed by increasing the pressure level in the tank up to 3 kPa.
It can be observed in figure 3 that a close agreement between the three results is obtained. Only a slight decrease of the pump head can be observed at rotation speed 1000 rpm, in comparison with the two other speeds. It shows that for rotation speeds ranging from 1000 to 3000 rpm, the non-cavitating flow in the pumps matches a similarity law.
Figures 4a and 4b show the evolutions of the torque and the efficiency according to the flow rate coefficient for a rotation speed equal to 3000 rpm. Note that the efficiency of the whole pump including the volute is considered here. The variation of as a function of the dimensionless rotation speed /n at nominal flow rate is given in figure 4c. It can be
observed that for rotation speeds higher than 1200 rpm (/n = 0.4) a nice similarity is obtained, while for small rotation
speeds, the torque increases significantly. This poor similarity at low speed is confirmed in figure 4d, which shows the evolution of the amplitude of radial vibrations on the pump casing according to the flow coefficient for three rotation speeds.
2.2 Cavitating behavior
The effects of cavitation on the pump performance have been studied first in steady flow conditions: the head drop charts have been obtained at several rotation speeds and several values of the flow coefficient, by progressively decreasing the pressure in the tank. Only rotation speeds 2500 rpm and 3000 rpm have been investigated, so that at least 20% pressure drop can be obtained. A close agreement between dimensionless charts obtained at both speeds at nominal flow rate is obtained in figure 5. It shows that similarity laws can be extended to cavitating behavior at such speeds.
Figure 6 displays the cavitating behavior of the pump at 3000 rpm for several flow rates. Although the pump geometry leads to a quite small value of s = 0.24, the decrease of the pump elevation is progressive at all flow rates. Figure 7 shows
the evolution of the values of corresponding to 3%, 10%, and 20% head drop, respectively, according to the flow rate. Nearly identical slopes are obtained for the three curves, which demonstrates a similar pump behavior at all flow rates.
Figure 8 shows the decrease of the pump head according to the flow rate for constant values of the cavitation number . The curve corresponding to non-cavitating flow conditions is also drawn in order to visualize the head drop due to cavitation. It can be observed that the head drop increases with the flow rate. It suggests that cavitation occurs also on the
pressure side of the blades when the flow rate is increased over the nominal value n = 0.021. This pressure side cavity leads
to a local inversion of the pressure difference on both sides of the blades, which progressively deteriorates the pump elevation. However, figure 9 shows that the efficiency also decreases at high flow rate coefficient, which indicates that the pressure side cavity leads to a significant obstruction of the flow in the blade to blade channels. It induces also a progressive decrease of the flow coefficient corresponding to the optimal efficiency.
3 FAST START-UPS
Transient behaviors have been also investigated by performing fast start-ups of the pump at several flow rates in non-cavitating and non-cavitating conditions.
3.1 Non cavitating conditions
The high frequency signals resulting from a fast start-up performed at nominal flow rate are displayed in figures 10 to 12. The time evolutions of the pressure at suction (Ps) and delivery (Pd) are drawn in figure 10, together with the differential
pressure developed by the pump (Pd-Ps). The start-up itself corresponds to the first 0.45s, while the second part of the
signals is related to steady flow conditions that are obtained at the end of the starting period. This is confirmed by figure 11, which shows the evolution of the rotation speed as a function of time. The pressure decrease in the pump suction pipe (see figure 10) is related to the effects of the fluid inertia in the suction pipe, according to the following relation :
Ps=Ptank - K2*Q/t - , where Ptank is the pressure at the outlet of the upstream tank, and is the pressure drop due to
the unsteady head losses. It can be checked in figure 12 than the lowest value of Ps is obtained when for the highest value of
Q/t.
The torque evolution is shown in figure 12. Periodical fluctuations at frequency of the pump rotation (50 Hz) are obtained in steady flow conditions. The hydraulic torque is given hereafter [1] :
The first term on the right hand side is identical to the one obtained in steady flow conditions: it corresponds to the increase of the moment of momentum in the pump. Conversely, terms 2 and 3 are due to the unsteady flow evolution: term 2
(1)
2 1)
tan
(
)
(
r r fluid r uQ
t
dr
r
t
I
dS
c
rc
C
is related to the inertial moment of the fluid (Ifluid) when the impeller is accelerated, while term 3 is due to the flow rate
variations in the pump.
To investigate the peak that occurs at the end of the start-up, the shaft inertia must be taken into account as shown on the expression hereafter :
This equation is solved numerically on the basis of the evolutions of and Q measured in the experiment. The comparison between the numerical result and the torque measured during the start-up is displayed in figure 13.
Although some discrepancies can be observed concerning the prediction of the steady-flow torque magnitude, a reliable agreement is obtained regarding the peak amplitude and shape.
Since the torque peak occurs for high values of d/dt (see figures 10 and 11), it is expected that the ratio Cmax / Cst
(where Cmax denotes the maximum torque value and Cst is the torque value in steady flow conditions) depends mainly on the
fluid and solid inertia. Ip is estimated to be much higher than Ifluide, so Cmax / Cdest may be close to the following expression:
st p st p st st
C
t
I
C
t
I
C
C
C
1
maxThis expression is calculated numerically and compared to the experimental values of Cmax / Cst for several rotation
speeds, at nominal flow rate (figure 14).
A close agreement between the experimental data and the calculated values is obtained for all rotation speeds. It confirms than the shaft inertia is mainly responsible for the torque peak observed at the end of the fast start-ups.
3.2 Cavitating conditions
When the pressure in the tank is decreased so that cavitation is obtained during the transient or even in steady flow conditions, three types of pressure signals displayed in figures 15, 17 and 18 are obtained. All data are obtained for a final rotation speed equal to 3000 rpm, since it was shown previously in Section 2.2 that behaviors at other rotation speeds could be derived from a single one by similarity laws. The three different operating conditions including cavitation are given in Table 3. (2) (3)
2 1)
tan
(
)
(
)
(
r r p fluid r uQ
t
dr
r
t
I
I
dS
c
rc
C
Tests have been conducted for various values of flow rate and cavitation number. In most of the cases, pressure signals evolutions are similar to the one drawn in figure 15 (denoted “case 2” hereafter). In comparison with non cavitating situations (see figure 10), the pressure at pump suction, after the initial fall, remains completely stable during most of the start-up (0.25s < t < 0.45s). Its magnitude during this period is slightly higher than the vapor pressure. This behavior indicates that cavitation occurs in the pump inlet pipe and /or inside the pump. The pressure at delivery is characterized by a significant drop at the end of the start-up, which may be related to the temporary decrease of the pump head because of cavitation on the blades. The delivery signal also exhibits high frequency fluctuations whose maximum amplitude is about 50% of the pump head. This may be due to vapor collapse at the pump outlet.
These pressure fluctuations at the pump outlet can be associated with the drastic increase of the magnitude of the radial vibrations measured on the pump casing, in comparison with non-cavitating conditions (figure 16). Note in figure 16b that the maximum amplitude of the vibrations (0.4s < t <0.5s) is correlated with the maximum pressure fluctuations at the pump outlet (figure 15).
For high flow rates (at least 1.1 Qn) slightly different pressure signals are obtained (figure 17). Low frequency
oscillations of the delivery pressure can be observed at the end and after the transient period. This particular behavior, denoted “case 1” hereafter, may be due to the obstruction generated by pressure side cavitation on the blades: such blockage results in a significant decrease of the pump head, as can be seen in figure 8 in steady state situations. Low amplitude pressure oscillations can also be observed on the inlet pressure signal, which suggests that this phenomenon is related to a surge type instability that affects the whole pump.
A third typical pattern of the pressure signals is obtained for intermediate values of the cavitation number and lower flow rates. In such conditions of moderate cavitation, a pressure peak is obtained at the pump suction at the end of the transient (figure 18). Note that a peak of similar magnitude occurs also at the same time at delivery, although it is not so visible because of high frequency pressure fluctuations. Such simultaneous pressure jumps can be associated with a water hammer phenomenon, as it was previously stated by Tanaka et al. [3]. These configurations will be denoted “case 3” hereafter.
The torque fluctuations obtained in cases 1, 2 and 3 are displayed in figure 19. As in non-cavitating conditions, the dimensionless torque evolutions are characterized by a large peak that occurs at the end of the start-up. This phenomenon is due, as clarified in Section 3.1, to the shaft inertia, so it is not related to cavitation. After this large peak, again three different comportments of the torque can be observed before the stabilized value is reached: several low frequency fluctuations (case
1), a progressive re-increase (case2), or a behavior similar to the one obtained in non cavitating conditions (see figure 12), i.e. the stabilized value of the torque is reached quasi-immediately after the large peak.
On the basis of the pressure and torque evolutions, the whole tests performed in cavitating conditions have been classified into these three different categories of transients, and the resulting map is drawn in figure 20. It confirms that large scale oscillations systematically occur at high flow rate and in conditions of developed cavitation, while water hammer phenomena are detected at lower flow rate and for a moderate development of cavitation. Such a classification has been proposed previously by Tanaka et al. [3], whereas these authors have investigated a quite different range of and (figure 21a, b). Note that the parameter K used in ordinate is based on a characteristic time of the start-up Tna, the final rotation
speed Nf, and a flow rate coefficient nf. NfTna characterizes how fast the start up is, while nf is related to the final flow rate
in steady state conditions [3]. The present experiments are reported in the same diagram (figure 21b) in order to enable the comparison with the data reported in [3].
Tanaka et al. have also detected two types of cavitation behaviors:
- a first one denoted “no fluctuation” that exhibits only a drop of the delivery pressure at the end of the start-up - a second one denoted “oscillating cavitation”, which is obtained at large flow coefficient and low cavitation number: it involves low frequency fluctuations both at the pump inlet and outlet.
Note that in both situations, no high frequency fluctuation is reported by the authors.
So, case 2 (figure 15) in the present experiments seems very close to the situation denoted “no fluctuation” in [3], and case 1 (figure 17), which is obtained also at large flow rates and low cavitation numbers, is similar to the situation of “oscillating cavitation” reported in [3].
It can be observed (figure 21) that the present tests correspond to an area of the diagram that was not investigated by Tanaka et al. Moreover, the limit between water hammer phenomena and situations of oscillations was defined by K* =7.5 in [3], while a significantly different value K* =20 is found in the present work. Such discrepancy may be related to the use of two different test rigs characterized by different pipe lengths, pipe diameters, and even pipe roughness.
To investigate the physical mechanisms involved in each type of fast start-up, the final operating point corresponding to cases 1, 2, and 3 is reported on the head drop curves presented in figure 6 (figure 22). It can be observed that the fast start-ups corresponding to case 1 (“low frequency oscillations”) have their final operating point at the end of the drop, whereas the final operating points corresponding to case 3 (“water hammer”) are located before the drop. The ones related to case 2
(“high frequency fluctuations”) are located between cases 1 and 3. It means that the final operating point in case 3 corresponds to low cavitating conditions, while developed cavitation is still present at the end of the start-up in cases 1 and 2. The figures 23, 24 and 25 present the evolution of the cavitating number according to the flow rate coefficient for the three cases. The curves corresponding to 0%, 3%, 10% and 20% of head drop are reported in order to visualize the evolution of the cavitating conditions during the fast start-up. The rotation speed, acceleration, flow rate, and time derivate of the flow rate are also drawn in order to discuss the relative influence of the different unsteady terms on the evolution of and
.
For each case, the minimum value of the cavitation number is reached simultaneously with the final rotation speed ( = 0.013 for example in figure 23). This point is related to the successive variations of the pressure in the pump suction pipe Ps,
which is used in the definition of . Note that
dt dQ K P
Ps tank * , where is the regular pressure loss. During the first
part of the pumps start-up, the flow rate increases significantly, so Ps decreases much below the pressure value in the tank.
Once the final rotation speed is reached the flow rate variation dQ/dt decreases drastically, so the static inlet pressure Ps
re-increases (see figure 15 between t = 0.5s and t = 0.6s), which leads to a significant re-increase of the cavitation number. At the end of the fast start-up (between = 0.016 and = 0.019 for case 2), only the flow rates still slowly increases, while the rotation speed is constant. This leads to a progressive increase of the inlet total pressure, which has only minor influence on the cavitation number (see the definition).
The drop of the delivery pressure in case 2 (first drop in case 1) is correlated with the minimum value of the cavitation number, i.e. the end of the rotation speed increase. Indeed, this operating point may correspond to the most developed cavitating conditions as the figure 26 shows it. Pictures A, B, C, D exhibit the cavitation development within the impeller at time t=0,308s, t=0,422s, t=0,520s, and t=0,728s, respectively. The time corresponding to these different steps (A, B, C, D) is indicated on the chart showing the evolution in picture E. From these pictures it can be checked that the most developed cavitating conditions (picture B) corresponds to the minimum value of the cavitation number.
The further re-increase of the delivery pressure is mainly due to the simultaneous re-increase of the cavitation number, which leads to more moderate development of cavitation. In case 2, the nominal pump head is progressively completely recovered: indeed, it can be observed in figure 23 that the / characteristic reaches the 0% head drop curve, i.e. low cavitating conditions. Conversely, case 1 is more complex (figure 24): lower cavitation conditions are first recovered (re-increase of the delivery pressure at t = 0.58s in figure 17), before a second drop occurs. This second drop is due to the high final flow rate
imposed in case 1: as a result, the / characteristic crosses successively the 0%, 10%, and even 20% head drop charts (see figure 24). These oscillations of the delivery pressure may be associated with large fluctuations of the vapor volume in the pump and/or in the inlet pipe, which result in perturbations in the flow rate evolution: as can be seen in figure 24-b, the second drop of the delivery pressure is correlated with a slight re-increase of the dQ/dt term. The final diminution of this transient term leads to a last re-increase of the inlet pressure (between t = 0.65 and t = 0.7 in figure 17), which probably slightly reduces the cavitation development, and thus makes a slight re-increase of the delivery pressure before its final stabilization. These fluctuations of both inlet and delivery pressure may be interpreted as a transient surge instability due to cavitation.
In case 3 (figure 25), the final value is higher than the 0% head drop limit. This suggests that a sudden collapse of nearly all the vapor contained in the pump occurs at the end of the start-up, which may be responsible for the pressure wave observed simultaneously in the inlet and delivery pressures. This water hammer type phenomenon is consistent with the interpretation proposed previously by Tanaka et al. (1999).
CONCLUSION
The behavior of a centrifugal pump has been studied in cavitating and non cavitating conditions. Both steady state flow situations and fast start-ups have been investigated. The effects of cavitation on the pump head at constant rotation speed have been characterized. Different types of unsteady behaviors have been obtained during the transients performed in cavitating conditions. At high flow rate, large scale low frequency oscillations are obtained on the pressure signal at delivery (case 1), whereas at lower flow rate, only a drop at the end of the start-up is detected (case 2). At moderate cavitation number and low flow rate, water hammer phenomena are also observed.
These results are consistent with the previous data reported by Tanaka et al. [3] with similar impeller geometry. Appropriate parameters have still to be determined to classify the different transient cavitating situations.
For cases 1 to 3, a physical analysis has been proposed to explain the evolution of the pump head during the start-up. It has been shown that low final flow rates usually enable to reach at the end of the start-up low cavitating conditions, whereas increasing the final flow rate results in more developed cavitating conditions, leading to progressive head drop of the pump. Conversely, low final flow rates result in the occurrence of water hammer phenomena that may be related to the complete sudden collapse of the vapor in the pump and/or the inlet pipe. Supplementary global and local measurements are found to be necessary to improve the understanding of the pump transient cavitating behavior, and thus to enrich the previous physical
analysis. Therefore, local non-intrusive measurements inside the impeller will be performed in the LML research team, in order to characterize more precisely the cavitation pattern obtained in the different cases detected presently.
ACKNOWLEDGEMENTS
The present work was performed in the scope of a research grant from the CNES (French Space Agency) and SNECMA Moteurs.
The authors wish to express their gratitude to SNECMA Moteurs and the CNES for their continuous support.
The authors also express their gratitude to the technical staff of the LML laboratory, especially J. Choquet and P. Olivier, who have been involved in the realization of the test facility.
REFERENCES
[1] Dazin A., Caignaert G., Bois G., 2007, “Experimental and Theoretical Analysis of a Centrifugal Pump During Fast Starting Period”, ASME J. Fluids Eng., 129, pp. 1436-1444.
[2] Tanaka T., H. Tsukamoto, 1999, “Transient Behavior of a Cavitating Centrifugal Pump at Rapid Change in Operating Conditions—Part 1: Transient Phenomena at Opening / Closure of Discharge Valve”, ASME Journal of Fluids Engineering, 121, pp. 841-849.
[3] Tanaka T., H. Tsukamoto, 1999, “Transient Behavior of a Cavitating Centrifugal Pump at Rapid Change in Operating Conditions—Part 2: Transient Phenomena at Pump Start-up/Shutdown”, ASME Journal of Fluids Engineering, 121, pp. 850-856.
[4] Tanaka T., H. Tsukamoto, 1999, “Transient Behavior of a Cavitating Centrifugal Pump at Rapid Change in Operating Conditions—Part 3: Classifications of Transient Phenomena”, ASME Journal of Fluids Engineering, 121, pp. 857-865. [5] Tsukamoto H., Yoneda H., Sagara K., 1995, “The Response of a Centrifugal Pump to Fluctuating Rotational Speed”, ASME Journal of Fluids Engineering, 117, pp 479 – 484.
[6] Picavet A., Barrand J.P., 1996, “Fast Start-up of a Centrifugal Pump – Experimental Study”, Pump Congress, Karlsruhe, Deutschland.
[7] Bolpaire S., Barrand J.P., Caignaert G., 2002, “Experimental Study of the Flow in the Suction Pipe of a Centrifugal Pump Impeller : Steady Conditions Compared With Fast Start-up”, International Journal of Rotating Machinery, 8(3), pp. 215-222.
[8] Lefebvre P.J., Barker W.P., 1995, “Centrifugal Pump Performance During Transient Operation”, ASME Journal of Fluids Engineering, 117, pp. 123 – 128.
[9] Ghelici N., 1993, “Etude du Régime Transitoire de Démarrage Rapide d’une Pompe Centrifuge”, Ph.D. thesis, Ecole Nationale Supérieure d’Arts et Métiers, Lille, France.
[10] Picavet A., 1996, “Etude des Phénomènes Hydrauliques Transitoires lors du Démarrage Rapide d’une Pompe Centrifuge”, Ph.D. thesis, Ecole Nationale Supérieure d’Arts et Métiers, Lille, France.
[11] Bolpaire S., 2000, “Etude des Ecoulements Instationnaires dans une Pompe en Régime de Démarrage ou en Régime Etabli “, Ph.D. thesis, Ecole Nationale Supérieure des Arts et Métiers, Lille, France.
Figures and tables:
Figure 1: Photography and scheme of the test rig Figure 2 : Picture of the impeller
Figure 3 : Evolution of the pump elevation according to the inlet flow rate coefficient (/=0,5% and /=4%)
Figure 4 : Evolution of (a) according to at 3000 rpm (/=5% and /=4%), (b) according to at 3000 rpm(/=9,5%), (c) according to /n for Q=Qn (/=5%), (d) the dimensionless amplitude of the radial
vibrations according to (/=4%)
Figure 5 : Head drop charts at 2500 and 3000 rpm at nominal flow rate (/=0,5% and /=0,5%) Figure 6 : Head drop charts for six inlet flow rates at 3000 rpm (/=0,5%, /=0,5% and /=4%) Figure 7 : Evolution of according to for 3%, 10% and 20% head drop (3000 rpm) (/=0,5% and /=4%) Figure 8 : Evolution of the head drop according to at constant value of (/=0,5, /=4% and /=0,5%)
Figure 9 : Evolution of the efficiency according to for six values of the inlet flow rate coefficient (3000 rpm) (/=9,5% and /=0,5%)
Figure 10 :a) Evolution of the pump head and inlet and outlet pressures, b) Inlet flow rate evolution in the suction pipe (Qf = Qn, f = 3000 rpm, no cavitation)
Figure 11 : Evolution of the rotation speed (Qf = Qn, f = 3000 rpm, no cavitation)
Figure 12: Evolution of the dimensionless torque (Qf = Qn, f = 3000 rpm, no cavitation)
Figure 13 : Comparison between the measured and calculated dimensionless torque (Qf = Qn, f = 2000 rpm)
Figure 14 : Comparison between the measured and calculated values of Cmax / Cst (Qf = Qn)
Figure 15 : Evolution of the pump head, inlet and outlet pressures, and inlet flow rate (case 2) ( = 0.091, Qf = 0.9 Qn, f = 3000 rpm)
Figure 16 : Amplitude of the radial vibrations on the pump casing for f = 3000 rpm
(a) Non cavitating conditions, Qf = Qn, (b) = 0.091, Qf =0.9 Qn
Figure 17 : Evolution of the pump head, inlet and outlet pressures, and inlet flow rate (case 1) ( = 0.091, Qf = 1.1 Qn, f = 3000 rpm)
Figure 18 : Evolution of the pump head, inlet and outlet pressures, and inlet flow rate (case 3) ( = 0.111, Qf = 0.7 Qn, f = 3000 rpm)
Figure 19 : Dimensionless torque evolutions in cavitating conditions Figure 20 : Classification of the start-ups
Figure 21 : Comparison between the present set of data and the previous results reported in [3] (a) Data from Tanaka et al., (b) Present experiments
Figure 22 : Final operating points reported on the head drop curves Figure 23 : Evolution of according to for case 2 –a) Full scale –b) Zoom Figure 24 : Evolution of according to for case 1 –a) Full scale –b) Zoom Figure 25 : Evolution of according to for case 3 –a) Full scale –b) Zoom Figure 26 : Correlation between impeller cavitation and evolution (case 2).
A : t=0,308s ; B : t=0,422s ; C : t=0,520s ; D : t=0,728s
Table 1 : Impeller specifications
Table 2 : Absolute uncertainties derived from repeatability tests (steady /transient conditions, with /without cavitation) Table 3 : Operating conditions in cavitation
Table 1
Geometric specifications Hydraulic parameters Inlet vane angle 32,2° n 2900 rpm Outlet vane angle 23° s 0,24 Number of vanes 5 Qn 23 m3/h Inlet diameter D1 38,5 mm Pn 4,9.10 5 Pa Outer diameter D2 202,5 mm Outer width b2 7 mm
Table 2 Ps (Pa) Pd (Pa) C (Nm) (rpm) st tr st tr st tr st tr No cavitation 1500 3000 2000 11000 0.15 0.5 0 45 cavitation 1500 1500 6000 10000 0.5 0.5 0 45
f (tr/min) f Qf/Qn Pressure evolution name 3000 0.091 0.9 Fig. 15 Case 2 3000 0.091 1.1 Fig. 17 Case 1 3000 0.111 0.7 Fig. 18 Case 3 Table 3